How to Use R for Conjoint Analysis
A discussion of the concepts behind conjoint analysis and a tutorial on how to use the R language to perform conjoint analysis.
Join the DZone community and get the full member experience.
Join For FreeConjoint analysis is a frequently used ( and much needed), technique in market research.
To gauge interest, consumption, and continuity of any given product or service, a market researcher must study what kind of utility is perceived by potential or current target consumers.
However, the task of modeling utility is not so easy... although it may be intuitive to consider.
We will need to typically transform the problem of utility modeling from its intangible, abstract form to something that is measurable. That is, we wish to assign a numeric value to the perceived utility by the consumer, and we want to measure that accurately and precisely (as much as possible).
This is where survey design comes in, where, as a market researcher, we must design inputs (in the form of questionnaires) to have respondents do the hard work of transforming their qualitative, habitual, perceptual opinions into simplified, summarized aggregate values which are expressed either as a numeric value or on a rank scale.
Obviously, when we look at one value (such as 10) or a range of values on a scale (1-10), we are starting from an aggregation of measurement and thus must then be broken down into components (Aggregate= SUM(Parts)).
In order to do that, we must know what factors are typically considered by respondents, as well as their preferences and trade-offs.
In order to extract answers from respondents, we must account for each possible contributing factor that plays a part in the perception of an aggregate utility (hence the term Part-Utility which is commonly referred to in Conjoint Analysis studies).
Conjoint Analysis, thus, is a methodical study of possible factors and to what extent the consideration of such factors will determine the ultimate rank or preference for a particular combination.
Let's take a real-world example from Airbnb apartment rentals. You can download and play with the data from here: http://insideairbnb.com/get-the-data.html.
Here is the code, which lists out the contributing factors under consideration.
## 1: set up the experiment and design
Library(conjoint)
factors_file<-read.csv("factors_1.csv")
names(factors_file)<-c("HostId","HostSinceInY","Neighbourhood","PropertyType","RoomType","Beds","Price")
Since the data may belong to actual users, I am choosing not to display the particular records but rather just show general, anonymized visualizations which can be gleaned from using open source tools such as R.
In terms of data structures, you have the following components to deal with for your design of collecting utility insights from respondents (consumers of your product or service).
Collection of Attributes or Factors: What must be considered for evaluating a product? This can be a combination of brand, price, dimensions, or size. Now, we cannot expect to induce fatigue in respondents by making them select every combination of the possibilities. Hence, one way is to bundle up sub-sets of combinations in what is termed as "Profiles" to vote on. Thus, a profile represents a peculiar combination of factors with pre-set levels. The variables used could look like:
Neighborhood {}
Room Type {}
Property Type {}
Discrete choices to rate or rank factors: What variations or levels are available for consumers to consider? For instance, for the size factor, it could be the three basic levels: small, medium, or large. Here is how they will look in a data frame (once you have the factorial design mapped out):
clevn
           levels
1          Queens
2   Staten Island
3 Entire home/apt
4    Private room
5     Shared room
6       Apartment
7 Bed & Breakfast
8               1
9               2
here is the CSV equivalent:
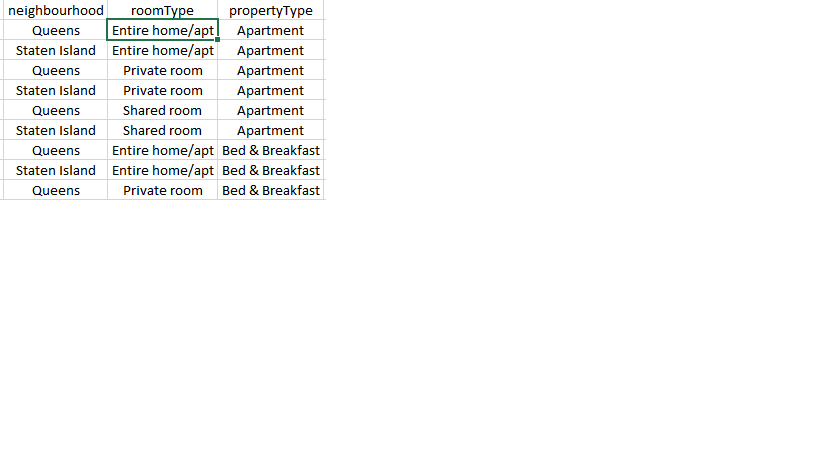
The concern we have now is, how do we map out the possible combinations?
For this, we can use R's ability to design experiments using full or partial factorial design (another varient is orthogonal, but it will be too much to discuss at this stage of the introduction).
So, a full factorial design will layout all possible combinations of various existing levels that exist within factors as mentioned earlier.
experiment<-expand.grid(
neighbourhood=levels(as.factor(factors_file$Neighbourhood)),
roomType=levels(as.factor(factors_file$RoomType)),
propertyType=levels(as.factor(factors_file$PropertyType)),
beds=levels(as.factor(factors_file$Beds)))
design=caFactorialDesign(data=experiment,type="full")
print(design)
Here is how the design looks:
print(design)
   neighbourhood        roomType    propertyType beds
1         Queens Entire home/apt       Apartment    1
2  Staten Island Entire home/apt       Apartment    1
3         Queens    Private room       Apartment    1
4  Staten Island    Private room       Apartment    1
5         Queens     Shared room       Apartment    1
6  Staten Island     Shared room       Apartment    1
7         Queens Entire home/apt Bed & Breakfast    1
8  Staten Island Entire home/apt Bed & Breakfast    1
9         Queens    Private room Bed & Breakfast    1
10 Staten Island    Private room Bed & Breakfast    1
11        Queens     Shared room Bed & Breakfast    1
12 Staten Island     Shared room Bed & Breakfast    1
13        Queens Entire home/apt       Apartment    2
14 Staten Island Entire home/apt       Apartment    2
15        Queens    Private room       Apartment    2
16 Staten Island    Private room       Apartment    2
17        Queens     Shared room       Apartment    2
18 Staten Island     Shared room       Apartment    2
19        Queens Entire home/apt Bed & Breakfast    2
20 Staten Island Entire home/apt Bed & Breakfast    2
21        Queens    Private room Bed & Breakfast    2
22 Staten Island    Private room Bed & Breakfast    2
23        Queens     Shared room Bed & Breakfast    2
24 Staten Island     Shared room Bed & Breakfast    2
This design should now serve as input for creating a survey questionnaire so that responses can be extracted methodically from respondents.
It is through these responses that our consumers will reveal their perceived utilities for factors in consideration.
Now, let's discuss the actual recording and attribution of rating or ranking. Once we have mapped the supposedly contributing factors and their respective levels, we can then have the respondents rate or rank them.
The ranks themselves are between 1 and 10.
I have recorded opinions of 5 example respondents given the combination of contributing factors namely:
Neighborhood {Queens, Staten Island}
Room Type {Entire home/apt, Private Room, Shared Room}
Property Type {Apartment, Bed & Breakfast}
Here is how the opinions look in CSV format when they are recorded against the factorial design computed earlier.
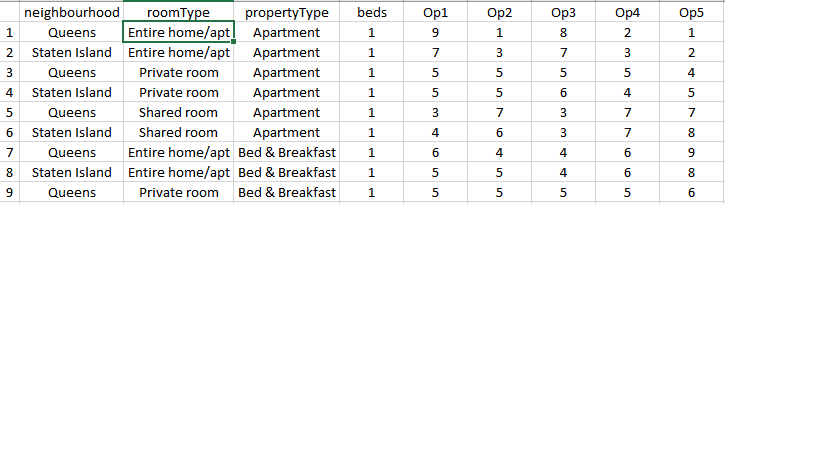 We probably will need little bit more work, in reshaping the responses so that R can process them as a matrix or data frame.
The transform which is used in this case is a simple transpose operation.
Additionally, you may want to convert rankings provided by respondants to scores through another built-in R function.
head(preferences)
  profil1 profil2 profil3 profil4 profil5 profil6 profil7 profil8 profil9 profil10 profil11 profil12 profil13 profil14 profil15 profil16 profil17 profil18 profil19
1      16      18      20      20      22      21      19      20      20       21       23       24       15       17       19       19       21       20       18
2      24      22      20      20      18      19      21      20      20       19       17       16       25       23       21       21       19       20       22
3      17      18      20      19      22      22      21      21      20       19       22       22       16       17       19       18       21       21       20
4      23      22      20      21      18      18      19      19      20       21       18       18       24       23       21       22       19       19       20
5      24      23      21      20      18      17      16      17      19       20       22       23       24       23       21       20       18       17       16
  profil20 profil21 profil22 profil23 profil24
1       19       19       20       22       23
2       21       21       20       18       17
3       20       19       18       21       21
4       20       21       22       19       19
5       17       19       20       22       23
>
So, we got the basic data structures in place, namely:
Profiles to vote on.
Respective levels to consider while voting.
Ranked or scored preferences by one or more respondents.
This should enable us to finally run a Conjoint Analysis in R as shown below:
Conjoint(y = preferences, x = cprof, z = clevn)You will need to download the Conjoint Package prior to running the scripts shown here.
That's it! R will do whatever is needed to enable you to visualize the utilities respondents have perceived while recording their responses.
We can easily see that RoomType and PropertyType are the two most significant factors when choosing rentals.
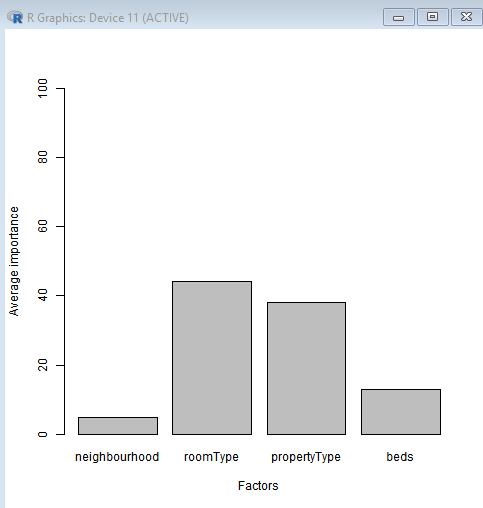
We can further drill down into sub-utilities for each of the above factors.
For instance, we can see a contrast between perceived utilities for PropertyType - Apartment versus PropertyType- Bed & Breakfast.
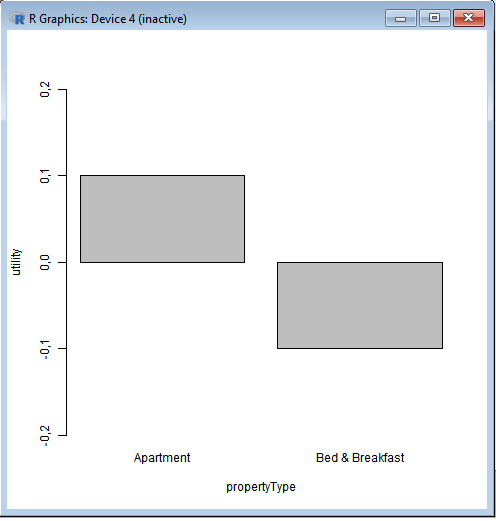
This tells us that Consumers were more inclined towards choosing PropertyType of Apartment than Bed & Breakfast.
You can also get the numeric values for each part utility for each respondent.
caPartUtilities(y = preferences, x = cprof, z = clevn)
     intercept Queens Staten Island Entire home/apt Private room Shared room
[1,]    19.833 -0.333         0.333          -2.083       -0.083       2.167
[2,]    20.167  0.333        -0.333           2.083        0.083      -2.167
[3,]    19.750  0.083        -0.083          -1.000       -0.750       1.750
[4,]    20.250 -0.083         0.083           1.000        0.750      -1.750
[5,]    20.000  0.000         0.000           0.000        0.000       0.000
     Apartment Bed & Breakfast    1    2
[1,]    -0.833           0.833  0.5 -0.5
[2,]     0.833          -0.833 -0.5  0.5
[3,]    -0.583           0.583  0.5 -0.5
[4,]     0.583          -0.583 -0.5  0.5
[5,]     0.500          -0.500  0.0  0.0
This completes our walk through of the powerful conjoint analysis capabilities that R can offer with its simplicity and elegance.
Opinions expressed by DZone contributors are their own.
Comments