Drupal Log Analysis Using the ELK Stack
Sure, logging is hard for lumberjacks, but why does it have to be so hard for developers? How does ELK stack up when it comes to easing the pain of your log analysis?
Join the DZone community and get the full member experience.
Join For Freewhile most developers and devops teams will admit that logging is important, many will still insist on avoiding the task if possible. although log files contain a wealth of valuable information and should therefore be the first place to look at when troubleshooting errors and events, they are often opened only as a last resort.

the reason for this is simple: log files are not easy. they're not easy to access, they're not easy to collect, and they're not easy to read. often, they can't even be found to start with. these problems have only intensified over the past few years, with applications being built on top of distributed infrastructures and containerized architectures.
drupal applications add another layer of complexity to this, offering basic logging features for developers and being complex creatures to start with. drupal developers can define the message type and the severity level (for example, "emergency" or "debug") for logs and have the messages saved to the database. drupal 8 also provides a logging class (that replaces watchdog) to write custom logs to the database.
but for modern apps, querying the database for error messages and analyzing drupal and php logs is not enough. there are web server and database logs to sift through as well, and in a normal sized production environment, this means a ton of data.
no.
a more solid solution is required that will allow you to centralize all of the streams of log data being generated by the app, query this data to identify correlations and anomalies, and monitor the environment for events.
enter the elk stack . the most popular and fastest-growing open source log analytics platform, elk allows you to build a centralized logging system that can pull logs from as many sources as you define and then analyze and visualize the data.
to show an example of using elk, this article will go through the steps of establishing a pipeline of logs from your drupal application into the logz.io elk stack . you can, if you like, use any instance of the stack to perform the exact same procedure.
my environment
a few words on the environment i'm using for this tutorial. i'm using an aws ubuntu 14.04 instance and have installed drupal 8 on top of the standard lamp stack. for instructions on how to get this set up, i recommend reading this cloud academy post .
note: you will need to install the gd extension because this is a minimum requirement for drupal 8.
preparing the log files
my first step is to prepare the log files that we want to track and analyze. in the case of a standard lamp stack, this usually means web server logs, php error logs (which include drupal errors as well), and mysql logs.
php errors, such as undefined variables and unknown functions, are logged by default into the apache error log file ( /var/logs/apache2/error.log ), which is convenient in some cases. but to make our analysis work easier, it's better to separate the two log streams.
to do this, i'm going to access my 'php.ini' file and define a new path for php errors:
error_log=/var/log/php_errors.log
next, i'm going to restart apache and verify the change using phpinfo() .
installing filebeat
while there are numerous ways to forward data into elk, i'm going to ship my log files using filebeat — which is a log shipper created by elastic that tails defined log files and sends the traced data to logstash or elasticsearch.
to install filebeat from the repository, i'm going to first download and install the public signing key:
$ curl https://packages.elasticsearch.org/gpg-key-elasticsearch | sudo apt-key add -
next, i'm going to save the repository definition to /etc/apt/sources.list.d/beats.list :
$ echo "deb https://packages.elastic.co/beats/apt stable main" | sudo tee -a /etc/apt/sources.list.d/beats.list
finally, i'm going to run apt-get update and install filebeat:
$ sudo apt-get update && sudo apt-get install filebeat
now, because logz.io uses tls as an added security layer, my next step before configuring the data pipeline is to download a certificate and move it to the correct location:
$ wget http://raw.githubusercontent.com/cloudflare/cfssl_trust/master/intermediate_ca/comodorsadomainvalidationsecureserverca.crt

$ sudo mkdir -p /etc/pki/tls/certs

$ sudo cp comodorsadomainvalidationsecureserverca.crt /etc/pki/tls/certs/
configuring filebeat
my next step is to configure filebeat to track my log files and forward them to the logz.io elk stack. to demonstrate this configuration, i'm going to show how to define tracking for my php and apache log files. (the process is similar for mysql logs as well.)
in the filebeat configuration file at /etc/filebeat/filebeat.yml , i'm going to define a prospector for each type of logs. i'm also going to add some logz.io-specific fields (codec and user token) to each prospector.
the configuration is as follows:
################### filebeat configuration example ############################

############################# filebeat #####################################

filebeat:
    # list of prospectors to fetch data.
    prospectors:
    # this is a text lines files harvesting definition
    -
        paths:
            - /var/log/php_errors.log
        fields:
            logzio_codec: plain
            token: twmkrepsacfabstpklzeexgceivmpuhb
        fields_under_root: true
        ignore_older: 24h
        document_type: php
    -
    paths:
        - /var/log/apache2/*.log
    fields:
        logzio_codec: plain
        token: twmkrepsacfabstpklzeexgceivmpuhb
    fields_under_root: true
    ignore_older: 24h
    document_type: apache
    registry_file: /var/lib/filebeat/registry
in the output section, i'm going to define the logz.io logstash host (listener.logz.io:5015) as the output destination for our logs and the location of the certificate used for authentication.
############################# output ########################################

# configure what outputs to use when sending the data collected by the beat.
output:
    logstash:
        # the logstash hosts
        hosts: ["listener.logz.io:5015"]
        tls:
            # list of root certificates for https server verifications
            certificate_authorities: ['/etc/pki/tls/certs/comodorsadomainvalidationsecureserverca.crt']
now, if i were using the open-source elk stack, i could ship directly to elasticsearch or use my own logstash instance. the configuration for either of these outputs, in this case, is straightforward:
output:
    logstash:
        hosts: ["localhost:5044"]
    elasticsearch:
        hosts: ["localhost:9200"]
save your filebeat configuration.
beautifying the php logs
logstash, the component of the elk stack that is in charge of parsing the logs before forwarding them to elasticsearch, can be configured to manipulate the data to make the logs more readable and easier to analyze (a.k.a., log "beautification" or "enhancement").
in this case, i'm going to use the grok plugin to parse the php logs. if you're using logz.io, grokking is done by us. but if you're using the open-source elk, you can simply apply the following configuration directly to your logstash configuration file ( /etc/logstash/conf.d/xxxx.conf ):
if [type] == "php" {
    grok {
        match => [
            "message", "\[%{monthday:day}-%{month:month}-%{year:year} %{time:time} %{word:zone}\] php %{data:level}\:  %{greedydata:error}"
            ]
        }
    mutate {
        add_field => [ "timestamp", "%{year}-%{month}-%{day} %{time}" ]
        remove_field => [ "zone", "month", "day", "time" ,"year"]
    }
    date {
        match => [ "timestamp" , "yyyy-mmm-dd hh:mm:ss" ]
        remove_field => [ "timestamp" ]
    }
}
verifying the pipeline
it's time to make sure the log pipeline into elk is working as expected.
first, make sure filebeat is running:
$ cd /etc/init.d

$ ./filebeat status
and if not, enter:
$ sudo ./filebeat start
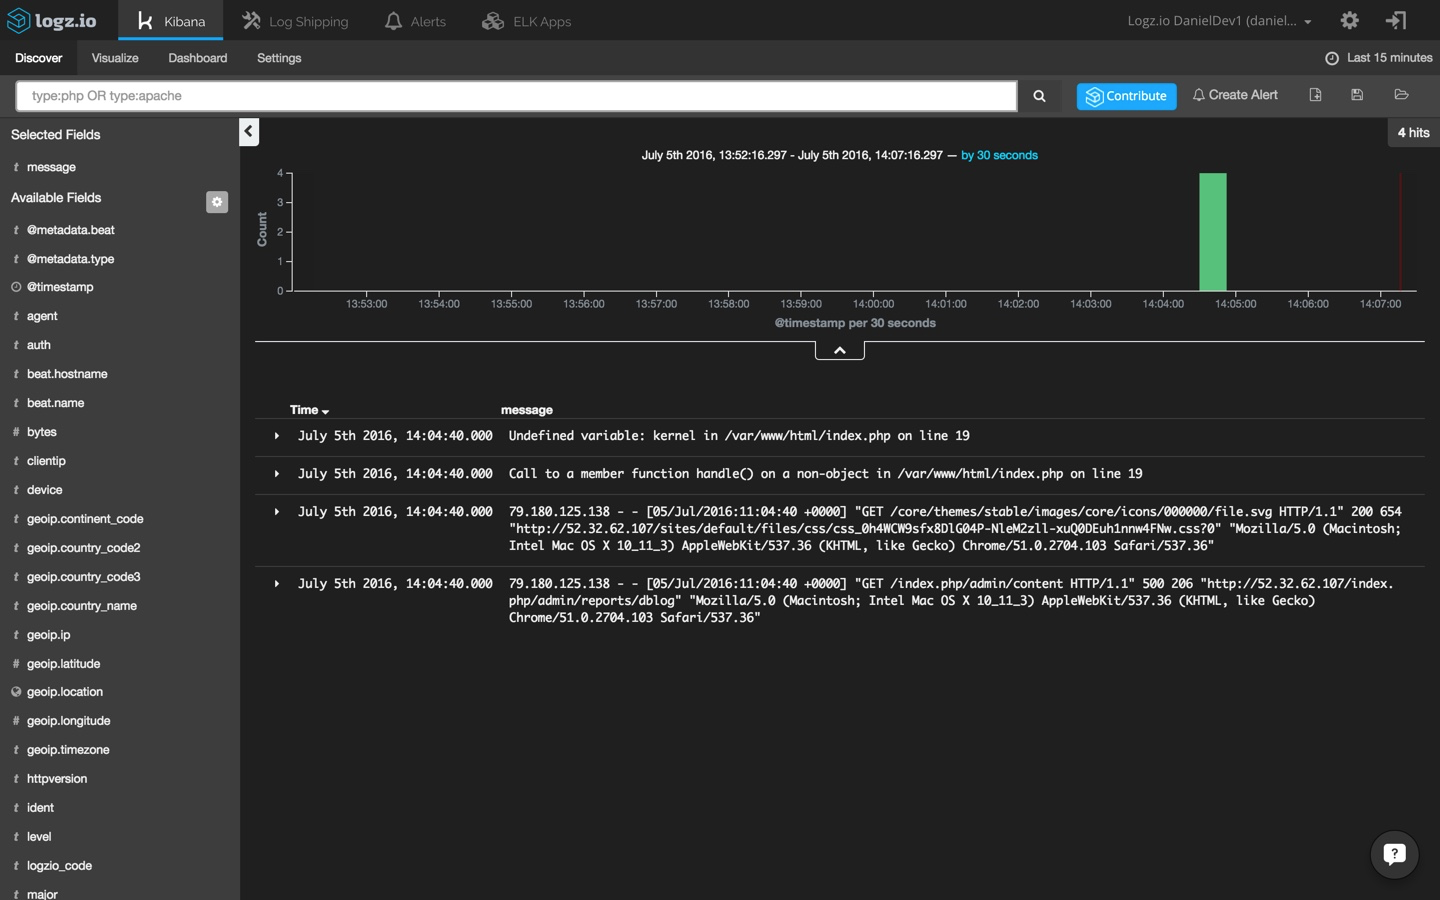
next, open up kibana (integrated into the logz.io user interface). apache logs and php errors will begin to show up in the main display area.
in this case, we're getting an undefined variable error that i have simulated by editing the 'index.php' file. note that since i have other logs coming into my system from other data sources, i'm using the following kibana query to search for the two log types we have defined in filebeat:
type:php or type:apache
analyzing the logs
to start making sense of the data being ingested and indexed by elasticsearch, i'm going to select one of the messages in the main display area — this will give me an idea of what information is available.
now, remember the different types that we defined for the filebeat prospectors? to make the list of log messages more understandable, select the 'type,' 'response,' and 'level' fields from the list of mapped fields on the left. these fields were defined in the grok pattern that we applied to the logstash configuration.
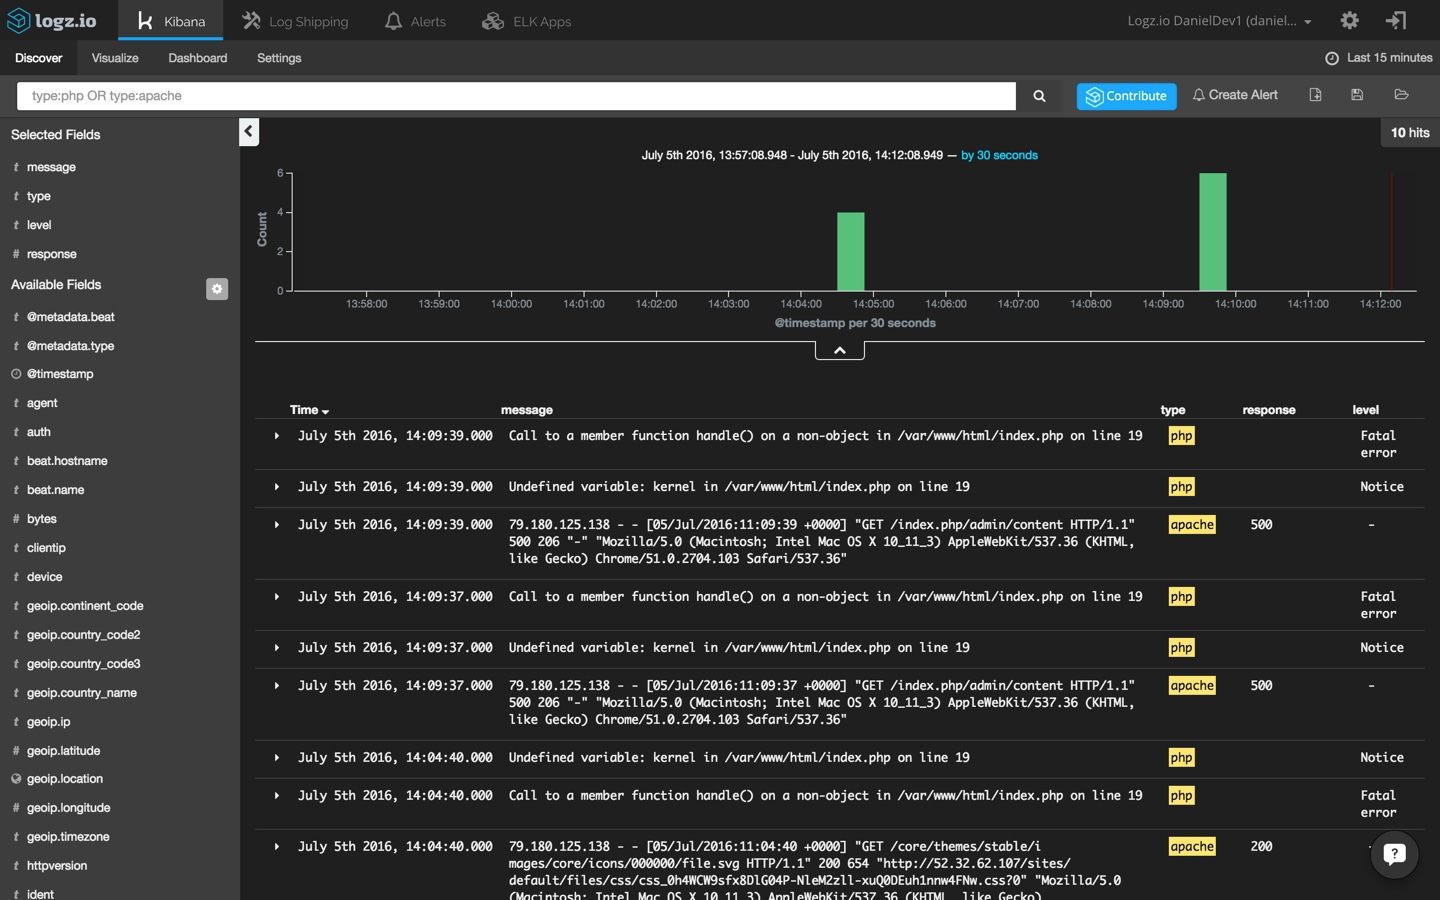
open one of the messages and view the information that has been shipped into the system:
{
    "_index": "logz-dkdhmyttiiymjdammbltqliwlylpzwqb-160705_v1",
    "_type": "php",
    "_id": "avw6v83dflteqwts7ydz",
    "_score": null,
    "_source": {
        "level": "notice",
        "@metadata": {
            "beat": "filebeat",
            "type": "php"
         },
         "source": "/var/log/php_errors.log",
         "message": "undefined variable: kernel in /var/www/html/index.php on line 19",
         "type": "php",
         "tags": [
             "beats-5015"
         ],
         "@timestamp": "2016-07-05t11:09:39.000z",
         "zone": "utc",
         "beat": {
             "hostname": "ip-172-31-37-159",
             "name": "ip-172-31-37-159"
         },
         "logzio_code": "plain"
     },
     "fields": {
         "@timestamp": [
             1467716979000
         ]
     },
    "highlight": {
        "type": [
            "@kibana-highlighted-field@php@/kibana-highlighted-field@"
        ]
    },
    "sort": [
        1467716979000
    ]
}
visualizing the logs
one of the advantages of using the elk stack is its ability to create visualizations on top the data stored on elasticsearch. this allows you to create monitoring dashboards that can be used to efficiently keep tabs on your environment.
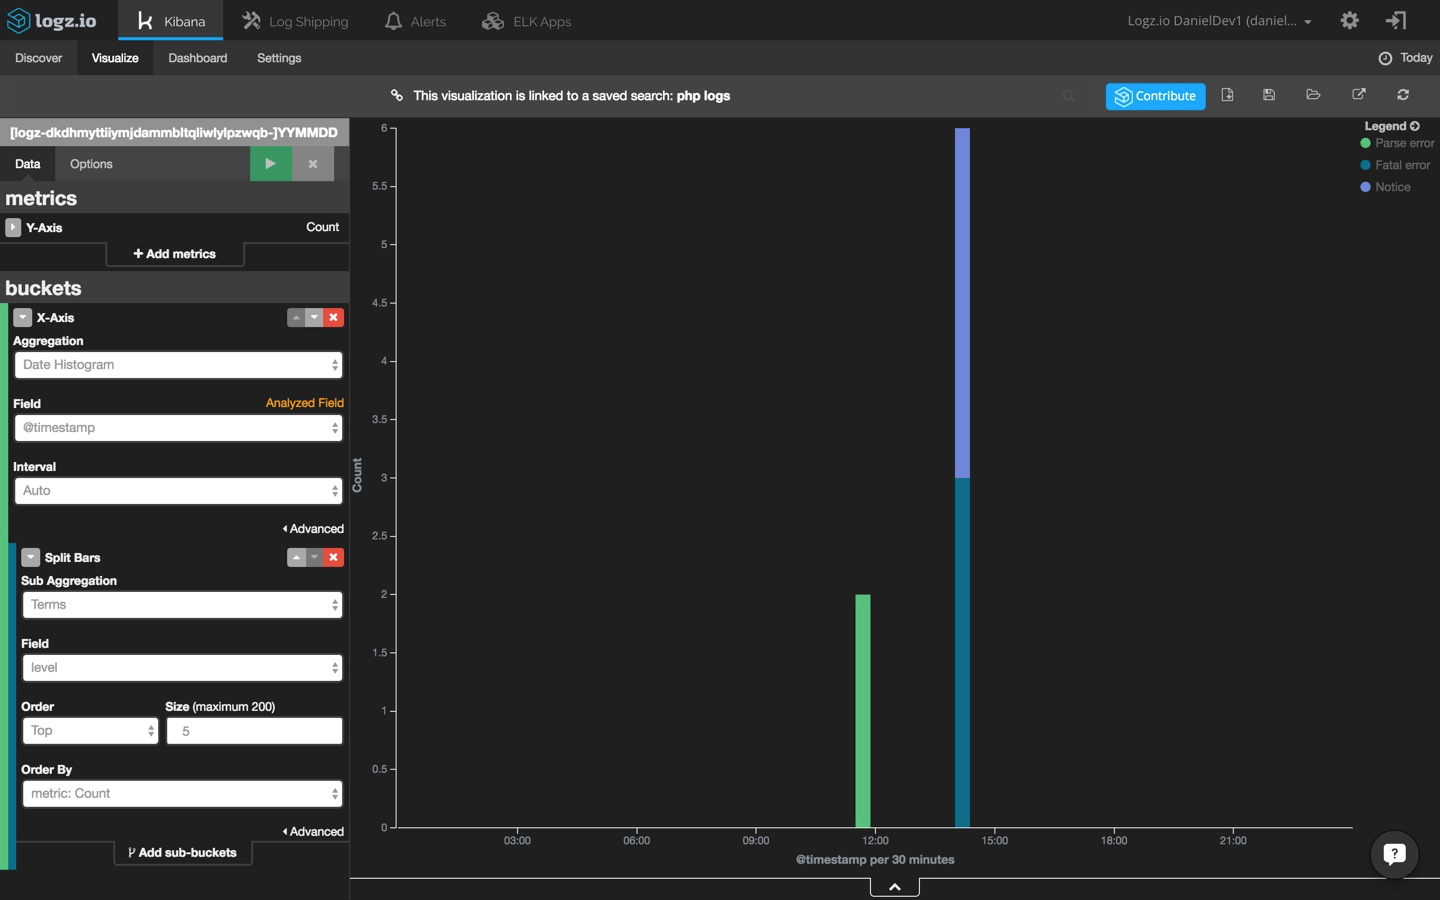
as an example, i'm going to create a line chart that shows the different php and drupal errors being logged over time.
selecting the visualize tab in kibana, i'm going to pick the line chart visualization type from the selection of available visualizations. then, i'm going to select to create the visualization based on a new search and use this query to search for only php and drupal events: 'type:php.'
all that's left now is to configure the visualization. easier said than done, right? the truth is that creating visualizations in kibana can be complicated at times and takes some trial and error testing before fine-tuning it to get the best results.
we're going to keep it simple. we're using a simple count aggregation for the y-axis and a date histogram cross-referenced with the 'level' field.
the configuration for our line chart visualization looks as follows:
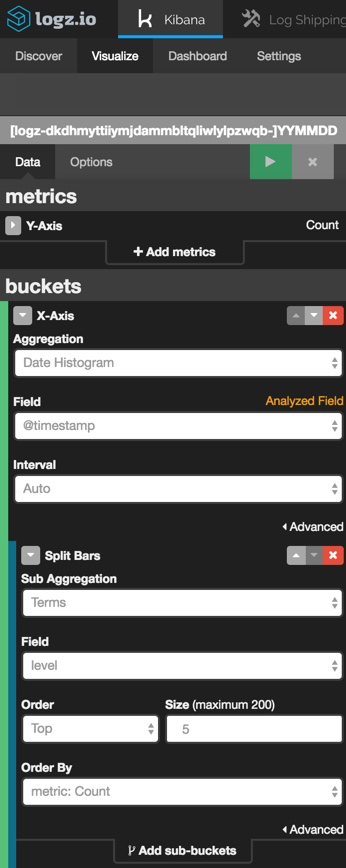
hit the green play button to see a preview of the visualization:
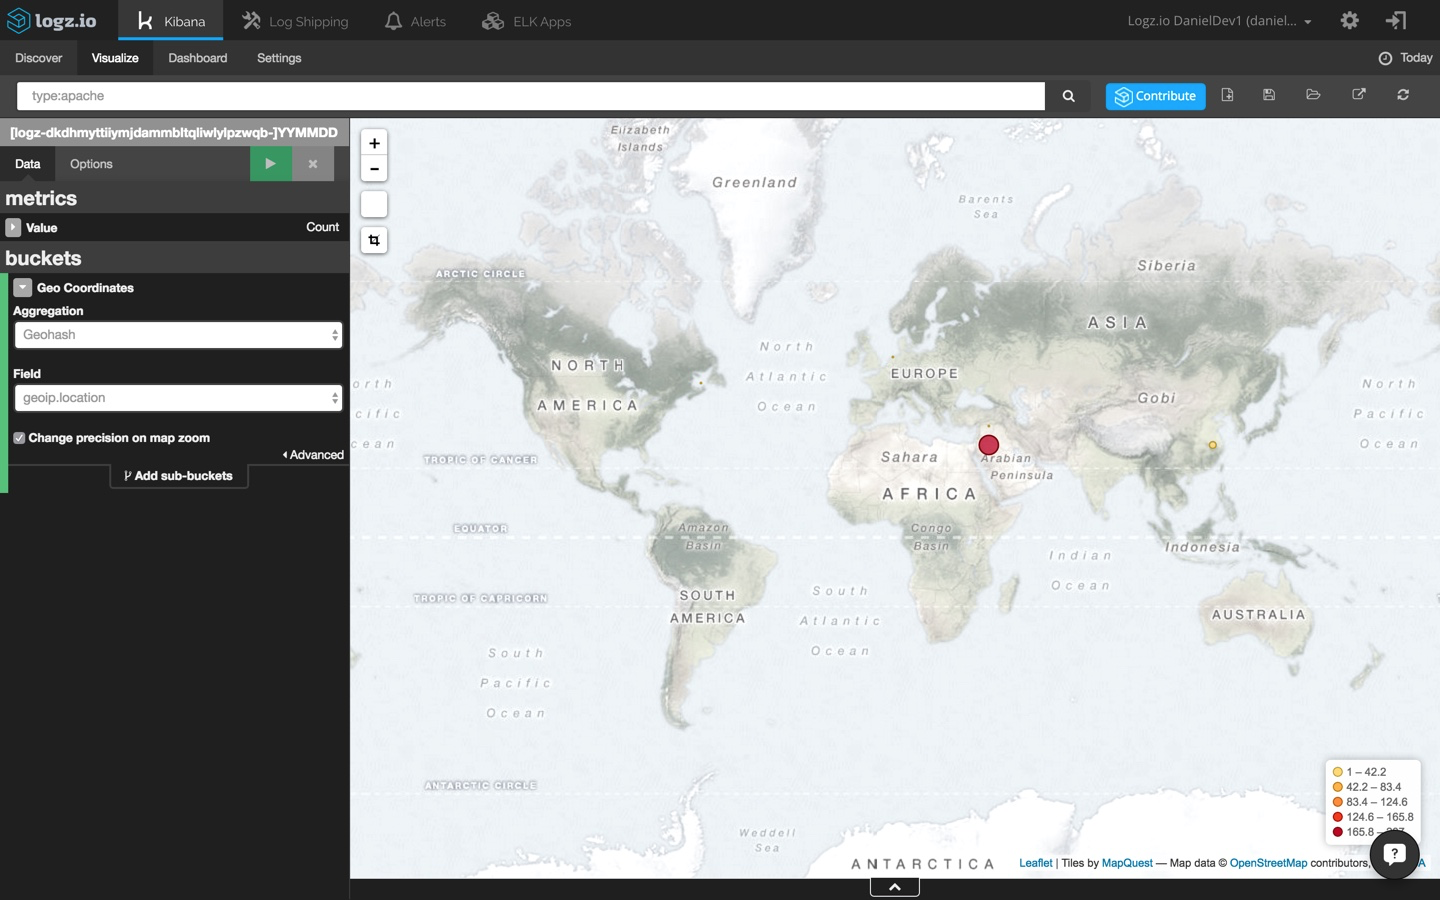
a common visualization for web application environments is a map of web server requests. this gives you a general picture of where requests are coming from (and in this case, from where yours truly is writing this post).
selecting the tile map visualization this time, i'm going to change my kibana query to:
type:apache
then, the configuration is simple:
of course, these are merely basic demonstrations of how to visualize your log data in kibana and how elk can be used to analyze and monitor drupal applications. the sky's the limit. you can build much more complex visualizations and even create your own custom kibana visualization type if you like.
once you have a series of visualizations for monitoring your drupal app, you can collect them in a dashboard giving you a general overview of your environment.
Published at DZone with permission of Daniel Berman. See the original article here.
Opinions expressed by DZone contributors are their own.
Comments