Eclipse MAT: Tidbits
Eclipse MAT is a great JVM Memory Analysis tool. Here are a few tidbits to use it effectively. I would highly recommend installing a Stand-alone version.
Join the DZone community and get the full member experience.
Join For FreeEclipse MAT is a great JVM Memory Analysis tool. Here are a few tidbits to use it effectively.
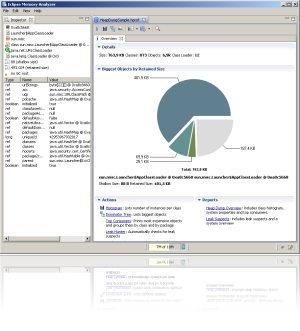
Fig: Eclipse MAT.
1. Use Stand-alone Version
Two versions of Eclipse MAT is available:
- Stand-alone.
- Eclipse Plugin.
Based on my personnel experience, the stand-alone version seems to works better and faster than the plugin version. So I would highly recommend installing a Stand-alone version.
2. Eclipse MAT — Heap Size
If you are analyzing a heap dump of size say 2 GB, allocate at least 1 GB additional space for Eclipse MAT. If you can allocate more heap space then it's more the merrier. You can allocate additional heap space for the Eclipse MAT tool, by editing the MemoryAnalyzer.ini file. This file is located in the same folder where MemoryAnalyzer.exe is present. To the MemoryAnalyzer.ni you will add -Xmx3g at the bottom.
Example:
-startup
plugins/org.eclipse.equinox.launcher_1.3.0.v20140415-2008.jar
--launcher.library
plugins/org.eclipse.equinox.launcher.win32.win32.x86_64_1.1.200.v20140603-1326
-vmargs -Xmx3g
3. Enable 'Keep Unreachable Objects'
From its reporting, Eclipse MAT removes the object which it thinks is 'unreachable.' As 'unreachable,' objects are eligible for garbage collection, and MAT doesn't display them in the report. Eclipse MAT classifies Local variables in a method as 'unreachable objects'. Once the thread exits the method, objects in local variables will be eligible for garbage collection.
However, there are several cases where the thread will go into a 'BLOCKED' or prolonged 'WAITING,' 'TIMED_WAITING' state. In such circumstances local variables will be still alive in memory, occupying space. Since Eclipse MAT default settings don't show the unreachable objects, you will not get visibility into these objects. You can change the default settings in Eclipse MAT 1.4.0 version by:
1. Go to Window > Preferences …
2. Click on 'Memory Analyzer.'
3. Select 'Keep unreachable objects.'
4. Click on 'OK' button.
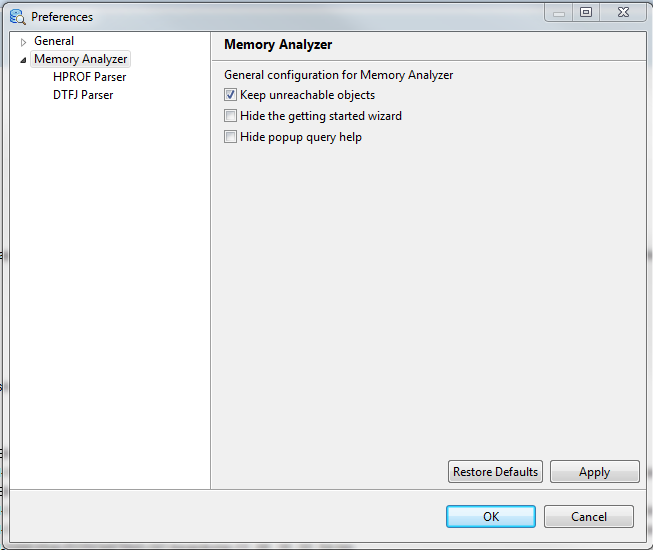
Fig: Eclipse MAT 1.4.0, showing how to enable 'Keep unreachable objects.'
4. Smart Data Settings
Eclipse MAT by default displays data in bytes. It's difficult to read large object sizes in bytes and digest them. Example Eclipse MAT prints object size like this: '193,006,368.' It's much easier if this data can be displayed in KB, MB, GB, i.e., '184.07 MB.'

Fig: Eclipse MAT default option showing object size in bytes.
Eclipse MAT provides an option to display object size in KB, MB, GB based on their appropriate size. It can be enabled by following the below steps:
- Go to Window > Preferences …
- Click on 'Memory Analyzer.'
- In the 'Bytes Display' section select 'Smart: If the value is a gigabyte or …'
- Click on the 'OK' button.

Fig: Settings to enable 'smart' data display.
Once this setting change is made, all data will appear in much more readable KB, MB, GB format, as shown in the below figure.
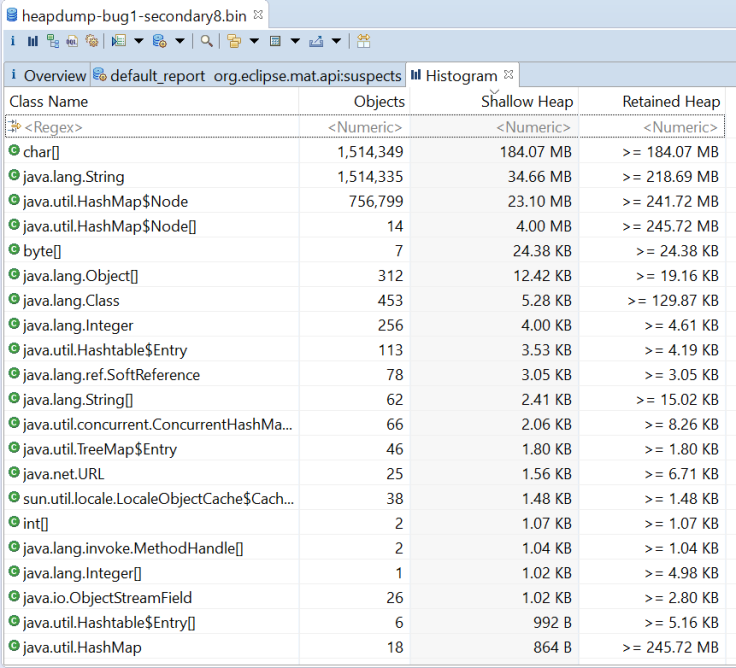
Fig: Eclipse MAT displaying object size in KB, MB, GB after enabling 'smart' settings.
Opinions expressed by DZone contributors are their own.
Comments