

Debug Like a Pro in 2025: 10 New Eclipse Java Debugger Features to Enhance Your Productivity (With Spring Boot Examples)
Eclipse Java Debugger in 2025 is faster and smarter. This post explores 10 new features using a Spring Boot app that handles books, reviews, and recommendations.
Join the DZone community and get the full member experience.
Join For FreeYou’re debugging a bug related to inflated ratings in the /books/{id}/summary endpoint. You drop a breakpoint in BookService.getAverageRating(String), step through the code, and inspect the reviews list in the Variables view. Everything looks fine… until you spot a suspicious entry, a review for the same user added more than once. You pause and think: “Hmm… maybe these duplicate entries are causing the issue. Should I be using a Set instead of a List?” So, you try to locate where this reviews variable is declared. And that’s when it hits you, the code isn’t exactly minimal!
1. Navigate to Variable Declaration - “Which Variable Is This? I’ve Seen That Name 5 Times Already..”
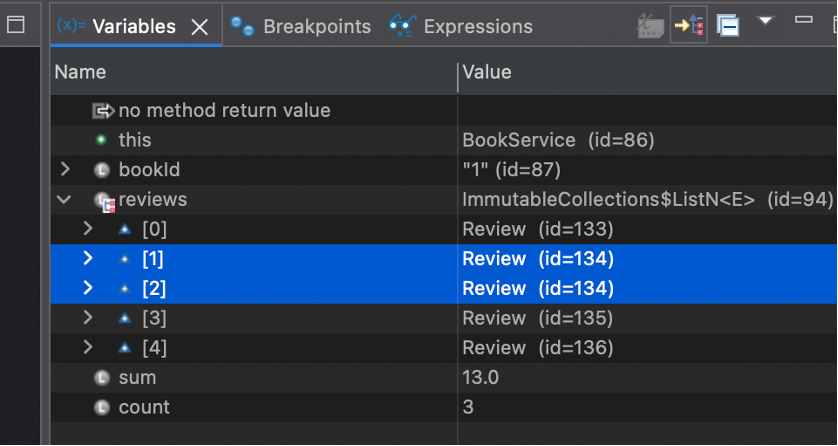
The code...
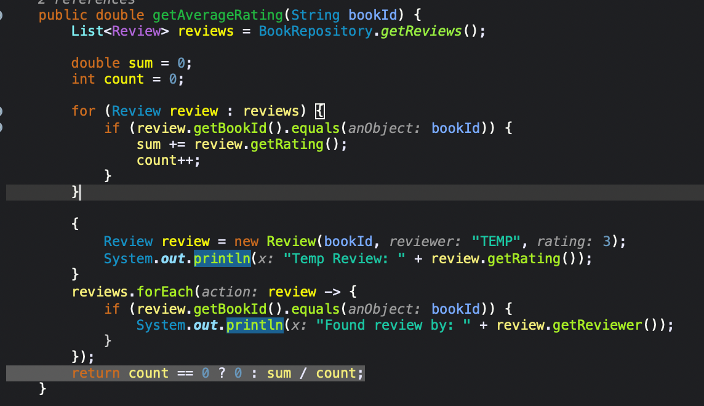
The method uses the same variable name “review” multiple times. And to make things worse, reviews is also a parameter or variable name in other methods
“Wait, which review am I actually looking at right now?”
“Where exactly was this declared?”
Instead of scrolling through code or trying to match line numbers, you can now use Eclipse’s Navigate to Declaration. Right-click the review variable in the Variables view and choose "Navigate to Declaration". Eclipse takes you straight to the correct line, whether it’s in the loop, the lambda, or the block. No more confusion. No more guessing.
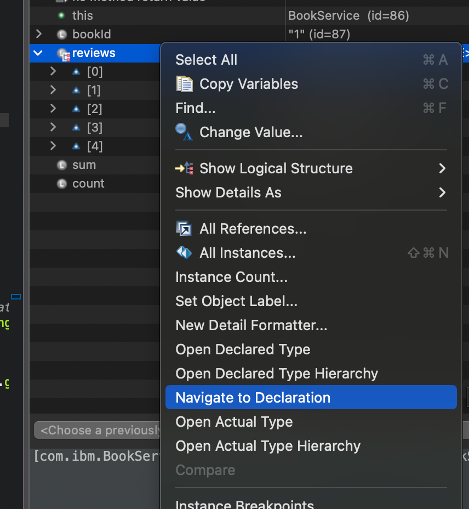
Note: This is different from Open Declared Type, which takes you to the class definition (eg. java.util.List for reviews variable), not the actual line where the variable was introduced in the code.
2. Collapse Stack Frames - “Where’s My Code in This Sea of Spring and Servlet Stack Traces?”
While debugging that review variable earlier using Navigate to Declaration, you probably noticed something else: the stack trace was huge
You might have thought: “Do I really need to see all these internal Spring and servlet calls every time I hit a breakpoint?” - Not anymore. Eclipse now gives you a Collapse Stack Frames option and it’s a lifesaver when working in frameworks like Spring Boot!
In the Debug view, go to More options -> Java -> Collapse Stack Frames
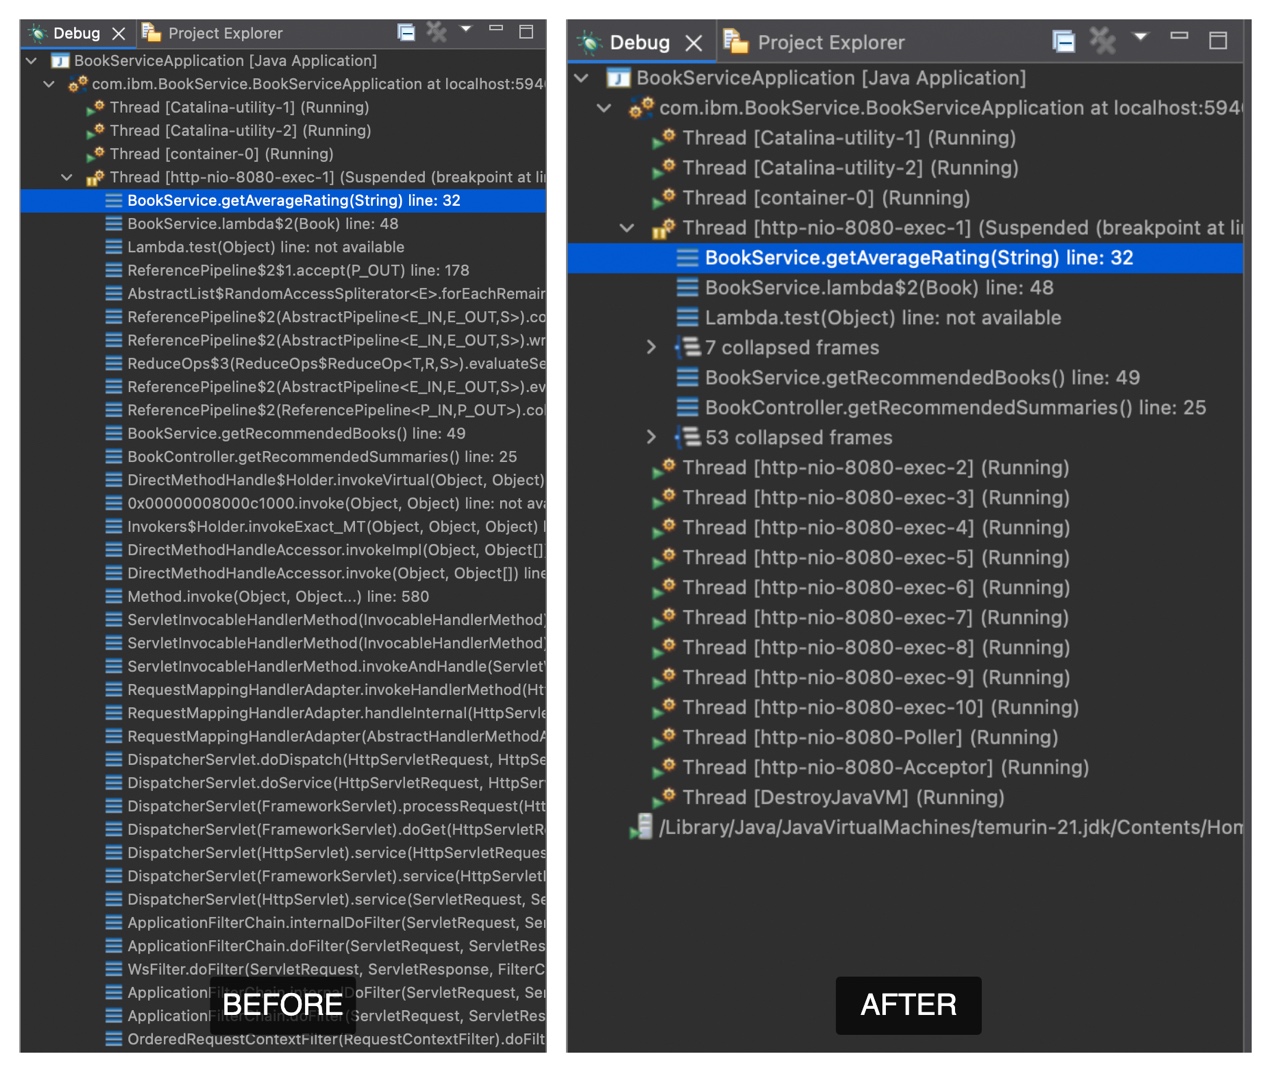
Now that’s clean!
3. Intelligent Stacktrace Navigation - “Do I Really Need the Full Class Name to Find This Method?”
In a typical microservice or multi-module setup, you’ve probably done this:
You added two new services for different book operations, like importing books and analytics. Each of them has its own BookService class (same name, but different methods). Everything works fine… until a test fails, and you’re left with a vague stack trace: BookService.formatSummary(Book) line: 44
In older Eclipse versions, unless you had the fully qualified class name, it would either show no matches or list every class named BookService which forced you to dig through them all.
Like this….
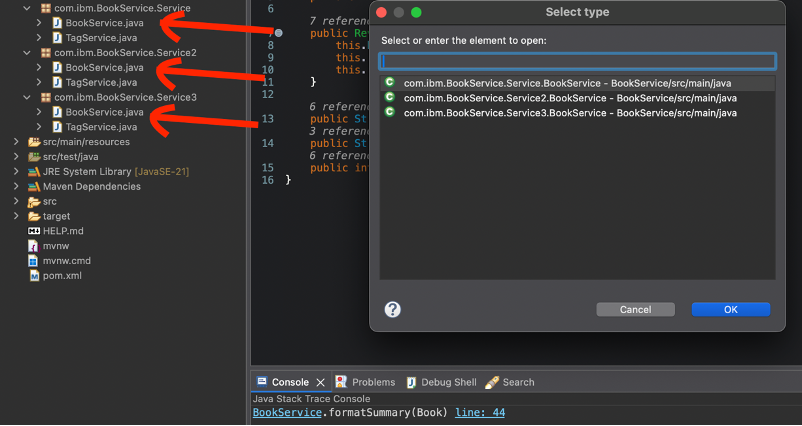
Now you’re left wondering: “Which BookService is this coming from?”
Not anymore… :D
Now Eclipse Understands the Signature!
If the stack trace includes the method name and signature, Eclipse can now disambiguate between classes with the same name.
So on latest Eclipse (v4.35 onwards) you will be redirected to the indented class.
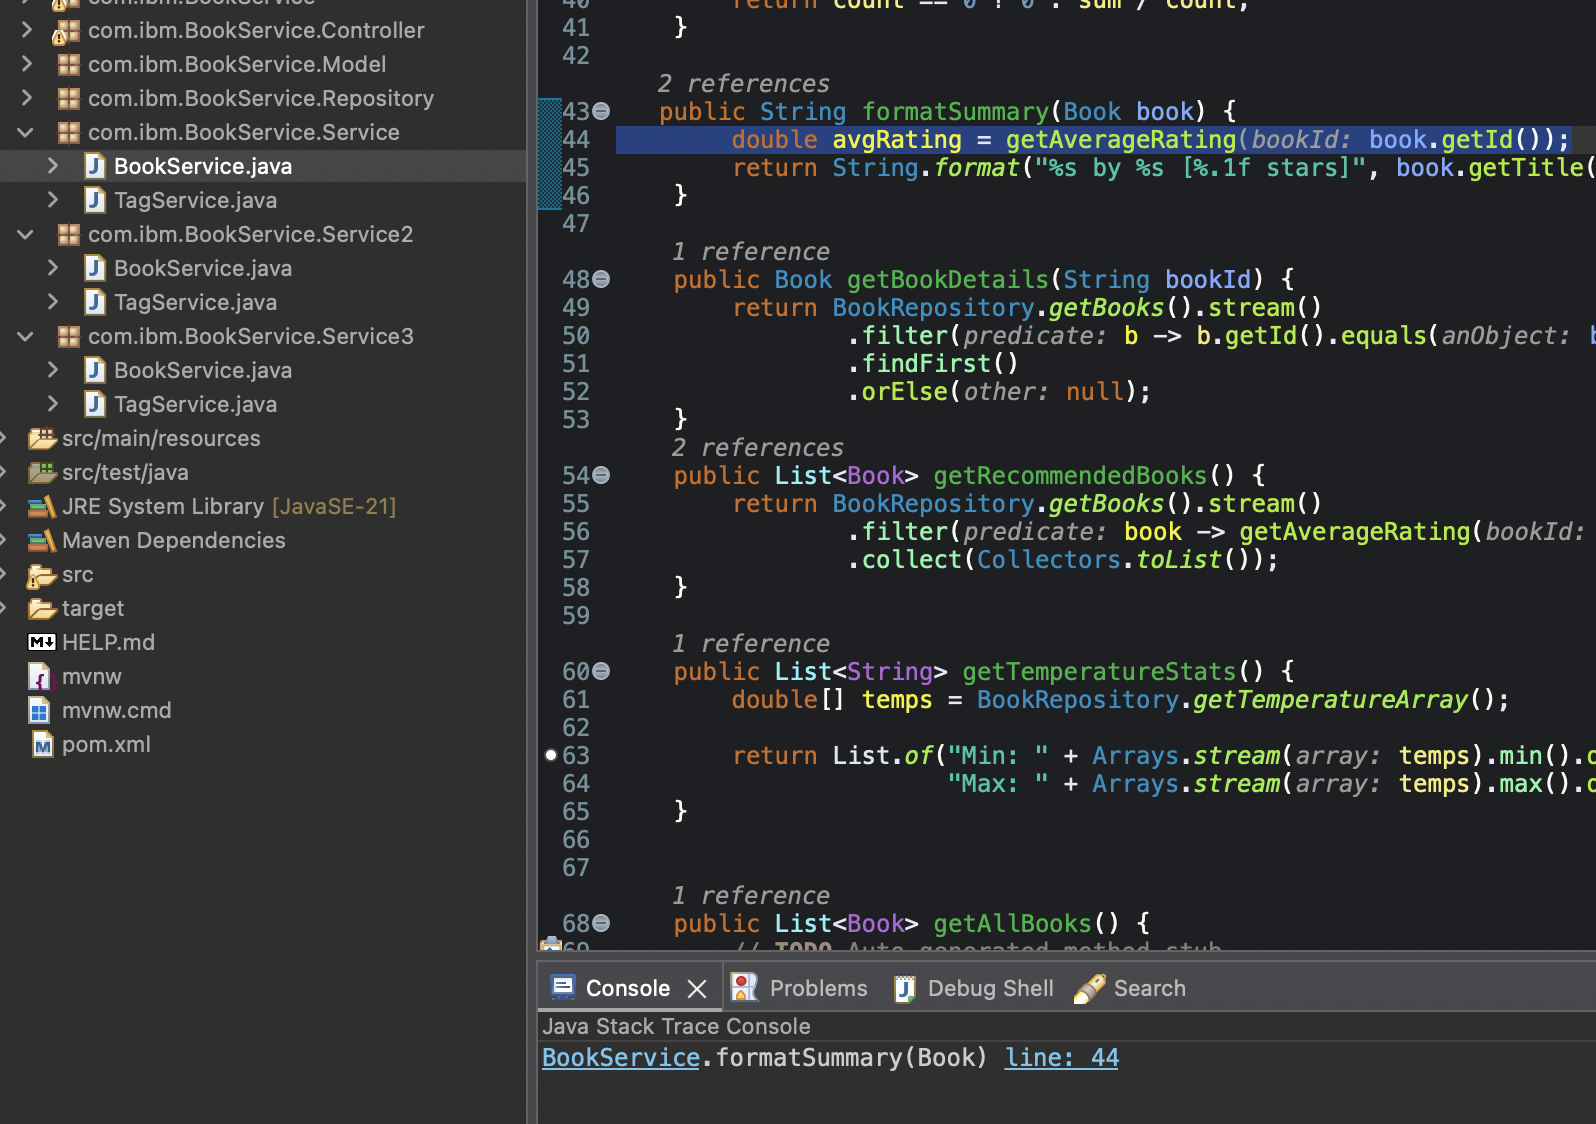
“Yeah that’s the right one!”
4. JDK-Specific Navigation - “Why Am I Seeing StringJoiner From the Wrong JDK Version?”
You’re debugging something deep.. maybe a library or JDK class like StringJoiner. You get a stack trace with versioned info like
java.util.StringJoiner.compactElts([email protected]/StringJoiner.java:248)
In older Eclipse versions, you’d get the list of available JDK source, maybe from Java 22,21 & 23 which doesn’t match what you’re running.
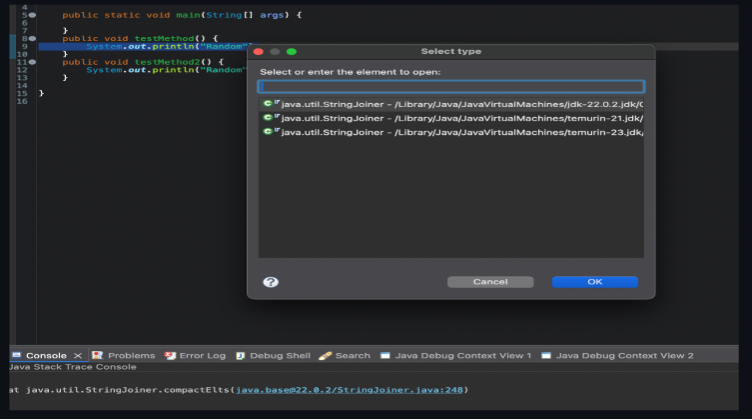
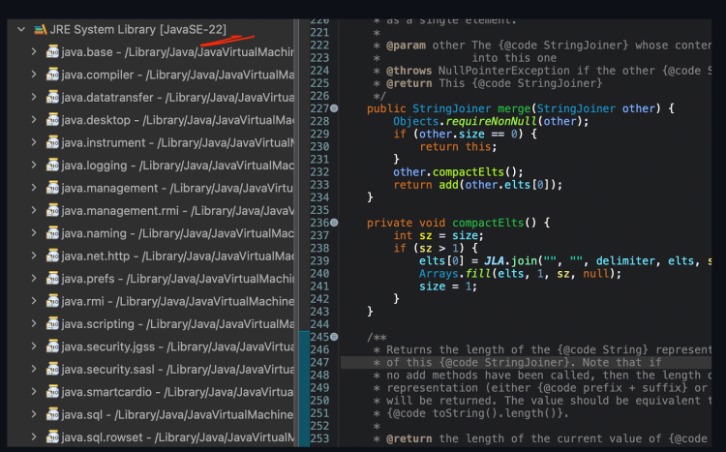
Now, Eclipse understands the version specified in the stack trace and opens exactly the correct class from JDK 22.0.2, no mismatches, no confusion—pure results.
5. Auto-Resuming Trigger Points - “I Only Care About This One Flow, Why Do I Keep Stopping Everywhere Else?”
You want to debug the BookService.formatSummary(Book) method that builds a book's display string. The issue is this method is used in multiple flows like /books/{id}/summary, /books/all, and /books/recommended. You care only about the /recommended flow, but every time you debug, Eclipse hits breakpoints in unrelated code flows. You keep hitting Resume again and again just to reach where you want to stop in the expected flow.
Let Eclipse do the skipping for you…
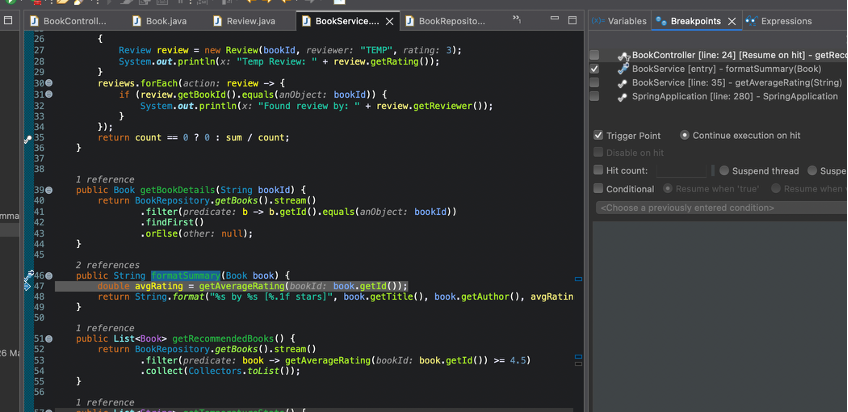
Here's how: Set a trigger point on the method getRecommendedSummaries() in BookController. Enable "Continue execution on hit" in the trigger then place a regular breakpoint or method entry breakpoint inside BookService.formatSummary(Book)
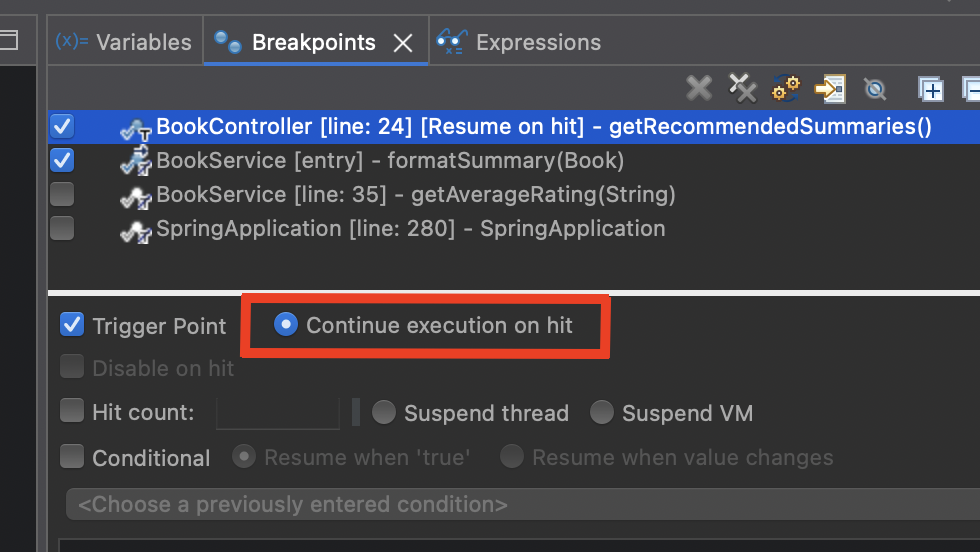
Eclipse will skip the trigger point, fly past all the noise, and pause directly where your focus is, inside BookService.formatSummary(Book). You can even add a resume condition to the resume trigger (only resume when a specific condition is true else pause the execution similar to other breakpoints) for even more control.
6. Primitive Detail Formatter - “I Just Want to See This Value Rounded, but I Don’t Want to Touch the Code”
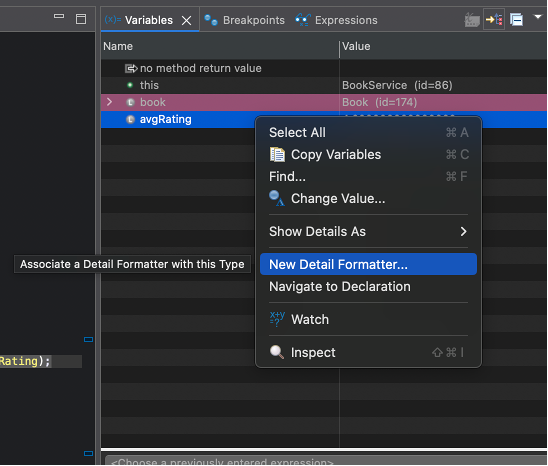
On inspecting avgRating variable which of primitive double type in BookService.formatSummary(Book). Its showing something like 4.538888… but you want to see it rounded to two decimal places, just to understand what the final value would look like when shown to customers. Now with Primitive Detail Formatter support you can define a New Detail Formatter for double type in variables view directly
or from Debug settings!
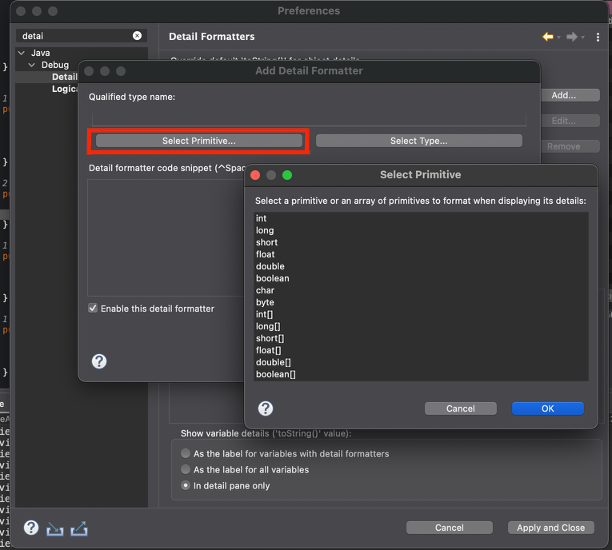
Configure your formatter : Use “this” to represent the primitive
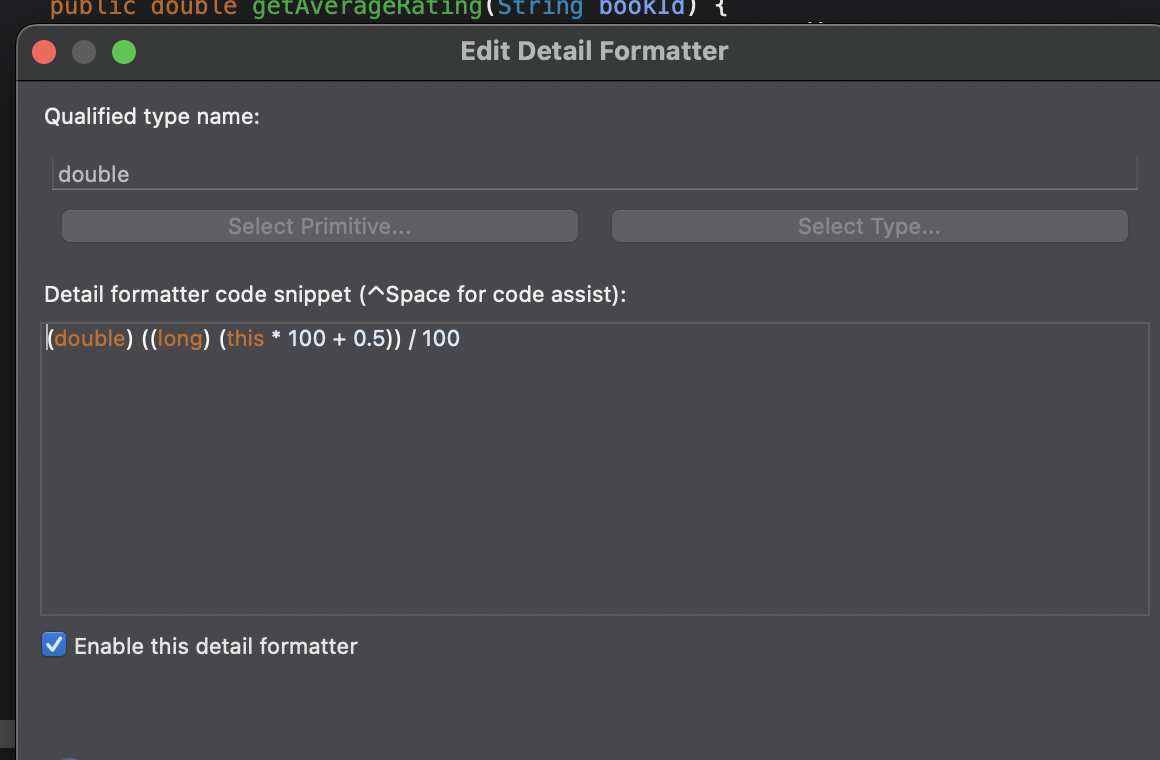
Now, instead of showing the raw value, Eclipse will show you the adjusted value with two decimals...

7. Array Detail Formatter - “There’s an Array. I Only Care About One Value. Let Me See That.”
In our temperature analytics method “BookService.getTemperatureStats()”, we're working with a hardcoded primitive array of temperature readings temps[]. But only the 6th value (index 5) matters. Say it represents the temperature recorded at noon.
Usually, you'd scroll through the array or log specific indexes.
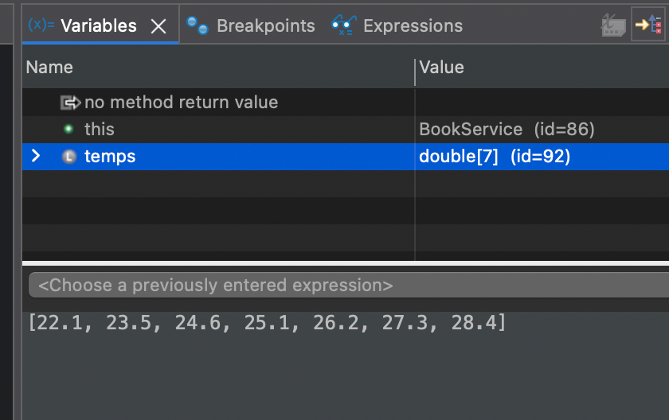
But now, you can simply focus on exactly what you need. Simply add a Detail Formatter for arrays similar to previous one..
Use this[] to represent arrays
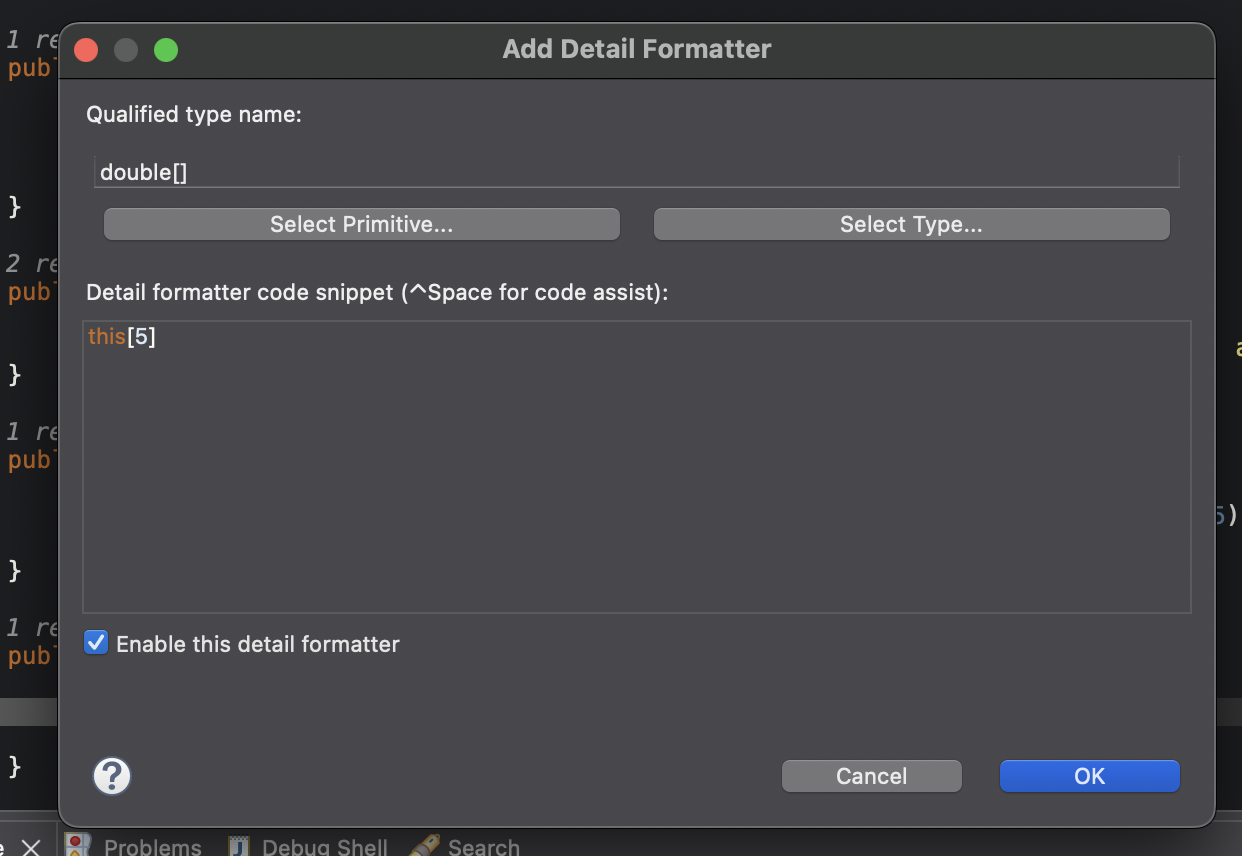
And Voilà..
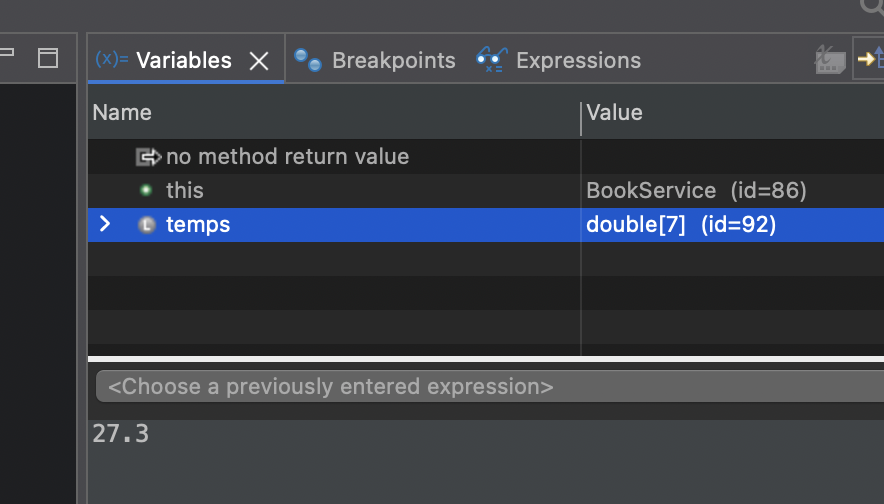
Perfect when you’re dealing with huge datasets but only care about a tiny slice…
8. Compare Elements - “I Wrote Three Different Ways to Generate Tags - But Which One Is Actually Doing a Good Job”?
You’re developing a feature that adds tags to books like "java", "oop", or "bestseller". You’ve written three different methods to generate them, and now you just want to see if their results are consistent, complete, clean, and in the right order.
You could print all the lists and manually check them, but when the lists are long, that gets slow and error-prone.
Instead, you can now use Eclipse’s Compare Elements to instantly spot the differences.
Simply select all three generated lists then Right-click → Compare
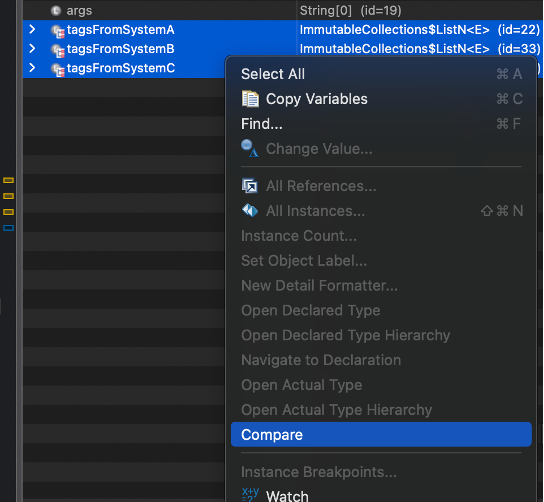
Eclipse tells you what’s missing in each list when compared to the others.
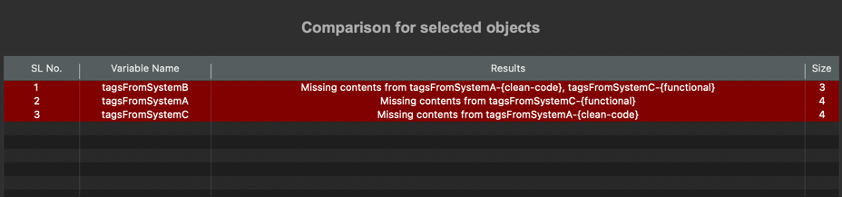
Note : You can compare Lists, Sets, Maps, Strings, and even custom objects - just make sure you're comparing the same type on both sides.
Let’s take another scenario..
“These books look the same, but the system treats them differently - why?”
You recently made Set<Book> allBooks to avoid duplicate book entries being listed but several customers have reported seeing "Clean Code" listed twice. And on debugging the source, you realize that every Book has different reference ids but still having duplicates in final result..
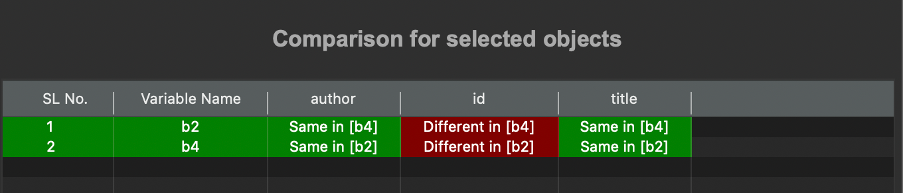
You suspect the issue is because filtering based on reference id’s, but it's hard to tell by glancing the objects, especially if there are many similar books. So for analysing you can Select the suspicious Book objects and then Right-click → Compare

On comparing with Eclipse it is confirmed that object’s contents are same and it’s their reference id are different! – Bug confirmed!
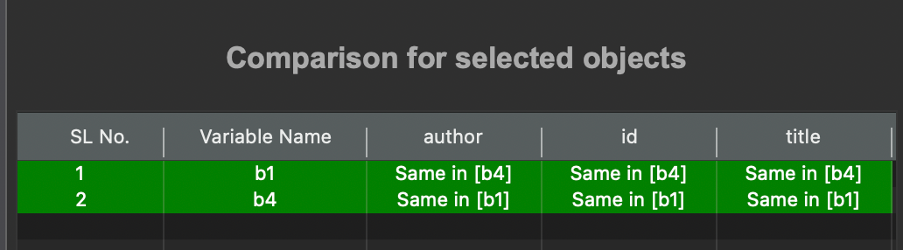
So now you can fix the bug by re-writing the logic to filter based on author and title!
You also noticed that some books have identical title and author but different IDs, which sparks another idea…. maybe sometime in the future, duplicates should be identified based on content...
9. Disable on Hit - “I Only Want This Breakpoint to Hit Once - Not 100 Times.”
You’re debugging a method like getAverageRating() that runs in a loop or across multiple books. You’re only interested in checking the first call, not stepping through all of them.
You used to: Let it hit once then disable the breakpoint manually…
Now Eclipse handles that for you.
Click on a breakpoint and enable Disable on hit option
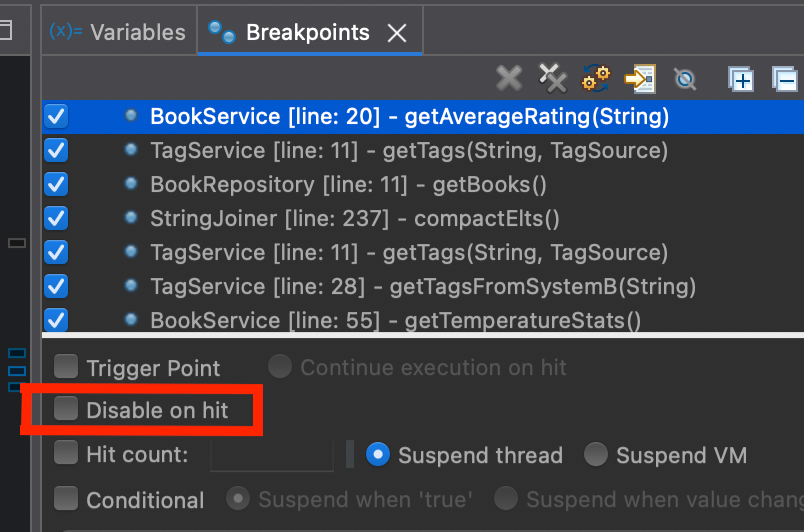
Now on hitting the breakpoint it will automatically disabled.
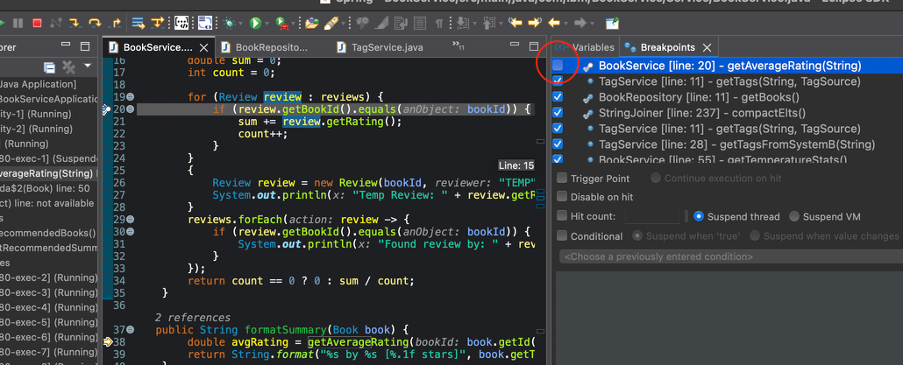
This is super handy for loops, Scheduled jobs & frequently called methods.
10. Labelled Breakpoints - “Wait… What Was This Breakpoint for Again?”
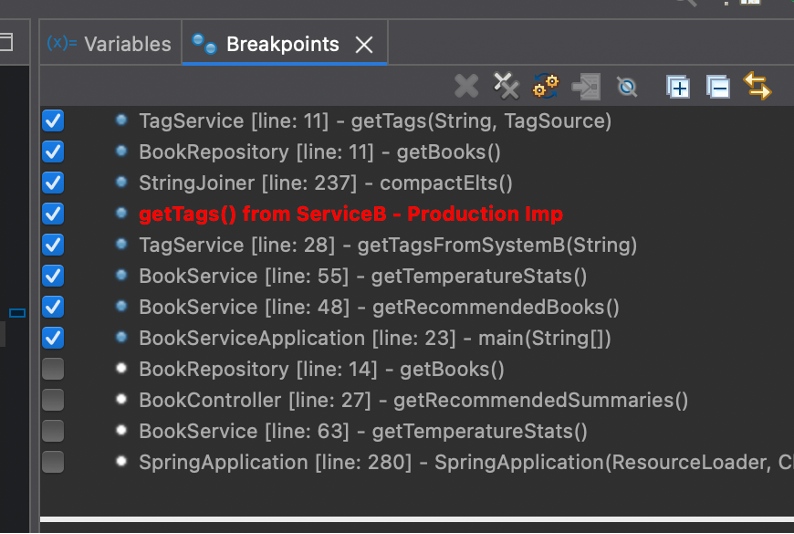
After stepping through different flows, using resume triggers, collapsing stack frames, comparing variables, and disabling breakpoints on hit and modifying formatters of variables you now have 10+ breakpoints scattered across your project. One checks for null titles another one’s for catching duplicates one is testing trigger flow a few were just for one-time validations..
You open your Breakpoints view, and you’re met with this.. :O
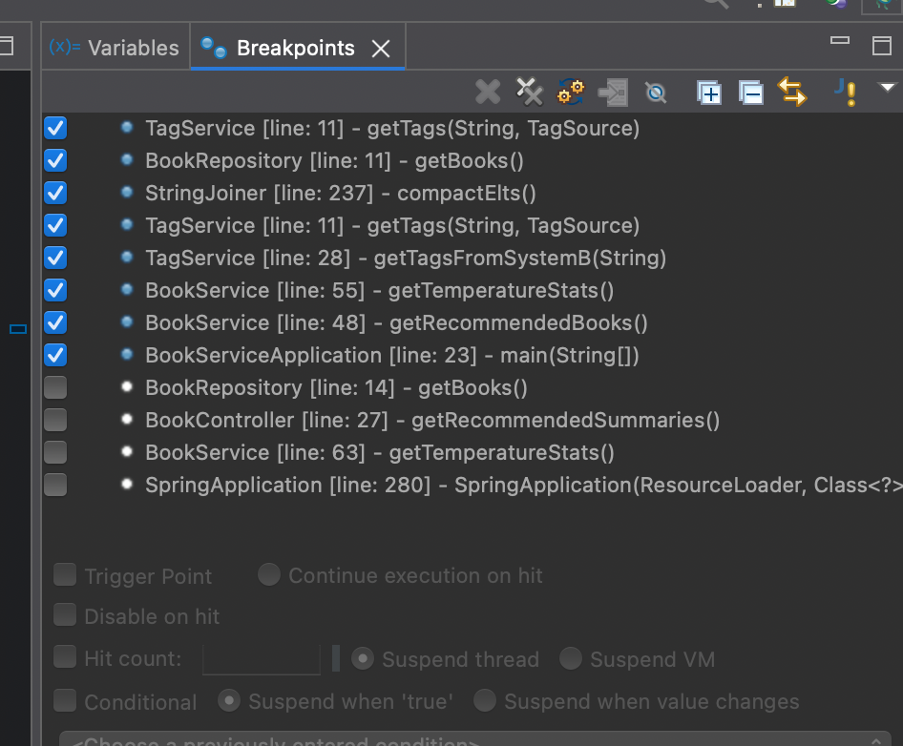
And now you're thinking: “Umm... which one was for verifying the tag issue again?Did I already add a breakpoint for the rating check?”
No need to guess anymore. Eclipse now lets you label your breakpoints with meaningful descriptions. It’s like adding sticky notes directly to your debugging process.
Right click on a breakpoint -> Label
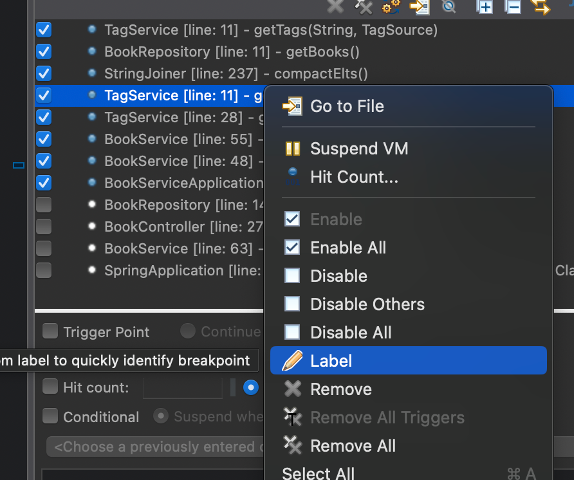
Once clicked provide your custom label :D

Now your breakpoint will be highlighted with your custom label – finally!
Debugging is one of those things we all do - but rarely talk about until it’s painful. And yet, when the right tools quietly guide you to the root cause, it feels effortless. That’s the kind of experience the Eclipse debugger aims to provide—thoughtful improvements that show up right when you need them most... :)
If you run into an issue, spot something unexpected, or have an idea for improving these features (or even a brand new one!), feel free to raise it under here: https://github.com/eclipse-jdt/eclipse.jdt.debug
Thanks for reading and until next time! Happy debugging!
Opinions expressed by DZone contributors are their own.
Comments