End-to-End Tracing With OpenTelemetry
Tracing is one of the pillars of observability. This article focuses solely on traces and describes how you can start your journey into observability.
Join the DZone community and get the full member experience.
Join For FreeWhether you implement microservices or not (and you probably shouldn't), your system is most probably composed of multiple components. The most straightforward system is probably made of a reverse proxy, an app, and a database. In this case, monitoring is not only a good idea, it's a requirement. The higher the number of components through which a request may flow, the strongest the requirement.
However, monitoring is only the beginning of the journey. When requests start to fail en masse, you need an aggregated view across all components. It's called tracing, and it's one of the pillars of observability. The other two are metrics and logs.
In this post, I'll focus solely on traces and describe how you can start your journey into observability.
The W3C Trace Context Specification
A tracing solution should provide a standard format to work across heterogeneous technology stacks. Such a format needs to adhere to a specification, either a formal one or a de facto one.
One needs to understand that a specification rarely appears from nowhere. In general, the market already has a couple of distinct implementations. Most of the time, a new specification leads to an additional implementation, as the famous XKCD comic describes:

Sometimes, however, a miracle happens: the market adheres to the new specification. Here, Trace Context is a W3C specification, and it seems to have done the trick:
"This specification defines standard HTTP headers and a value format to propagate context information that enables distributed tracing scenarios. The specification standardizes how context information is sent and modified between services. Context information uniquely identifies individual requests in a distributed system and also defines a means to add and propagate provider-specific context information."
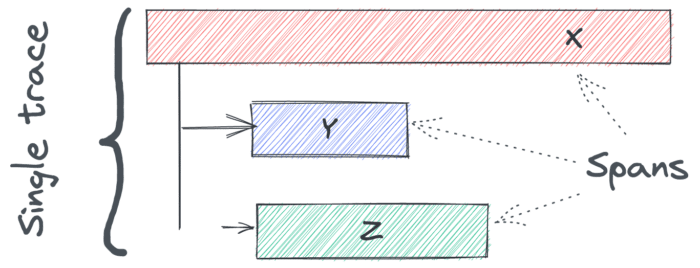
Two critical concepts emerge from the document:
- A trace follows the path of a request that spans multiple components.
- A span is bound to a single component and linked to another span by a child-parent relationship.
At the time of this writing, the specification is a W3C recommendation, which is the final stage.
Trace Context already has many implementations. One of them is OpenTelemetry.
OpenTelemetry as the Golden Standard
The closer you are to the operational part of IT, the highest the chances that you've heard about OpenTelemetry:
"OpenTelemetry is a collection of tools, APIs, and SDKs. Use it to instrument, generate, collect, and export telemetry data (metrics, logs, and traces) to help you analyze your software’s performance and behavior.
OpenTelemetry is generally available across several languages and is suitable for use."
OpenTelemetry is a project managed by the CNCF. Before OpenTelemetry stood two projects:
- OpenTracing, which focused on traces, as its name implies
- OpenCensus, whose goal was to manage metrics and traces
Both projects merged and added logs on top. OpenTelemetry now offers a set of "layers" focusing on observability:
- Instrumentation APIs in a variety of languages
- Canonical implementations, again in different languages
- Infrastructure components, such as collectors
- Interoperability formats, such as the W3C's Trace Context
Note that while OpenTelemetry is a Trace Context implementation, it does more. Trace Context limits itself to HTTP while OpenTelemetry allows spans to cross non-web components, such as Kafka. It's outside the scope of this blog post.
The Use-Case
My favorite use case is an e-commerce shop, so let's not change it. In this case, the shop is designed around microservices, each accessible via a REST API and protected behind an API Gateway. To simplify the architecture for the blog post, I'll use only two microservices: catalog manages products, and pricing handles the price of products.
When a user arrives on the app, the home page fetches all products, gets their respective price, and displays them.
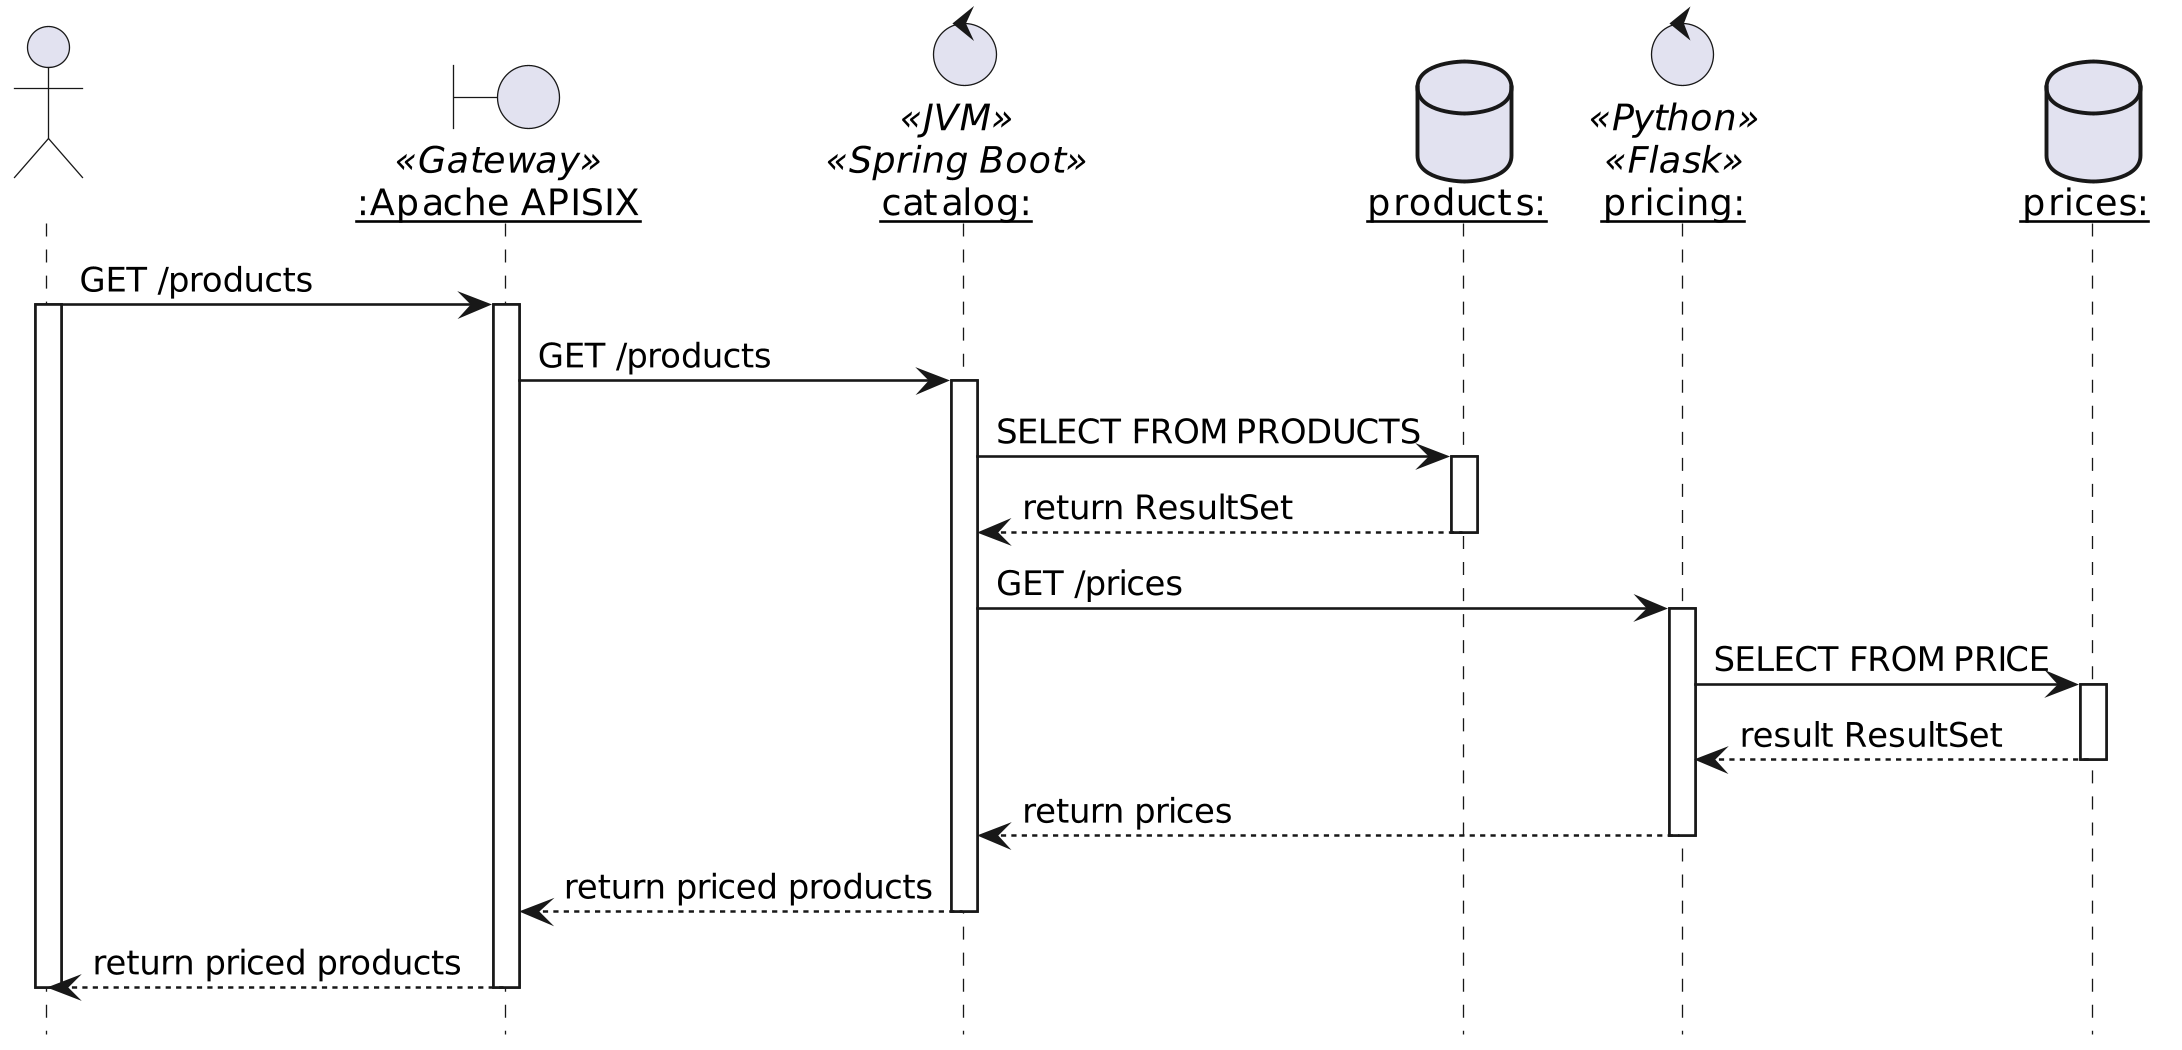
To make things more interesting, catalog is a Spring Boot application coded in Kotlin, while pricing is a Python Flask application.
Tracing should allow us to follow the path of a request across the gateway, both microservices and, if possible, the databases.
Traces at the Gateway
The entry point is the most exciting part of tracing, as it should generate the trace ID. In this case, the entry point is the gateway. I'll use Apache APISIX to implement the demo:
"Apache APISIX provides rich traffic management features like Load Balancing, Dynamic Upstream, Canary Release, Circuit Breaking, Authentication, Observability, etc."
Apache APISIX is based on a plugin architecture and offers an OpenTelemetry plugin:
"The
opentelemetryPlugin can be used to report tracing data according to the OpenTelemetry specification.
The Plugin only supports binary-encoded OLTP over HTTP."
Let's configure the opentelemetry plugin:
apisix:
  enable_admin: false              #1
  config_center: yaml              #1
plugins:
  - opentelemetry                  #2
plugin_attr:
  opentelemetry:
    resource:
      service.name: APISIX         #3
    collector:
      address: jaeger:4318         #4
#1: Run Apache APISIX in standalone mode to make the demo easier to follow. It's a good practice in production anyway.
#2: Configure opentelemetry as a global plugin.
#3: Set the name of the service. It's the name that will appear in the trace display component.
#4: Send the traces to the jaeger service. The following section will describe it.
We want to trace every route, so instead of adding the plugin to each route, we should set up the plugin as a global one:
global_rules:
  - id: 1
    plugins:
      opentelemetry:
        sampler:
          name: always_on          #1
#1: Tracing has an impact on performance. The more we trace, the more we impact. Hence, we should carefully balance the performance impact vs. the benefits of observability. For the demo, however, we want to trace every request.
Collecting, Storing, and Displaying Traces
While Trace Context is a W3C specification and OpenTelemetry is a de facto standard, many solutions exist to collect, store and display traces on the market. Each solution may provide all three capabilities or only part of them. For example, the Elastic stack handles storage and display, but you must rely on something else for collection. On the other hand, Jaeger and Zipkin do provide a complete suite to fulfill all three capabilities.
Jaeger and Zipkin predate OpenTelemetry, so each has its trace transport format. They do provide integration with the OpenTelemetry format, though.
In the scope of this blog post, the exact solution is not relevant, as we only need the capabilities. I chose Jaeger because it provides an all-in-one Docker image: every capability has its component, but they are all embedded in the same image, which makes configuration much more effortless.
The image's relevant ports are the following:
| Port | Protocol | Component | Function |
|---|---|---|---|
16686 |
HTTP | query | serve frontend |
4317 |
HTTP | collector | accept OpenTelemetry Protocol (OTLP) over gRPC, if enabled |
4318 |
HTTP | collector | accept OpenTelemetry Protocol (OTLP) over HTTP, if enabled |
The Docker Compose bit looks like this:
services:
  jaeger:
    image: jaegertracing/all-in-one:1.37           #1
    environment:
      - COLLECTOR_OTLP_ENABLED=true                #2
    ports:
      - "16686:16686"                              #3
#1: Use the all-in-one image.
#2: Very important: enable the collector in OpenTelemetry format.
#3: Expose the UI port.
Now that we have set up the infrastructure, we can focus on enabling traces in our applications.
Traces in Flask Apps
The pricing service is a simple Flask application. It offers a single endpoint to fetch the price of a single product from the database.
@app.route('/price/<product_str>')                           #1-2
def price(product_str: str) -> Dict[str, object]:
    product_id = int(product_str)
    price: Price = Price.query.get(product_id)               #3
    if price is None:
        return jsonify({'error': 'Product not found'}), 404
    else:
        low: float = price.value - price.jitter              #4
        high: float = price.value + price.jitter             #4
        return {
            'product_id': product_id,
            'price': round(uniform(low, high), 2)            #4
        }
#1: Endpoint
#2: The route requires the product's id.
#3: Fetch data from the database using SQLAlchemy.
#4: Real pricing engines never return the same price over time. Let's randomize the price a bit for fun.
Warning: Fetching a single price per call is highly inefficient. It requires as many calls as products, but it makes for a more exciting trace. In real life, the route should be able to accept multiple product ids and fetch all associated prices in one request-response.
Now is the time to instrument the application. Two options are available: automatic instrumentation and manual instrumentation. Automatic is low effort and a quick win; manual requires focused development time. I'd advise starting with automatic and only adding manual if required.
We need to add a couple of Python packages:
opentelemetry-distro[otlp]==0.33b0
opentelemetry-instrumentation
opentelemetry-instrumentation-flask
We need to configure a couple of parameters:
pricing:
  build: ./pricing
  environment:
    OTEL_EXPORTER_OTLP_ENDPOINT: http://jaeger:4317     #1
    OTEL_RESOURCE_ATTRIBUTES: service.name=pricing      #2
    OTEL_METRICS_EXPORTER: none                         #3
    OTEL_LOGS_EXPORTER: none                            #3
#1: Send the traces to Jaeger.
#2: Set the name of the service. It's the name that will appear in the trace display component.
#3: We are interested neither in logs nor in metrics.
Now, instead of using the standard flask run command, we wrap it:
opentelemetry-instrument flask runJust with this, we already collect spans from method calls and Flask routes.
We can manually add additional spans if needed, e.g.:
from opentelemetry import trace
@app.route('/price/<product_str>')
def price(product_str: str) -> Dict[str, object]:
product_id = int(product_str)
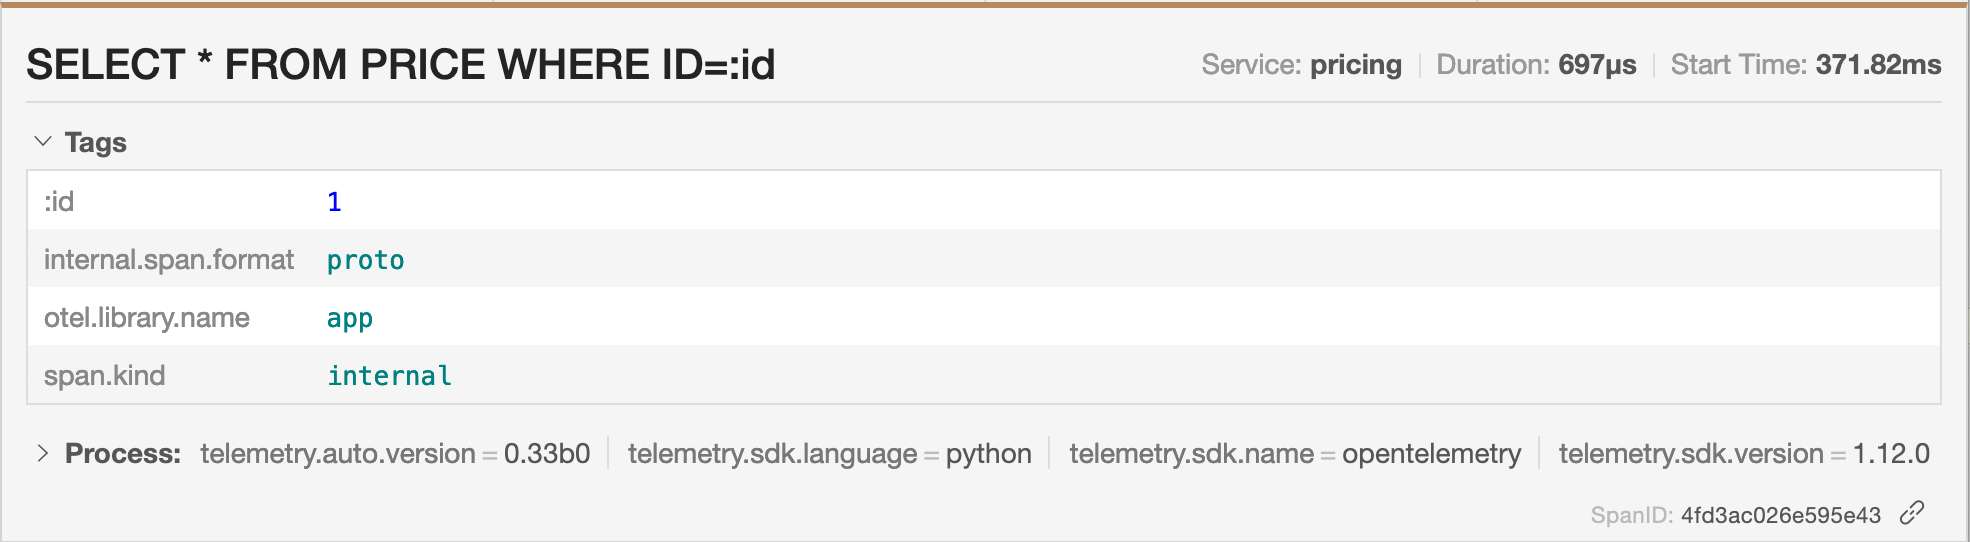
with tracer.start_as_current_span("SELECT * FROM PRICE WHERE ID=:id", attributes={":id": product_id}) as span: #1
price: Price = Price.query.get(product_id)
# ...#1: Add an additional span with the configured label and attribute.
Traces in Spring Boot Apps
The catalog service is a Reactive Spring Boot application developed in Kotlin. It offers two endpoints:
- One to fetch a single product
- The other is to fetch all products.
Both first look in the product database, then query the above pricing service for the price.
As for Python, we can leverage automatic and manual instrumentation. Let's start with the low-hanging fruit, automatic instrumentation. On the JVM, we achieve it through an agent:
java -javaagent:opentelemetry-javaagent.jar -jar catalog.jarAs in Python, it creates spans for every method call and HTTP entry point. It also instruments JDBC calls, but we have a Reactive stack and thus use R2DBC. For the record, a GitHub issue is open for adding support.
We need to configure the default behavior:
catalog:
  build: ./catalog
  environment:
    APP_PRICING_ENDPOINT: http://pricing:5000/price
    OTEL_EXPORTER_OTLP_ENDPOINT: http://jaeger:4317     #1
    OTEL_RESOURCE_ATTRIBUTES: service.name=orders       #2
    OTEL_METRICS_EXPORTER: none                         #3
    OTEL_LOGS_EXPORTER: none                            #3
#1: Send the traces to Jaeger.
#2: Set the name of the service. It's the name that will appear in the trace display component.
#3: We are interested neither in logs nor in metrics.
As for Python, we can up the game by adding manual instrumentation. Two options are available: programmatic and annotation-based. The former is a bit involved unless we introduce Spring Cloud Sleuth. Let's add annotations.
We need an additional dependency:
<dependency>
    <groupId>io.opentelemetry.instrumentation</groupId>
    <artifactId>opentelemetry-instrumentation-annotations</artifactId>
    <version>1.17.0-alpha</version>
</dependency>
Be careful: the artifact was very recently relocated from io.opentelemetry:opentelemetry-extension-annotations.
We can now annotate our code:
@WithSpan("ProductHandler.fetch")                                               //1
suspend fun fetch(@SpanAttribute("id") id: Long): Result<Product> {             //2
    val product = repository.findById(id)
    return if (product == null) Result.failure(IllegalArgumentException("Product $id not found"))
    else Result.success(product)
}
#1: Add an additional span with the configured label.
#2: Use the parameter as an attribute, with the key set to id and the value the parameter's runtime value.
The Result!
We can now play with our simple demo to see the result:
curl localhost:9080/products
curl localhost:9080/products/1
The responses are not interesting, but let's look at the Jaeger UI. We find both traces, one per call:
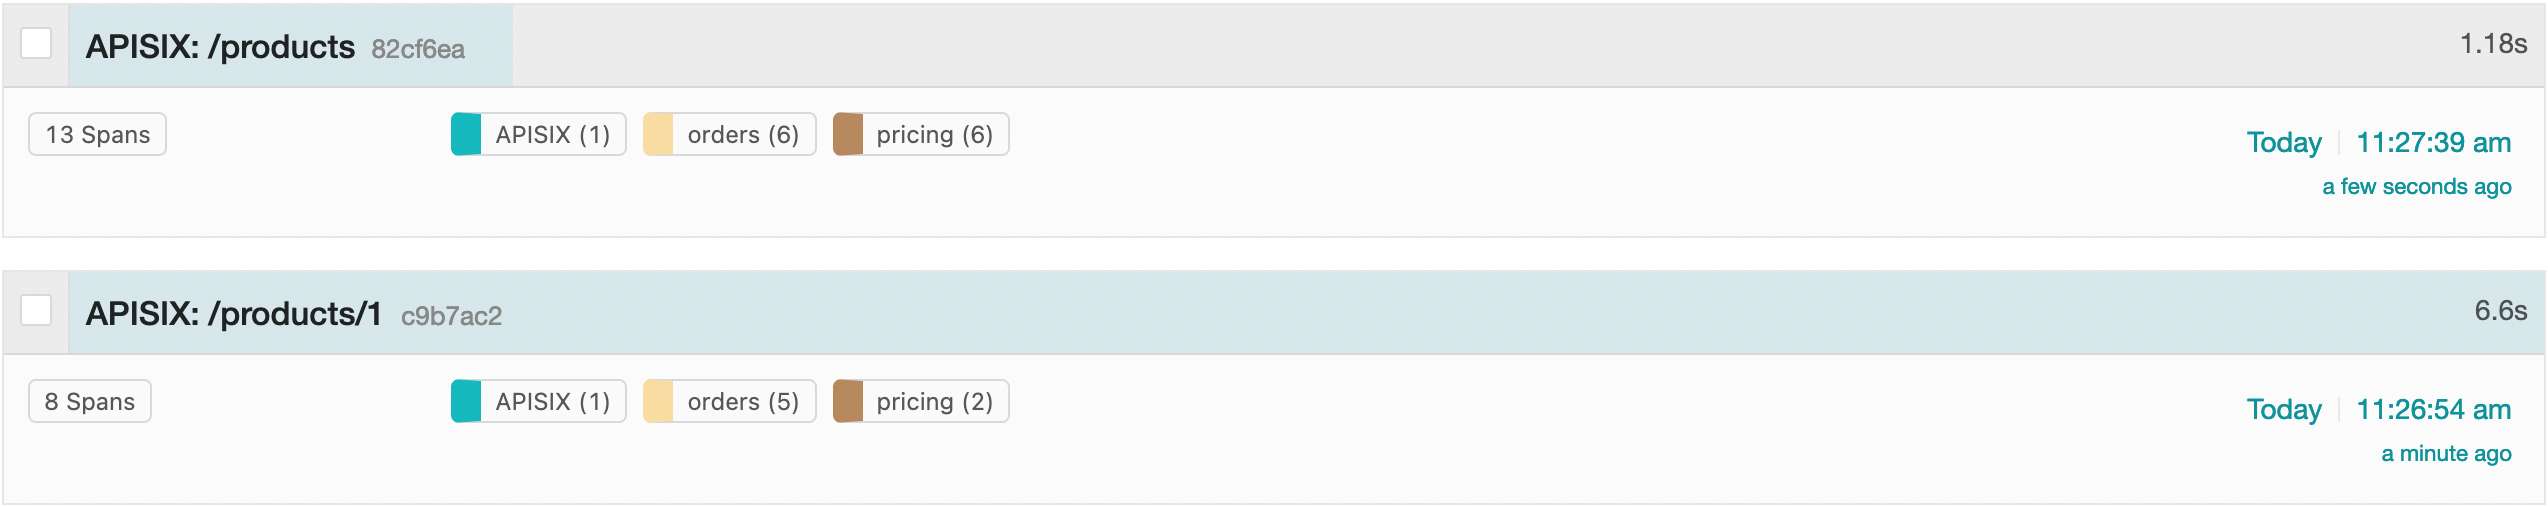
We can dive into the spans of a single trace:
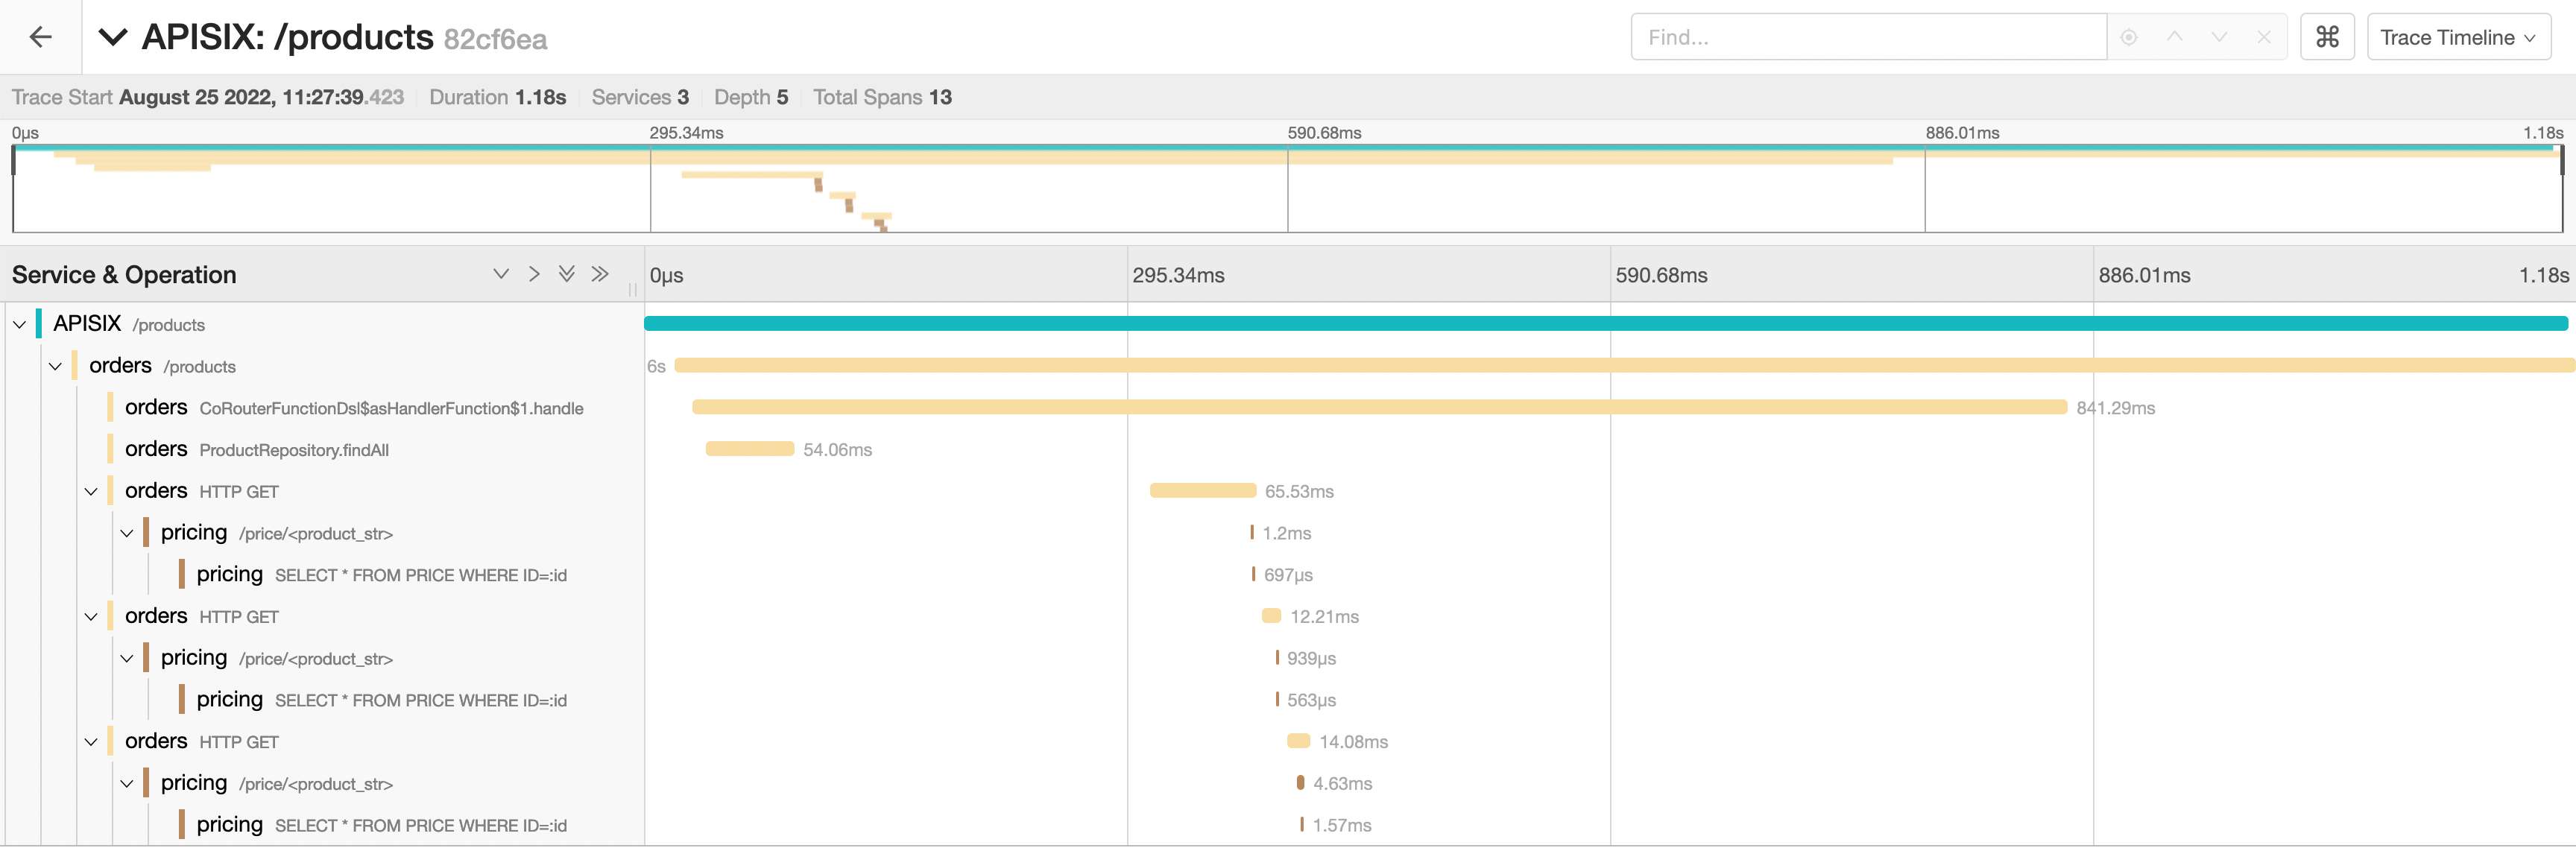
Note that we can infer the sequence flow without the above UML diagram. Even better, the sequence displays the calls internal to a component.
Each span contains attributes that the automatic instrumentation added and the ones we added manually:
Conclusion
In this post, I've showcased tracing by following a request across an API gateway, two apps based on different tech stacks, and their respective databases. I've brushed only the surface of tracing: in the real world, tracing would probably involve components unrelated to HTTP, such as Kafka and message queues.
Still, most systems rely on HTTP in one way or another. While not trivial to set up, it's not too hard either. Tracing HTTP requests across components is a good start in your journey toward observability of your system.
The complete source code for this post can be found on GitHub.
To go further:
Published at DZone with permission of Nicolas Fränkel. See the original article here.
Opinions expressed by DZone contributors are their own.
Comments