Enduring Black Fridays With MuleSoft APIs
It's not too early to start getting ready for Back Friday. Read up on endurance testing for your APIs to ensure good performance on the big shopping day.
Join the DZone community and get the full member experience.
Join For FreeIf you are a stakeholder at an eCommerce shop, the fear of lights-out on a Black Friday might be reason enough to be losing sleep. And with the holiday season drawing close, one common apprehension that technology stakeholders bear at the back of their mind is whether their systems will be able to withstand the unknown bulk load over a stretched period of time – the critical focus being on the APIs, since APIs are expected to be the magic glue that keeps the business going being the all performant layer in the mix, responsible for maintaining the transactionality across, making sure that none of the transaction gets dropped.
While reliability is an important topic and very much addressed by the Reliability pattern, the endurance of the APIs is yet another thing that ought to be tested up-front. As they say, "Fix the roof while the sun is shining," and likewise, it will be wise to start planning your endurance test cycles ahead of time.
Endurance Testing of APIs
Typically, it will be a good idea to make sure that APIs are performing well with a decent load over a continued period of time. Endurance testing of the APIs over a duration of 12-24 hours with load ranging definitely above the average load (if not peak load!) should be good enough to surface any memory leaks that might ruin the peak business hour if left undiscovered.
Now that we understand the criticality of carrying out endurance testing, we'll zero in on Mule-specific implementation and discuss some of the sources of memory leaks that were observed. Note that Mule packages in itself seem to be battle tested pretty well and do not show any signs of memory leaks. But it is mostly how the other open source frameworks and packages are configured that may have a bearing on memory being held by certain threads unnecessarily.
Checking for Symptoms of Memory Leaks
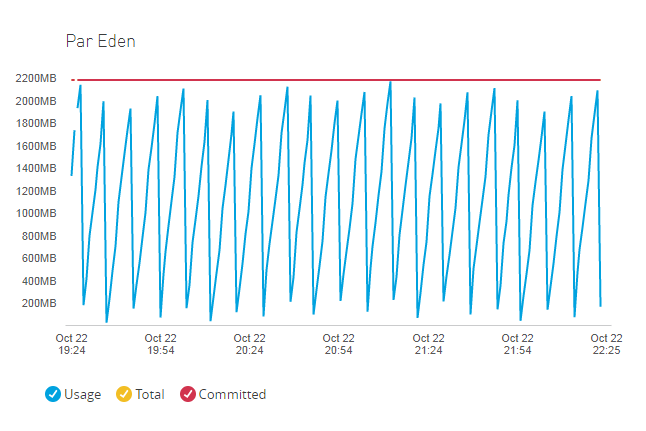
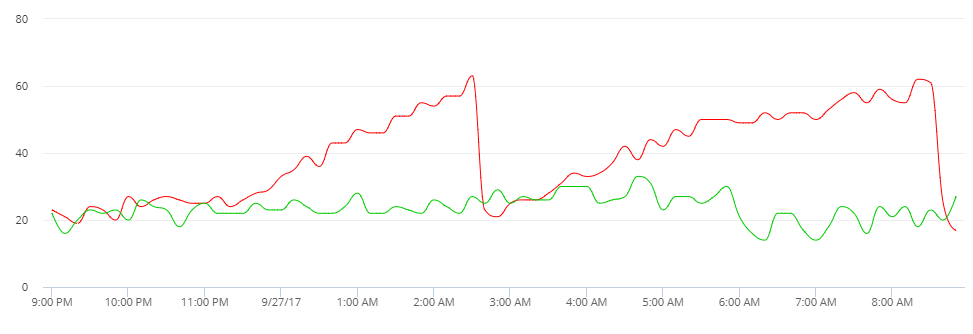
During the course of an endurance test, you would typically witness minor GC happening pretty regularly – more like a saw-tooth pattern, which is a good sign that Eden space is sufficient and is being cleared up regularly.
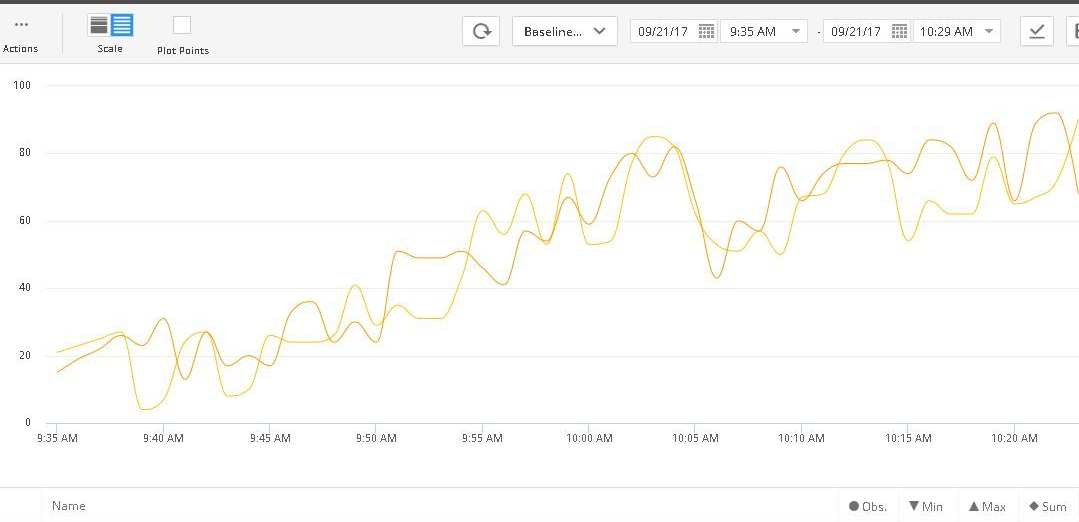
Major GC, however, may not happen as frequently. And a sure sign of a memory leak would be when you see that after repeated major GC, the memory is not being reclaimed at the same rate and is declining. It is very much reminiscent of the Law of Diminishing Returns (borrowing from economics theory) wherein despite multiple closely spaced major GC cycles, the Old Gen is not released fully and keeps on climbing towards max capacity. The GC graph on your diagnostics dashboard would definitely not be a saw-tooth and will display an incline in overall heap utilization.
A good way to get to the memory leak suspects would be to take a heap dump (of all the nodes) right after you start seeing a decline in memory reclaim post-major GC. There are multiple tools available that help analyze the memory leaks. For our case study in reference, IBM Heap Analyzer was the tool used.
Some Instances of Memory Leak
Moving on, I would like to share some of the findings that were observed in recent implementations. Note that this may or may not be the case with your implementation, depending upon the version of Mule and supporting packages or custom code that you might be using.
Grizzly Implementation
Symptom: Looking at the heap dump taken post-identification of a memory leak (Old Gen not getting cleared up), the biggest contributor to the leak in the Java heap (roughly ~1.4GB of 5+GB) that surfaced was the Grizzly Memory Manager item on NIO transport. The rest of the other memory leak suspect items seem to be a subset of this.
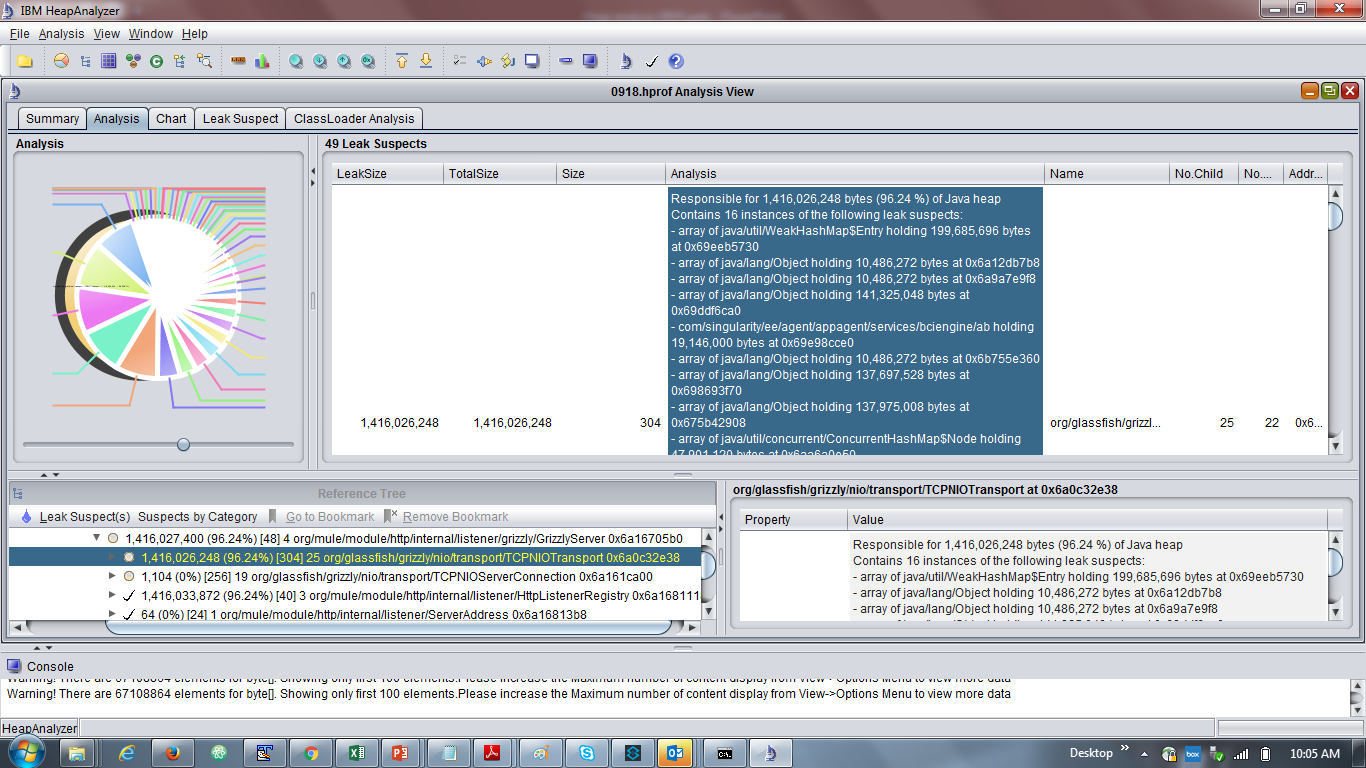
Finding: Pooled memory manager generally grabs 10% of JVM heap and lives with it without releasing. In this case, the memory reservation was observed to be much higher.
Fix: Switch the Grizzly Memory Manager implementation HeapMemoryManager. Note that HeapMemoryManager is the default implementation and is recommended by Grizzly for performance; albeit, Mule treats PoolMemoryManager implementation as the default.
Wrapper.conf changes:
wrapper.java.additional.<XX>=-Dorg.glassfish.grizzly.DEFAULT_MEMORY_MANAGER=org.glassfish.grizzly.memory.HeapMemoryManagerLog4J Configuration
Symptom: Log4J appeared as the source of major a memory leak based on heap analysis.
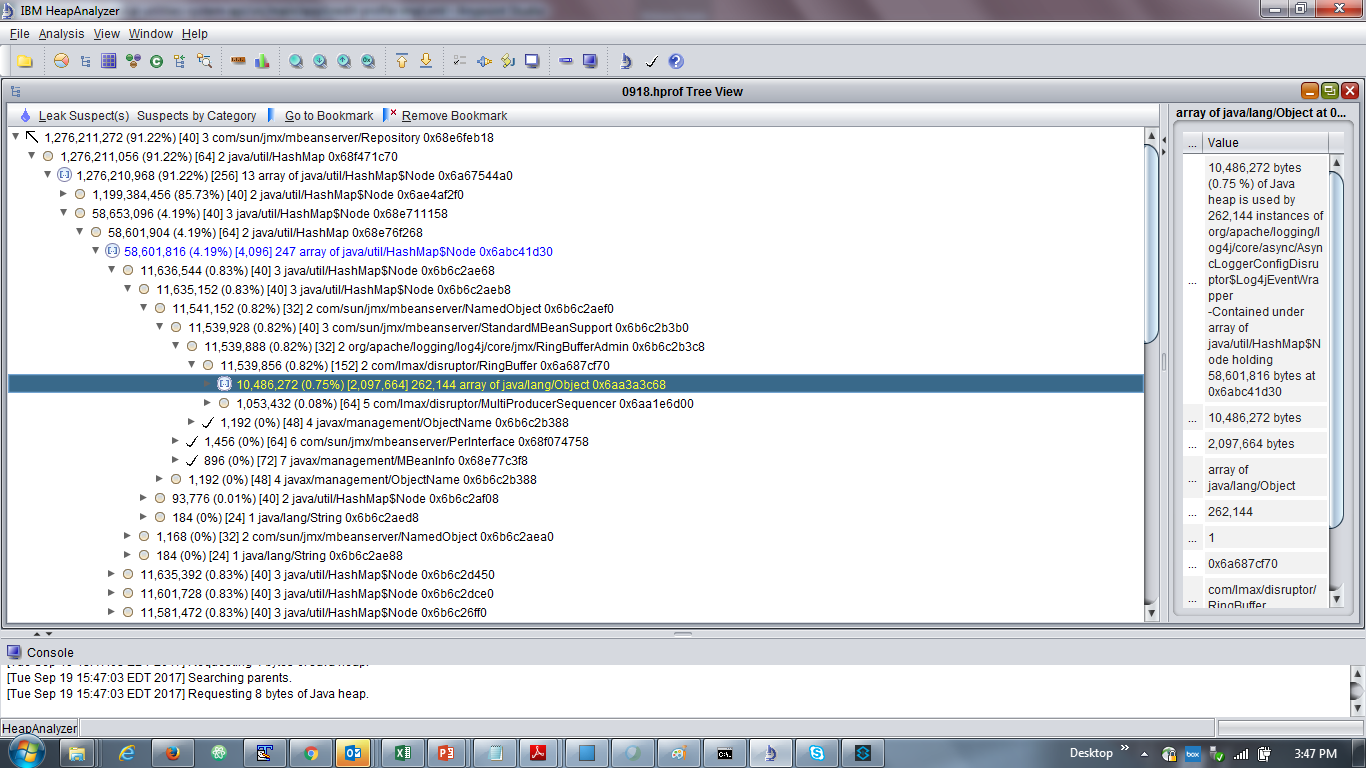
Finding: Async logging was being used widely and associated Log4J RingBuffer was observed to be holding a lot of JVM memory. The default setting of 256*1024 slots was apparently too high. Since this RingBuffer does not grow or shrink, a high fixed size with each slot allocated as a separate object (RingBufferLogEvent), each holding a log event, could occupy a considerable amount of memory.
Fix: Reduce the Log4J RingBuffer size to 128 in wrapper.conf or log4j2.xml
wrapper.java.additional.<XX>=-DAsyncLoggerConfig.RingBufferSize=128 Or, in log4j2.xml:
<AsyncLogger name="DebugLog" level="info" includeLocation="true" ringBufferSize="128">References: https://issues.apache.org/jira/browse/LOG4J2-1340
Specific One-Off Issues
Context: Memory leak due to default HazelCast implementation used for aggregator components (splitter-Aggregator pattern).
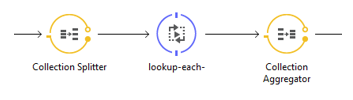
Symptom: Memory leak identified during endurance tests – Old Gen not getting released fully.
Finding: Heap analysis pointed memory being held up by default HazelCast objectstore implementation used in splitter-aggregator components used in specific flows. It appeared as if the store was not getting expired appropriately.
Fix: Custom Object store implementation (subclass of PartitionedInMemoryObjectStore) was written and TTL (TimeToLive) for entries explicitly defined.
@Override
public void expire(int entryTTL, int maxEntries, String partitionName) throws ObjectStoreException
{
    super.expire(entryTTL, maxEntries, partitionName);
    if (getPrivatePartitionSize(partitionName) == 0) {
disposePartition(partitionName);
    }
}
Conclusion
As we understand, not all APIs are built the same, and consist of different building blocks and supporting libraries, so it is not easy to predict the sources of memory leaks and not correct to typecast any particular component to be the source of evil. Also, just because Mule in itself is supported by so many multiple libraries, at times it may be the case that a combination of multiple things is contributing to a leak here and there.
And that's where, with all the right planning and right tools in place, it is possible to weed out any such issues in advance, and spend some time yourself in finding the best deals on Black Friday (not that we need to wait for actual Black Friday these days!).
Lastly, this is how the happy face of an endurance test graph looks - a smiley with a sawtooth pattern on your major GC graph!
Opinions expressed by DZone contributors are their own.
Comments