Troubleshooting Memory Leaks With Heap Profilers
Learn how to use common heap profilers and how profilers such as Go heap profiler, gperftools, jemalloc, and Bytehound are designed and implemented.
Join the DZone community and get the full member experience.
Join For FreeAfter a system runs for a long time, the available memory may decrease, and some services may fail. This is a typical memory leak issue that is usually difficult to predict and identify. Heap profilers are useful tools to solve such problems. They keep track of memory allocations and help you figure out what is in the program heap and locate memory leaks.
This article introduces how to use heap profilers, and how widely-used heap profilers, such as Go heap profiler, gperftools, jemalloc and Bytehound, are designed and implemented. I hope this article can help you better understand and use heap profilers for your own projects.
Before going into the details of each heap profiler, I’ll show you their performance and metric accuracy in the table below, so you can decide if you need to read the entire article.
| Profilers | Performance overhead | Quality of metrics |
| Go | Low | Medium |
| TCMalloc (gperftools) | Low | Medium |
| jemalloc | Low | Medium |
| Bytehound | High | High |
These tools share similar technical designs. I will cover them in the Go Heap Profiler section, and I strongly recommend that you read that section first before skipping to others.
What Is Heap Profiling?
Heap profiling means to collect or sample an application’s heap allocation to help users determine what is in the program heap. It can be used to locate memory leaks, analyze allocation patterns, or discover the places that allocate a lot of memory.
How Heap Profiling Works
Before we go into detail about heap profiling, let’s see how CPU profiling works, which is simpler and can be helpful for you to understand how heap profiling works.
When we profile CPU usage, we need to select a certain time window. In this window, the CPU profiler registers a hook that is executed at regular intervals with the target program. There are many methods, such as the SIGPROF signal. This hook obtains the stack trace of the business thread in real time.
Then, we specify how often the hook is executed. For example, if we set the frequency as 100 Hz, it means that the application code’s call stack sample is collected every 10 ms. When the time window ends, we aggregate the collected samples and get the number of times each function has been collected. We compare these numbers with the total number of samples to determine each function’s relative proportion of CPU usage.
We can use this model to find the functions with high CPU consumption and then identify CPU hot spots.
CPU profiling and heap profiling have similar data structures. Both use the stack trace + statistics model. If you use pprof provided by Go, you’ll find that their display formats are almost the same:

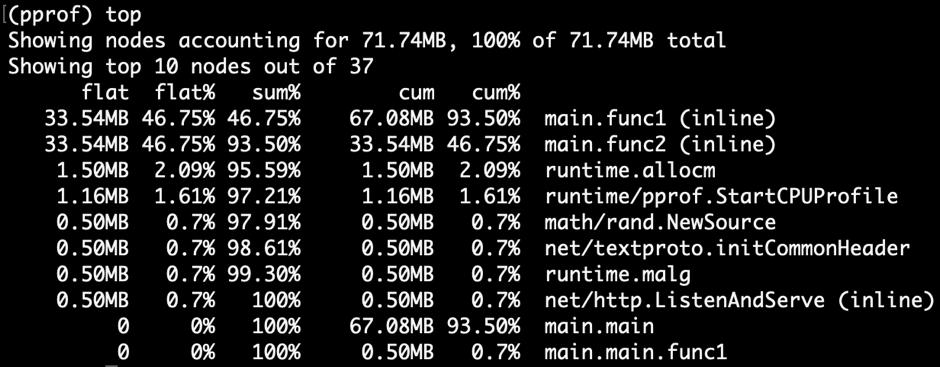
However, in contrast to CPU profiling, heap profiling does more than periodically collect data using a timer. It inserts statistical code into the memory allocator. In general, a heap profiler is directly integrated into the memory allocator. When the application allocates memory, it gets the current stack trace and finally aggregates the samples. Then, we can know each function’s direct or indirect memory allocation.
The heap profiling stack trace + statistics data model is consistent with the CPU profiling model.
Next, I’ll describe how several heap profilers are implemented and used. For completeness, I will explain each heap profiler. If you’re already familiar with this kind of information, you can skip it.
Go Heap Profiler
At PingCAP engineers use Golang as their primary programming language, so in this article, I will go deep into the Go heap profiler and its design and implementation. Other heap profilers will also be introduced. But, since most heap profilers have the same design, they will not be explained in detail.
Go Heap Profiler Usage
Go runtime has a built-in profiler, and heap is one of the types. We can open a debug port as follows:
import _ "net/http/pprof"

go func() {
   log.Print(http.ListenAndServe("0.0.0.0:9999", nil))
}()
While the program runs, we can use the following command line to get the current heap profiling snapshot:
$ go tool pprof http://127.0.0.1:9999/debug/pprof/heapWe can also directly get a heap profiling snapshot at a specific place in the application code:
package main

import (
 "log"
 "net/http"
 _ "net/http/pprof"
 "time"
)

func main() {
 go func() {
  log.Fatal(http.ListenAndServe(":9999", nil))
 }()

 var data [][]byte
 for {
  data = func1(data)
  time.Sleep(1 * time.Second)
 }
}

func func1(data [][]byte) [][]byte {
 data = func2(data)
 return append(data, make([]byte, 1024*1024)) // alloc 1mb
}

func func2(data [][]byte) [][]byte {
 return append(data, make([]byte, 1024*1024)) // alloc 1mb
The code continuously allocates memory in func1 and func2. It allocates 2 MB of heap memory per second.
After the program runs for a period of time, we can execute the following command to get the profile snapshot and start a web service to browse:
$ go tool pprof -http=":9998" localhost:9999/debug/pprof/heap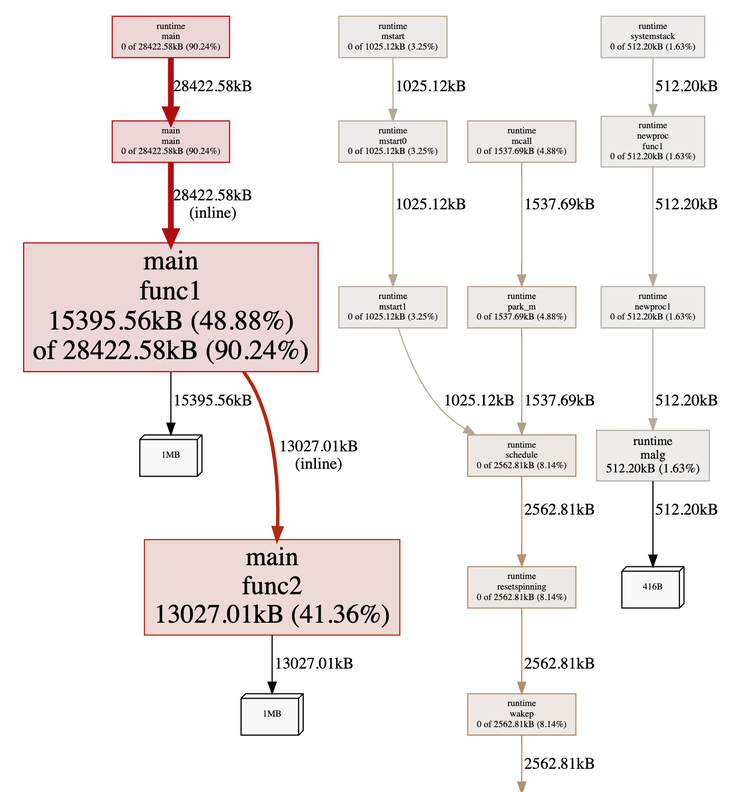
This graph tells us two important things. The bigger the box, the bigger the memory allocation. We also see the connections among function calls. In this example, it’s obvious that func1 and func2 have the largest memory allocation, and func1 calls func2.
Note that since heap profiling is also sampled (by default, the call stack is sampled every time the memory allocator allocates 512 KB of memory), the memory size shown here is smaller than the memory size allocated. Like CPU profiling, this value only calculates the relative proportions and then finds the memory allocation hot spots.
Note: Although Go runtime has logic to estimate the original size of the sampled results, this conclusion is not necessarily accurate.
In this graph, 48.88% of 90.24% in func1’s box means flat% of cum%.
Let’s change the browsing method by selecting Top from the menu in the upper left corner. We’ll see:
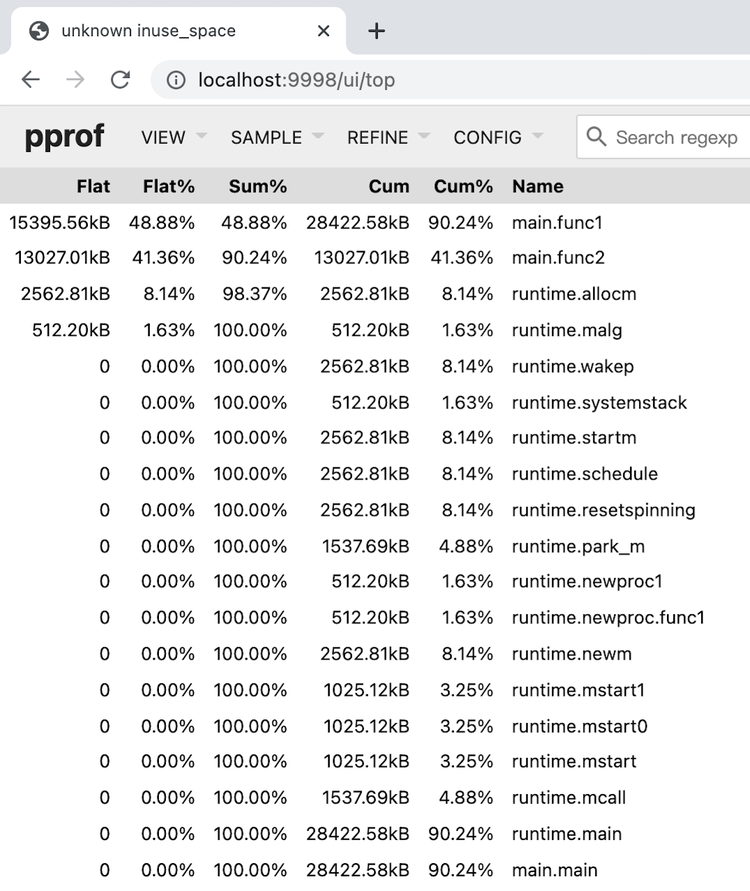
The fields shown are:
| Column | Definition |
| Flat | The memory allocated for the function |
| Flat% | The proportion of Flat to the total allocation size |
| Sum% | The accumulation of Flat% from top to bottom; you can know how much memory is allocated from this row to the top |
| Cum | The memory allocated for the function and the subfunctions that it calls |
| Cum% | The proportion of Cum to the total allocation size |
| Name | Identifies the function |
By observing box size in the Go heap graph or checking the Go heap top list, we can find a specific function. Go provides more fine-grained, code-line-level allocation source statistics. In the upper left corner, click VIEW and in the menu click Source. We’ll see:
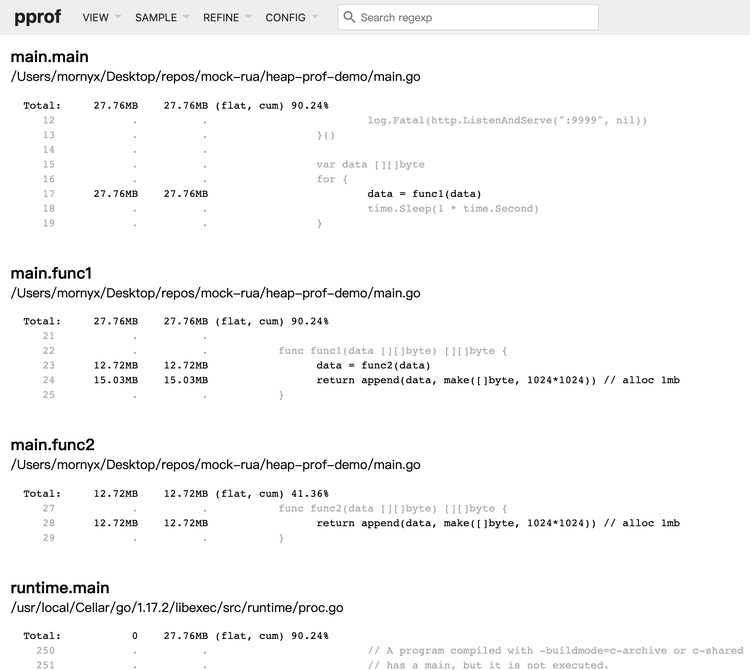
In CPU profiling, we often find the wide top in a flame graph to quickly identify the hotspot function. Of course, due to the homogeneity of the data model, we can also use the flame graph to display heap profiling data. In the upper left corner, click VIEW and in the menu click Flame Graph:

Through the above methods, we can see that func1 and func2 have the highest memory allocation. However, in real-world cases, we can’t find the root cause so easily. Because we get a snapshot of a certain moment, this is not enough to identify the memory leak problem. We need incremental data to judge which function has continually increasing memory. Therefore, we can get the heap profile again after a period of time and observe the differences between the two results.
Go Heap Profiler Implementation
Previously, I mentioned that, generally, a heap profiler is integrated into the memory allocator. When the application allocates memory, the heap profiler gets the current stack trace. So does Go.
Go’s memory allocation entry is the mallocgc() function in src/runtime/malloc.go. The mallocgc() function allocates a section of memory. Here is an important piece of its code:
func mallocgc(size uintptr, typ *_type, needzero bool) unsafe.Pointer {
 // ...
 if rate := MemProfileRate; rate > 0 {
  // Note cache c only valid while m acquired; see #47302
  if rate != 1 && size < c.nextSample {
   c.nextSample -= size
  } else {
   profilealloc(mp, x, size)
  }
 }
 // ...
}

func profilealloc(mp *m, x unsafe.Pointer, size uintptr) {
 c := getMCache()
 if c == nil {
  throw("profilealloc called without a P or outside bootstrapping")
 }
 c.nextSample = nextSample()
 mProf_Malloc(x, size)
}
The code indicates that every time mallocgc() allocates 512 KB of heap memory, it calls profilealloc() to record a stack trace.
It seems useful to get all functions’ accurate memory allocation, but the performance overhead is huge. As a user-mode library function, malloc() is frequently called by applications. If each malloc() call causes a stack traceback, the overhead is almost unacceptable, especially in scenarios where profiling on the server side continues for a long time. Choosing sampling is not a better result, but just a compromise.
Of course, we can also modify the MemProfileRate variable. If we set it to 1, each time mallocgc() is called, it records a stack trace; if we set it to 0, heap profiling is turned off. You can weigh performance and accuracy based on your actual scenarios.
Note that when we set MemProfileRate to a normal sampling granularity, this value is not completely accurate. Instead, it’s randomly selected from the exponential distribution with MemProfileRate as the average value.
// nextSample returns the next sampling point for heap profiling. The goal is
// to sample allocations on average every MemProfileRate bytes, but with a
// completely random distribution over the allocation timeline; this
// corresponds to a Poisson process with parameter MemProfileRate. In Poisson
// processes, the distance between two samples follows the exponential
// distribution (exp(MemProfileRate)), so the best return value is a random
// number taken from an exponential distribution whose mean is MemProfileRate.
func nextSample() uintptr
In many cases, memory allocation is regular. If sampling is performed at a fixed granularity, the final result may have a big error. It may happen that a particular type of memory allocation exists at each sampling. This is why randomization is chosen here.
Not only does heap profiling have errors, but various sampling-based profilers always have errors (for example, SafePoint Bias). When we review sampling-based profiling results, we must consider the possibility of errors.
The mProf_Malloc() function in src/runtime/mprof.go is responsible for sampling:
// Called by malloc to record a profiled block.
func mProf_Malloc(p unsafe.Pointer, size uintptr) {
 var stk [maxStack]uintptr
 nstk := callers(4, stk[:])
 lock(&proflock)
 b := stkbucket(memProfile, size, stk[:nstk], true)
 c := mProf.cycle
 mp := b.mp()
 mpc := &mp.future[(c+2)%uint32(len(mp.future))]
 mpc.allocs++
 mpc.alloc_bytes += size
 unlock(&proflock)

 // Setprofilebucket locks a bunch of other mutexes, so we call it outside of proflock.
 // This reduces potential contention and chances of deadlocks.
 // Since the object must be alive during call to mProf_Malloc,
 // it's fine to do this non-atomically.
 systemstack(func() {
  setprofilebucket(p, b)
 })
}

func callers(skip int, pcbuf []uintptr) int {
 sp := getcallersp()
 pc := getcallerpc()
 gp := getg()
 var n int
 systemstack(func() {
  n = gentraceback(pc, sp, 0, gp, skip, &pcbuf[0], len(pcbuf), nil, nil, 0)
 })
 return n
}
Stack backtracking is when the profiler calls callers() and gentraceback(), obtains the current call stack, and stores it in the stk array. This array stores program counter addresses. Many scenarios use this technology. For example, when a program panics, the stack is expanded.
In the code block above:
| Variable | Purpose | x86-64 register |
pc |
Program counter | RIP |
fp |
Frame pointer | RBP |
sp |
Stack pointer | RSP |
There is an old call stack traceback implementation method: the RBP register on the x86-64 platform must store the stack base address when a function call occurs for the calling convention, and the RBP register is not used as a general-purpose register. The call instruction first pushes the RIP (return address) to the stack. Therefore, we only need to make sure that the first row of data pushed to the stack is the current RBP. Then, all functions’ stack base addresses start with RBP and form an address linked list. To get the RIP array, we only need to shift each RBP address down by one unit.
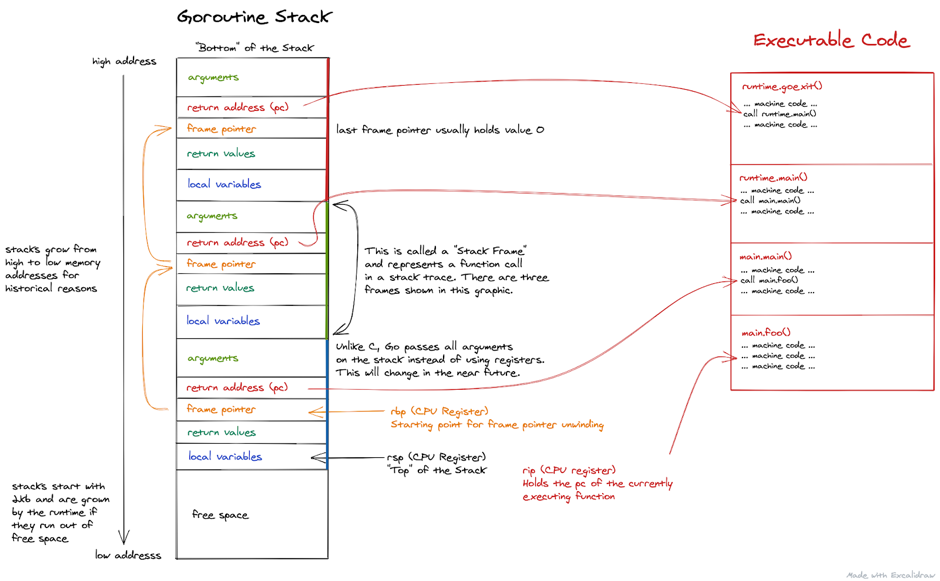
Note: In this figure, all the Go parameters are passed through the stack. This is now outdated. Since version 1.17, Go supports register passing.
Because x86-64 classifies RBP as a general-purpose register, compilers such as the GNU Compiler Collection (GCC) no longer use RBP to save the stack base address by default—unless it’s turned on by a specific option. However, the Go compiler retains this feature, so it’s feasible to use RBP for stack traceback in Go.
But Go doesn’t adopt this simple solution, because it may cause problems in some scenarios. For example, if a function is inline, the call stack obtained through RBP backtracking is missing. This solution also needs to insert additional instructions between regular function calls, and it occupies an additional general-purpose register. Even if we don’t need stack traceback, it has performance overhead.
Each Go binary file contains a gopclntab section, which is the abbreviation of Go program counter line table. The file maintains the following information:
- The mapping of
pctospand its return address. In this way, we do not need to rely onfpand can directly complete the series ofpclinked lists by looking them up in the table. - The information about whether
pcand its function have been optimized inline. Therefore, we don’t lose the inline function frame during the stack traceback. - A symbol table saves the code information (like function names and line numbers) corresponding to
pc. Therefore, we can finally see the human-readable panic results or profiling results instead of a large pile of address information.
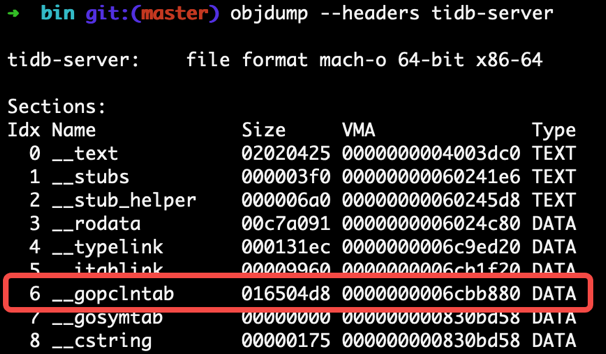
Unlike Go gopclntab, DWARF is a standardized debugging format. The Go compiler also adds DWARF (v4) information to its generated binary, so some non-Go ecosystem external tools can use it to debug Go programs. The information contained in DWARF is a superset of gopclntab.
When we get the pc array via the stack traceback technology (the gentraceback() function in the previous code block), we don’t need to immediately symbolize it. The cost of symbolization is high. We can first aggregate the pc array through the pointer address stack. “Aggregation” means accumulating samples with the same array content in the hashmap.
The stkbucket() function obtains the corresponding bucket with stk as the key and then accumulates the fields for statistics in it.
Note that memRecord has multiple groups of memRecordCycle data for statistics:
type memRecord struct {
 active memRecordCycle
 future [3]memRecordCycle
}
When we accumulate the data, a group of memRecordCycle is accessed with the mProf.cycle global variable as the subscript. mProf.cycle is incremented after each round of garbage collection (GC). Then, the memory allocation between three rounds of GC is recorded. When one round of GC completes, the memory allocation and release between the previous round of GC and this round of GC is incorporated into the final displayed statistics. This design prevents us from getting the heap profile before GC is executed. Therefore, we won’t see a lot of useless temporary memory allocation. We may also see unstable heap memory states at different times in a GC cycle.
Finally, setprofilebucket()is called to record the bucket on the mspan of the assigned address, and mProf_Free() is called to record the corresponding memory release in the future GC.
In this way, this bucket collection is maintained in the Go runtime. When we perform heap profiling, for example, when we call pprof.WriteHeapProfile(), the bucket collection is accessed and converted to the format required for pprof output.
This is also a difference between heap profiling and CPU profiling:
- CPU profiling only has sampling overhead for the application during the profiling time window.
- Heap profiling sampling occurs constantly. Performing profiling is just dumping data snapshots so far.
Next, we’ll enter the world of C/C++/Rust. Fortunately, because most heap profilers have similar implementation principles, we can apply a lot of what we’ve already learned. Go heap profiling is ported from Google TCMalloc, and they have similar implementations.
Gperftools Heap Profiler
Gperftools (originally Google Performance Tools) is a toolkit, including a heap profiler, a heap checker, a CPU profiler, and other tools.
It has a deep relationship with Go, so I’ll introduce it immediately after Go.
The Google TCMalloc, which is ported by Go runtime, has two community versions:
- TCMalloc, a pure malloc implementation without additional functions.
- gperftools, a malloc implementation with heap profiling capabilities and other supporting tool sets, including pprof. The main author of gperftools is Sanjay Ghemawat, who paired programming with Jeff Dean.
Gperftools Heap Profiler Usage
Google uses the gperftools heap profiler to analyze C++ programs’ heap memory allocation. It can:
- Determine what is currently in the program heap.
- Find memory leaks.
- Look for locations that do a lot of allocation.
Go directly hard-codes the acquisition code into the memory allocation function at runtime. Similarly, gperftools implants the acquisition code in the malloc implementation of libtcmalloc. To replace the default malloc implementation of libc, we need to execute -ltcmalloc to link the library in the project compilation link phase.
We can use the Linux dynamic link mechanism to replace the default malloc implementation of libc during runtime:
$ env LD_PRELOAD="/usr/lib/libtcmalloc.so" <binary>When LD_PRELOAD specifies libtcmalloc.so, the malloc() that is linked by default in our program is overwritten. The Linux dynamic linker ensures that the version specified by LD_PRELOAD is executed first.
Before we run the executable file linked to libtcmalloc, if we set the HEAPPROFILE environment variable to a file name, when the program is executed, heap profile data is written to the file.
By default, whenever our program allocates 1 GB of memory, or whenever the program’s memory usage high-water mark increases by 100 MB, a heap profile dump is performed. You can modify parameters through environment variables.
We can use the pprof script that comes with gperftools to analyze the dumped profile files. The usage is almost the same as that in Go.
$ pprof --gv gfs_master /tmp/profile.0100.heap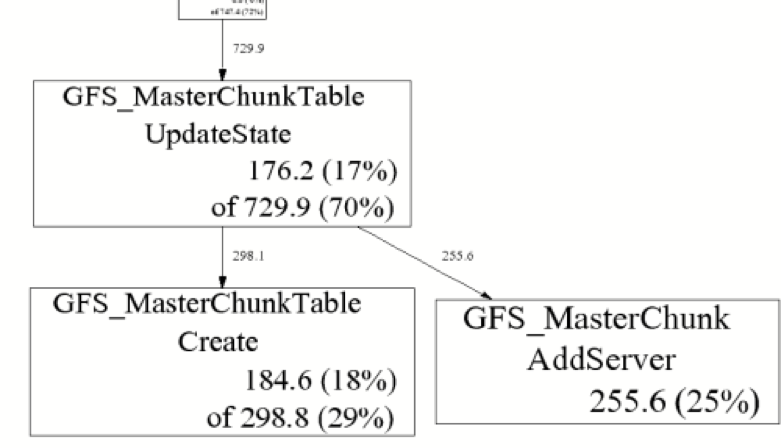
$ pprof --text gfs_master /tmp/profile.0100.heap
   255.6  24.7%  24.7%    255.6  24.7% GFS_MasterChunk::AddServer
   184.6  17.8%  42.5%    298.8  28.8% GFS_MasterChunkTable::Create
   176.2  17.0%  59.5%    729.9  70.5% GFS_MasterChunkTable::UpdateState
   169.8  16.4%  75.9%    169.8  16.4% PendingClone::PendingClone
    76.3   7.4%  83.3%     76.3   7.4% __default_alloc_template::_S_chunk_alloc
    49.5   4.8%  88.0%     49.5   4.8% hashtable::resize
   ...
In the code block above, from left to right are Flat (MB), Flat (%), Sum (%), Cum (MB), Cum (%), and Name.
Gperftools Heap Profiler Implementation
TCMalloc adds sampling logic to malloc() and the new operator. When a sampling hook is triggered based on conditions, the following function, named RecordAlloc, is executed:
// Record an allocation in the profile.
static void RecordAlloc(const void* ptr, size_t bytes, int skip_count) {
  // Take the stack trace outside the critical section.
void* stack[HeapProfileTable::kMaxStackDepth];
  int depth = HeapProfileTable::GetCallerStackTrace(skip_count + 1, stack);
  SpinLockHolder l(&heap_lock);
  if (is_on) {
    heap_profile->RecordAlloc(ptr, bytes, depth, stack);
    MaybeDumpProfileLocked();
  }
}

void HeapProfileTable::RecordAlloc(
    const void* ptr, size_t bytes, int stack_depth,
    const void* const call_stack[]) {
  Bucket* b = GetBucket(stack_depth, call_stack);
  b->allocs++;
  b->alloc_size += bytes;
  total_.allocs++;
  total_.alloc_size += bytes;

  AllocValue v;
  v.set_bucket(b);  // also did set_live(false); set_ignore(false)
  v.bytes = bytes;
  address_map_->Insert(ptr, v);
}
The execution process is as follows:
GetCallerStackTrace()is called to get the call stack.GetBucket()is called with the call stack as the hashmap key to obtain the corresponding bucket.- Bucket statistics are accumulated.
Because there is no GC, this sampling process is much simpler than Go’s. From the variable naming, we know that the profiling code in the Go runtime is transplanted from here.
sampler.h describes the gperftools sampling rules in detail. gperftools has a 512 KB average sample step—the same as the Go heap profiler.
We also need to add logic to free() or the delete operator to record the memory release. This is much simpler than the Go heap profiler with GC:
// Record a deallocation in the profile.
static void RecordFree(const void* ptr) {
  SpinLockHolder l(&heap_lock);
  if (is_on) {
    heap_profile->RecordFree(ptr);
    MaybeDumpProfileLocked();
  }
}

void HeapProfileTable::RecordFree(const void* ptr) {
  AllocValue v;
  if (address_map_->FindAndRemove(ptr, &v)) {
    Bucket* b = v.bucket();
    b->frees++;
    b->free_size += v.bytes;
    total_.frees++;
    total_.free_size += v.bytes;
  }
}
Then, we need to find the corresponding bucket and summarize free-related fields.
Modern C, C++, and Rust programs usually rely on the libunwind library to obtain the call stack. Similar to Go’s stack traceback principle, libunwind doesn’t select the frame pointer traceback mode, and it depends on the unwind table recorded in a specific section of the program. The difference is that Go relies on a specific section named gopclntab created in its own ecosystem, while C, C++, and Rust programs rely on the .debug_frame section or the .eh_frame section.
.debug_frame is defined by the DWARF standard. The Go compiler also contains this information, but it’s not used by itself and is only reserved for third-party tools. The GNU Compiler Collection (GCC) only writes debugging information to .debug_frame when the -g parameter is enabled.
The .eh_frame is more modern and is defined in the Linux Standard Base. It lets the compiler insert some pseudo-instructions, including CFI directives and call frame information in the corresponding position of the assembly. These instructions help the assembler generate the final .eh_frame section that contains the unwind table.
Take the following code as an example:
// demo.c

int add(int a, int b) {
    return a + b;
}
We use cc -S demo.c to generate assembly code; you can use either the GCC or Clang compilers. Note that the -g parameter is not used here.
.section __TEXT,__text,regular,pure_instructions
 .build_version macos, 11, 0 sdk_version 11, 3
 .globl _add                            ## -- Begin function add
 .p2align 4, 0x90
_add:                                   ## @add
 .cfi_startproc
## %bb.0:
 pushq %rbp
 .cfi_def_cfa_offset 16
 .cfi_offset %rbp, -16
 movq %rsp, %rbp
 .cfi_def_cfa_register %rbp
 movl %edi, -4(%rbp)
 movl %esi, -8(%rbp)
 movl -4(%rbp), %eax
 addl -8(%rbp), %eax
 popq %rbp
 retq
 .cfi_endproc
                                        ## -- End function
.subsections_via_symbols
The generated assembly code includes many .cfi_-prefixed pseudo-instructions, which are CFI directives.
Jemalloc Heap Profiler
By default, TiKV uses jemalloc as its memory allocator.
Jemalloc Heap Profiler Usage
Jemalloc includes heap profiling capability, but it’s not enabled by default. When we compile code, we need to specify the --enable-prof parameter.
./autogen.sh
./configure --prefix=/usr/local/jemalloc-5.1.0 --enable-prof
make
make install
Just as we do with TCMalloc, we can link jemalloc to the program through -ljemalloc or overwrite libc’s malloc() with jemalloc through LD_PRELOAD.
Let’s take the Rust program as an example to show how to perform heap profiling through jemalloc:
fn main() {
    let mut data = vec![];
    loop {
        func1(&mut data);
        std::thread::sleep(std::time::Duration::from_secs(1));
    }
}

fn func1(data: &mut Vec<Box<[u8; 1024*1024]>>) {
    data.push(Box::new([0u8; 1024*1024])); // alloc 1mb
    func2(data);
}

fn func2(data: &mut Vec<Box<[u8; 1024*1024]>>) {
    data.push(Box::new([0u8; 1024*1024])); // alloc 1mb
}
We allocate 2 MB of heap memory per second in Rust: 1 MB each for func1 and func2. func1 calls func2.
We use rustc to compile the file without any parameters. To start the program, we execute the following command:
$ export MALLOC_CONF="prof:true,lg_prof_interval:25"
$ export LD_PRELOAD=/usr/lib/libjemalloc.so
$ ./demo
MALLOC_CONF specifies jemalloc-related parameters. prof:true enables the profiler, log_prof_interval:25 dumps a profile file every time 2^25 bytes (32 MB) of heap memory is allocated.
For more MALLOC_CONF options, refer to this document.
After a period of time, we can see that some profile files are generated.

jemalloc provides jeprof, a tool similar to TCMalloc pprof. In fact, it’s forked from the pprof Perl script. We can use jeprof to review the profile file.
$ jeprof ./demo jeprof.7262.0.i0.heap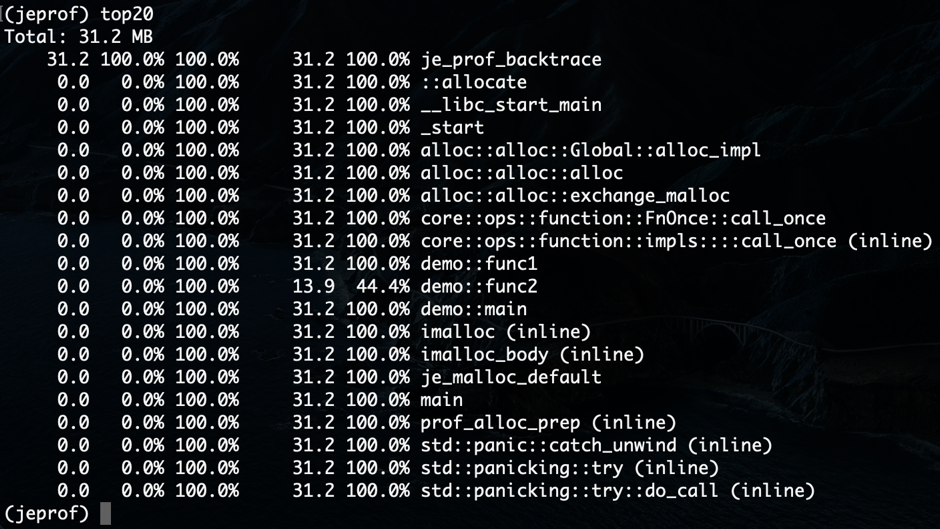
jeprof can generate the same graph as Go and gperftools:
$ jeprof --gv ./demo jeprof.7262.0.i0.heap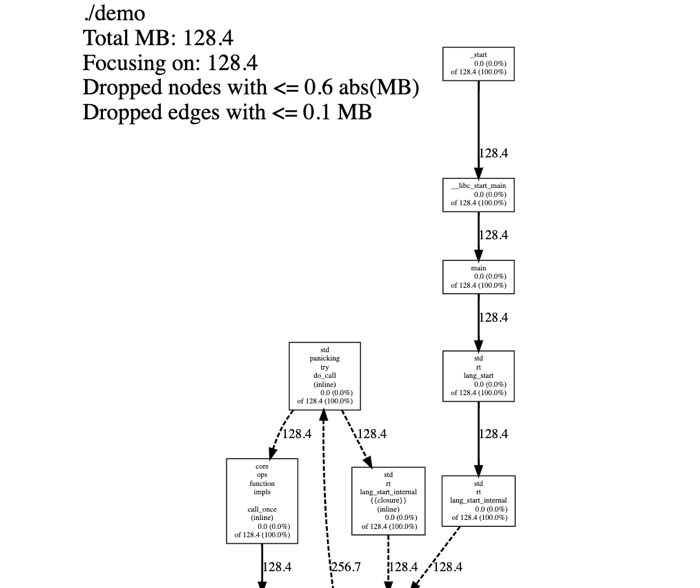
Jemalloc Heap Profiler Usage Implementation
Similar to TCMalloc, jemalloc adds sampling logic to malloc():
JEMALLOC_ALWAYS_INLINE int
imalloc_body(static_opts_t *sopts, dynamic_opts_t *dopts, tsd_t *tsd) {
 // ...
 // If profiling is on, get our profiling context.
 if (config_prof && opt_prof) {
  bool prof_active = prof_active_get_unlocked();
  bool sample_event = te_prof_sample_event_lookahead(tsd, usize);
  prof_tctx_t *tctx = prof_alloc_prep(tsd, prof_active,
      sample_event);

  emap_alloc_ctx_t alloc_ctx;
  if (likely((uintptr_t)tctx == (uintptr_t)1U)) {
   alloc_ctx.slab = (usize <= SC_SMALL_MAXCLASS);
   allocation = imalloc_no_sample(
       sopts, dopts, tsd, usize, usize, ind);
  } else if ((uintptr_t)tctx > (uintptr_t)1U) {
   allocation = imalloc_sample(
       sopts, dopts, tsd, usize, ind);
   alloc_ctx.slab = false;
  } else {
   allocation = NULL;
  }

  if (unlikely(allocation == NULL)) {
   prof_alloc_rollback(tsd, tctx);
   goto label_oom;
  }
  prof_malloc(tsd, allocation, size, usize, &alloc_ctx, tctx);
 } else {
  assert(!opt_prof);
  allocation = imalloc_no_sample(sopts, dopts, tsd, size, usize,
      ind);
  if (unlikely(allocation == NULL)) {
   goto label_oom;
  }
 }
 // ...
}
Call prof_malloc_sample_object() in prof_malloc() to accumulate the corresponding call stack records in the hashmap:
void
prof_malloc_sample_object(tsd_t *tsd, const void *ptr, size_t size,
    size_t usize, prof_tctx_t *tctx) {
 // ...
 malloc_mutex_lock(tsd_tsdn(tsd), tctx->tdata->lock);
 size_t shifted_unbiased_cnt = prof_shifted_unbiased_cnt[szind];
 size_t unbiased_bytes = prof_unbiased_sz[szind];
 tctx->cnts.curobjs++;
 tctx->cnts.curobjs_shifted_unbiased += shifted_unbiased_cnt;
 tctx->cnts.curbytes += usize;
 tctx->cnts.curbytes_unbiased += unbiased_bytes;
 // ...
}
The logic injected by jemalloc in free() is similar to TCMalloc. jemalloc also uses libunwind for stack traceback.
Bytehound Heap Profiler
Bytehound, written in Rust, is a memory profiler for the Linux platform. Due to its high performance overhead, we can’t use it in TiKV. However, we’ll briefly introduce its usage. Our focus is on how it’s implemented.
Bytehound Heap Profiler Usage
We can download Bytehound’s binary dynamic library on its Releases page, which is only supported by the Linux platform.
Then, like TCMalloc or jemalloc, Bytehound mounts its own implementation via LD_PRELOAD. Here, we assume that we’re running the same Rust program with memory leaks in the Bytehound heap profiler section:
$ LD_PRELOAD=./libbytehound.so ./demoNext, a memory-profiling_*.dat file is generated in the program’s working directory. This is the product of Bytehound’s heap profiling. Unlike other heap profilers, this file is continuously updated instead of generating a new file every specific time.
Then, we execute the following command to open a web port for analyzing the files above in real time:
$ ./bytehound server memory-profiling_*.dat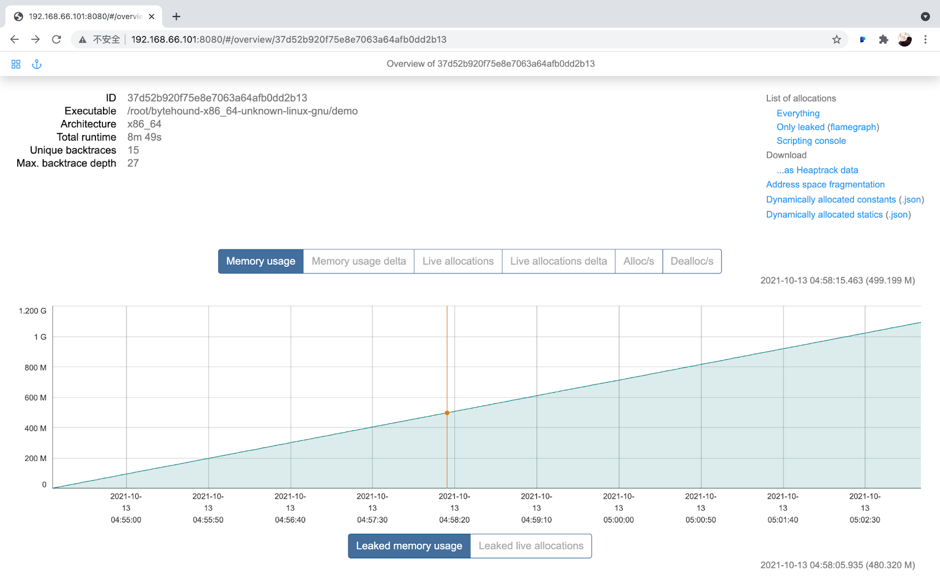
We can click Flamegraph in the upper right corner to view the flamegraph:
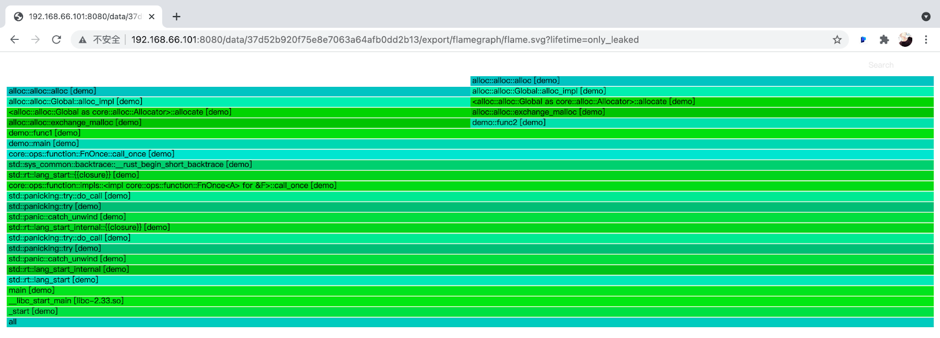
From the flamegraph, we can see that demo::func1 and demo::func2 are memory hotspots.
To learn more about Bytehound, see its documentation.
Bytehound Heap Profiler Implementation
Bytehound replaces the user’s default malloc implementation. However, it does not implement a memory allocator; it was packaged based on jemalloc.
// Entry
#[cfg_attr(not(test), no_mangle)]
pub unsafe extern "C" fn malloc( size: size_t ) -> *mut c_void {
    allocate( size, AllocationKind::Malloc )
}

#[inline(always)]
unsafe fn allocate( requested_size: usize, kind: AllocationKind ) -> *mut c_void {
    // ...
    // Call jemalloc for memory allocation
    let pointer = match kind {
        AllocationKind::Malloc => {
            if opt::get().zero_memory {
                calloc_real( effective_size as size_t, 1 )
            } else {
                malloc_real( effective_size as size_t )
            }
        },
        // ...
    };
    // ...
    // Stack traceback
    let backtrace = unwind::grab( &mut thread );
    // ...
    // Record samples
    on_allocation( id, allocation, backtrace, thread );
    pointer
}

// xxx_real links to jemalloc implementation
#[cfg(feature = "jemalloc")]
extern "C" {
    #[link_name = "_rjem_mp_malloc"]
    fn malloc_real( size: size_t ) -> *mut c_void;
    // ...
}
Each time memory is allocated, Bytehound performs stack traceback and recording. There is no sampling logic. The on_allocation hook sends the allocation record to the channel. The unified processor thread consumes the record in the channel and processes the record asynchronously.
pub fn on_allocation(
    id: InternalAllocationId,
    allocation: InternalAllocation,
    backtrace: Backtrace,
    thread: StrongThreadHandle
) {
    // ...
    crate::event::send_event_throttled( move || {
        InternalEvent::Alloc {
            id,
            timestamp,
            allocation,
            backtrace,
        }
    });
}

#[inline(always)]
pub(crate) fn send_event_throttled< F: FnOnce() -> InternalEvent >( callback: F ) {
    EVENT_CHANNEL.chunked_send_with( 64, callback );
}
The implementation of EVENT_CHANNEL is Mutex<Vec>:
pub struct Channel< T > {
    queue: Mutex< Vec< T > >,
    condvar: Condvar
}
Testing Heap Profiler Performance Overhead
In this section, we’ll measure the performance overhead of heap profilers mentioned above. Measurement methods are based on scenarios.
We ran the tests separately but in the same test environment:
| Key Components | Specification |
| Host | Intel NUC11PAHi7 |
| CPU | Intel Core i7-1165G7 2.8GHz~4.7GHz 4 cores 8 threads |
| RAM | Kingston 64G DDR4 3200MHz |
| Hard disk | Samsung 980PRO 1T SSD PCIe4. |
| OS | Arch Linux Kernel-5.14.1 |
Go
In Go, we used TiDB (an open-source distributed SQL database) + unistore to deploy a single node, adjusted the runtime.MemProfileRate parameter, and used sysbench to measure the performance.
The related software versions and stress test parameters are:
| Software | Version |
| Go | 1.17.1 |
| TiDB | v5.3.0-alpha-1156-g7f36a07de |
| Commit hash | 7f36a07de9682b37d46240b16a2107f5c84941ba |
| Sysbench parameter | Specification |
| Version | 1.0.20 |
| Tables | 8 |
| TableSize | 100,000 |
| Threads | 128 |
| Operation | oltp_read_only |
We got the following results:
| MemProfileRate | Result |
| 0: Don’t record | Transactions: 1,505,224 (2,508.52 per s)Queries: 24,083,584 (40,136.30 per s)Latency (AVG): 51.02 msLatency (P95): 73.13 ms |
| 512 KB: Record samples | Transactions: 1,498,855 (2,497.89 per s)Queries: 23,981,680 (39,966.27 per s)Latency (AVG): 51.24 msLatency (P95): 74.46 ms |
| 1: Full record | Transactions: 75,178 (125.18 per s)Queries: 1,202,848 (2,002.82 per s)Latency (AVG): 1,022.04 msLatency (P95): 2,405.65 ms |
Compared with “don’t record,” whether it is transactions per second (TPS), queries per second (QPS), or P95 latency, the 512 KB sampling record’s performance overhead is generally within 1%.
We expected that the performance overhead brought by full record would be very high; however, it’s unexpectedly high: TPS and QPS have decreased by 20 times, and P95 latency has increased by 30 times.
Because heap profiling is a general feature, we cannot accurately measure the general performance overhead under all scenarios, and only the measurement conclusions in specific projects are valuable. TiDB is a computation-intensive application. However, it might not allocate memory as frequently as some memory-intensive applications. Therefore, all conclusions in this article can only be used as a reference, and you can measure the overhead based on your own application scenarios.
TCMalloc and jemalloc Test Results
We measured TCMalloc and jemalloc based on TiKV, a distributed transactional key-value storage engine for TiDB. We deployed a Placement Driver (PD) process (the TiDB cluster component that manages metadata) and a TiKV process on the machine and used go-ycsb for stress testing. Important parameters are as follows:
threadcount=200
recordcount=100000
operationcount=1000000
fieldcount=20
Before we started TiKV, we used LD_PRELOAD to inject different malloc hooks. TCMalloc used the default configuration, which was 512 KB sampling similar to Go; jemalloc used the default sampling strategy and dumped a profile file every time 1 GB of heap memory was allocated.
We got the following results, measured in operations per second (OPS).
| Allocator | Test result |
| Default memory allocator | OPS: 119,037.2Avg (μs): 4,186P99 (μs): 14,000 |
| TCMalloc | OPS: 113,708.8Avg (μs): 4,382 P99 (μs): 16,000 |
| jemalloc | OPS: 114,639.9 Avg (μs): 4,346 P99 (μs): 15,000 |
The performance of TCMalloc and jemalloc is almost the same. Compared with the default memory allocator, their OPS has dropped by about 4%, and the P99 latency has increased by about 10%.
We’ve learned that the implementation of TCMalloc is almost the same as that of Go heap pprof, but the data measured here is not consistent. This might be because TiKV and TiDB allocate memory differently. We cannot accurately measure the general performance overhead under all scenarios. Our conclusions only apply to the specific project.
Bytehound Test Results
I did not put Bytehound, TCMalloc, and jemalloc in the same section. This is because when we use Bytehound on TiKV, a deadlock problem occurs during startup.
I speculate that because Bytehound’s performance overhead is very high, in theory it cannot be applied in the TiKV production environment. We only need to prove whether my speculation is true.
My speculation is based on the fact that Bytehound does not contain sample logic. The data collected each time is sent to the background thread for processing through the channel, and the channel is simply encapsulated with Mutex+Vec.
We use a simple project called mini-redis to measure Bytehound’s performance overhead. Because the goal is only to confirm whether it can meet the requirements of the TiKV production environment, not to accurately measure the data, we only count and compare the TPS. The driver code snippet is as follows:
var count int32

for n := 0; n < 128; n++ {
 go func() {
  for {
   key := uuid.New()
   err := client.Set(key, key, 0).Err()
   if err != nil {
    panic(err)
   }
   err = client.Get(key).Err()
   if err != nil {
    panic(err)
   }
   atomic.AddInt32(&count, 1)
  }
 }()
}
We enable the 128 goroutine to read and write to the server. A read or write is considered a complete operation. Only the number of times is counted, and metrics such as latency are not measured. We divide the total number of times by the execution time to get different TPS before and after the Bytehound is enabled.
The results are as follows:
| Configuration | Test result |
| Default configuration | Count: 11,784,571 Time: 60 s TPS: 196,409 |
| Enabling Bytehound | Count: 5,660,952 Time: 60 s TPS: 94,349 |
TPS has decreased by more than 50%.
Opinions expressed by DZone contributors are their own.

Comments