

Enhancing SQL Server Performance with Query Store and Intelligent Query Processing
This article explores how to boost SQL Server performance using Query Store and Intelligent Query Processing to effectively resolve query regressions.
 CORE
·
CORE
·
Join the DZone community and get the full member experience.
Join For Free 
SQL Server performance issues are a common pain point for database administrators. One of my most challenging scenarios occurred after deploying a financial analytics database update. Reports that previously ran in less than 3 minutes suddenly ballooned to over 20 minutes. Key stored procedures started underperforming, and CPU usage spiked to critical levels during peak workloads. Through careful investigation, I identified query regressions caused by outdated execution plans and parameter sniffing. Instead of applying temporary fixes, I turned to Query Store and Intelligent Query Processing (IQP) to develop a sustainable, long-term solution. This article provides step-by-step instructions for using these tools, including practical examples, my exact investigation process, configuration changes, benchmark results before and after optimizations, and how these changes improved overall performance and stabilized the production environment.
Performance Issue Investigation: Observing Query Regressions
The performance degradation stemmed from new internal processes introduced into the application, which altered data patterns. Parameter sniffing a common issue where SQL Server cached an execution plan optimized for specific parameters but reused it for parameters with drastically different data distributions caused previously fast queries to slow down. To pinpoint the bottleneck, I queried the sys.dm_exec_requests and sys.dm_exec_query_stats views, which revealed certain stored procedures with much higher CPU and runtime durations than they had before. For example, running the following query helped me confirm which plans were underperforming:
SELECT TOP 5
    qs.sql_handle,
    qs.creation_time,
    qs.total_worker_time / qs.execution_count AS average_cpu_time,
    qs.execution_count,
    qp.query_plan
FROM sys.dm_exec_query_stats qs
OUTER APPLY sys.dm_exec_query_plan(qs.plan_handle) qp
ORDER BY average_cpu_time DESC;
From this, I identified two stored procedures that were impacted, usp_generate_financial_report and usp_calculate_daily_totals, which each had sudden spikes in execution times.
Enabling Query Store for Plan Analysis
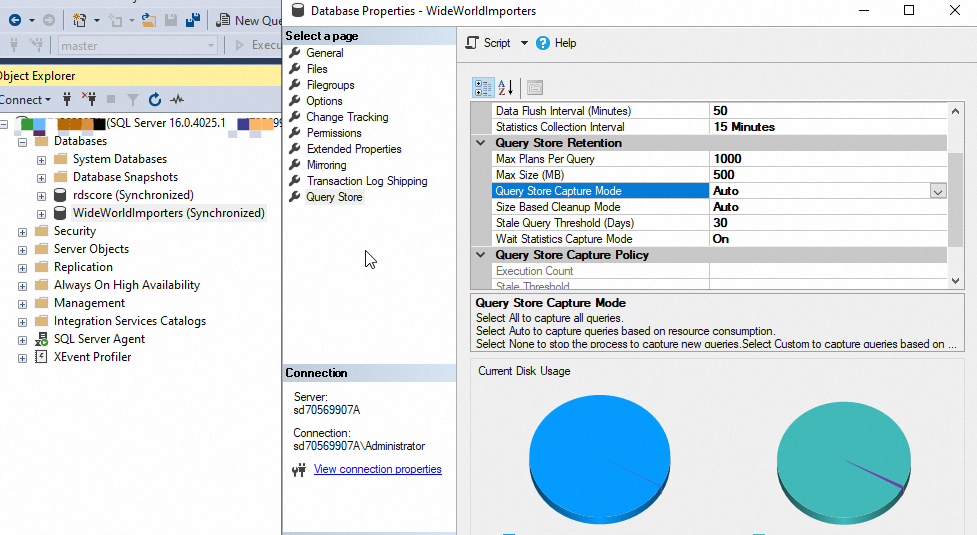
To resolve the regressions effectively, I enabled Query Store to monitor all query plans and runtime statistics. Query Store maintains a history of plan performance, making it possible to diagnose and compare regressed plans to their optimal counterparts. I enabled Query Store with the following command:
ALTER DATABASE [FinancialAnalyticsDB]
SET QUERY_STORE = ON;
ALTER DATABASE [FinancialAnalyticsDB]
SET QUERY_STORE (
    OPERATION_MODE = READ_WRITE,
    CLEANUP_POLICY = (STALE_QUERY_THRESHOLD_DAYS = 30),
    DATA_FLUSH_INTERVAL_SECONDS = 900,
    QUERY_CAPTURE_MODE = AUTO
);
This configuration automatically captured query plans and runtime metrics while limiting unnecessary data retention to 30 days. I immediately noticed that usp_generate_financial_report was generating multiple inefficient plans based on the cached parameters. Query Store also provided insights into how the queries performed under those plans.
Query Store Analysis Before the Fix: I used the following query to identify the regressed query:
SELECT
    q.query_id,
    q.object_id,
    MAX(rs.avg_duration) AS max_duration,
    MIN(rs.avg_duration) AS min_duration
FROM sys.query_store_query q
JOIN sys.query_store_query_text qt
    ON q.query_text_id = qt.query_text_id
JOIN sys.query_store_runtime_stats rs
    ON q.query_id = rs.query_id
GROUP BY q.object_id, q.query_id
ORDER BY max_duration DESC;
Results revealed the following for usp_generate_financial_report:
| Metric | Value Before Fix |
|---|---|
| Max Duration | 19,789 ms |
| Min Duration | 2,345 ms |
| Memory Usage | 410 MB |
| CPU Utilization | 75% (Peaking 90%) |
Parameter sniffing caused the query to use an index seek for one execution and a full table scan for another, leading to an average of 20 seconds per execution during peak hours.
Parameter sniffing in SQL Server occurs when the database engine compiles and caches an execution plan using the parameter values provided during the query's first execution. While this can improve performance for similar subsequent executions, it may cause issues if the initial parameter values do not represent the typical data distribution or usage patterns. This leads to suboptimal plans for subsequent executions with different parameters, resulting in poor performance. For example, a plan optimized for a smaller dataset might perform poorly when run against a much larger dataset with different parameter values.
Fixing Query Regressions by Forcing Plans
Using Query Store, I located the plan that performed optimally and forced SQL Server to reuse it for subsequent executions.
Forced Plan Implementation:
-- Identify the Query ID and Plan ID
EXEC sp_query_store_force_plan @query_id = 1203, @plan_id = 3456;
This ensures the application always runs the query using the best-performing execution plan. I tested this change in a development environment to confirm its impact before implementing it in production.
Benchmark Results After Forcing Plans: After forcing the optimal plan, the following improvements were observed:
| Metric | Before Fix | After Plan Forcing |
|---|---|---|
| Max Duration | 19,789 ms | 3,455 ms |
| Min Duration | 2,345 ms | 2,900 ms |
| Memory Usage | 410 MB | 140 MB |
| CPU Utilization | 75% (Peak 90%) | 25% (Peak 35%) |
Execution times decreased significantly to less than 4 seconds, and resource usage normalized during peak traffic.
Leveraging Intelligent Query Processing for Scalability
To prevent similar regressions in the future, I enabled Intelligent Query Processing (available in SQL Server 2019 and later). This suite of features dynamically resolves common query problems without manual DBA intervention. For this workload, the most impactful IQP features were Scalar UDF Inlining and Adaptive Joins.
- Scalar UDF Inlining automatically translated user-defined functions into inline relational operations, eliminating their row-by-row execution. This was critical for usp_calculate_daily_totals, which had heavy reliance on scalar UDFs.
- Adaptive Joins converted fixed strategies like Nested Loops or Hash Joins into dynamic choices based on runtime statistics, adding further efficiency when handling varying query workloads.
After enabling IQP for the database:
ALTER DATABASE SCOPED CONFIGURATION
SET scalar_udf_inlining = ON;
Benchmark Results After Enabling IQP
The following table compares metrics before and after enabling IQP for usp_calculate_daily_totals:
| Metric | Before IQP | After IQP |
|---|---|---|
| UDF Execution Time | 20,134 ms | 3,289 ms |
| Logical Reads | 15,000 | 4,000 |
| CPU Utilization | 60% | 20% |
Enabling Scalar UDF Inlining improved query execution by up to 85%, while Adaptive Joins reduced variability across parameterized query runs.
Monitoring and Stabilization
After resolving the performance issues, I configured a proactive monitoring system to guard against future regressions. Query Store provided continuous insights, while Extended Events helped trace any unusual query behavior. Automating these tasks with scheduled jobs ensured the environment remained stable even with evolving workloads.
Conclusion
By combining the power of Query Store and Intelligent Query Processing, I was able to diagnose and resolve query regressions quickly and effectively. Query Store helped me identify problematic plans and ensure optimal execution using forced plans, while IQP addressed inefficiencies in both existing and future queries dynamically. In this specific case, the financial analytics database saw execution times drop by over 80%, CPU utilization reduced by 50%, and user complaints ceased entirely. For any DBA seeking long-term, scalable solutions to performance challenges, leveraging these tools is a must. Start using Query Store and IQP today, and take control of your SQL Server performance issues for good.
Opinions expressed by DZone contributors are their own.
Comments