Ensure High Availability and Uptime With Kubernetes Horizontal Pod Autoscaler and Prometheus
Learn how to set up an autoscaling environment for Kubernetes using HPA and Cluster Autoscaler to allow scaling based on custom factors.
Join the DZone community and get the full member experience.
Join For FreeAutoscaling in Kubernetes
Autoscaling is an approach to automatically scale workloads up or down based on resource usage.
Autoscaling in Kubernetes has two dimensions:
- the Cluster Autoscaler that deals with node scaling operations and
- the Horizontal Pod Autoscaler (HPA) that automatically scales the number of pods in a deployment or replica set.
The Cluster Autoscaling together with the Horizontal Pod Autoscaler (HPA) can be used to dynamically adjust the computing power as well as the level of parallelism that your system needs to meet SLAs.
While the Cluster Autoscaler is highly dependent on the underlying capabilities of the cloud provider that's hosting your cluster, the HPA can operate independently of your IaaS/PaaS provider.
The Evolution of HPA
The Horizontal Pod Autoscaler feature was first introduced in Kubernetes v1.1 and has evolved a lot since then. Version 1 of the HPA scaled pods based on observed CPU utilization and later on memory usage. In Kubernetes 1.6 a new API Custom Metrics API was introduced that enabled HPA access to arbitrary metrics. And eventually Kubernetes 1.7 introduced the aggregation layer that allows 3rd party applications to extend the Kubernetes API by registering themselves as API add-ons.
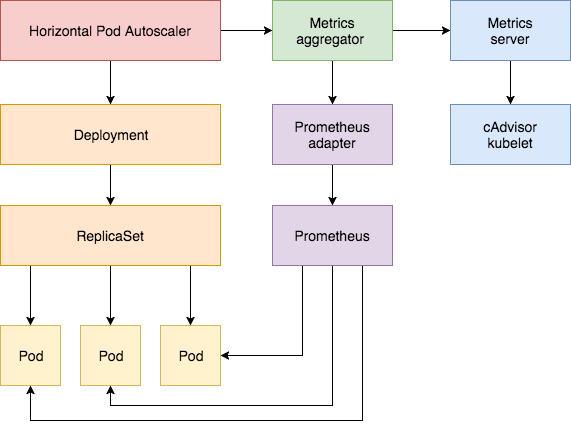
The Custom Metrics API along with the aggregation layer made it possible for monitoring systems like Prometheus to expose application-specific metrics to the HPA controller.
The Horizontal Pod Autoscaler is implemented as a control loop that periodically queries the Resource Metrics API for core metrics like CPU/memory and the Custom Metrics API for application-specific metrics.
What follows is a step-by-step guide on configuring HPA v2 for Kubernetes 1.9 or later:
- Install the Metrics Server add-on that supplies the core metrics.
- Use a demo app to showcase pod autoscaling based on CPU and memory usage.
- Deploy Prometheus and a custom API server. Register the custom API server with the aggregation layer.
- Configure HPA with custom metrics supplied by the demo application.
Before you begin you need to install Go 1.8 or later and clone the k8s-prom-hpa repo in your GOPATH:
cd $GOPATH
git clone https://github.com/stefanprodan/k8s-prom-hpa
1. Setting up the Metrics Server
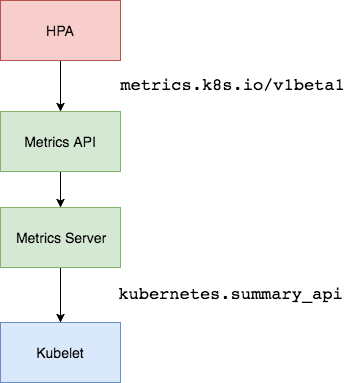
The Kubernetes Metrics Server is a cluster-wide aggregator of resource usage data and is the successor of Heapster. The metrics server collects CPU and memory usage for nodes and pods by pooling data from the kubernetes.summary_api. The summary API is a memory-efficient API for passing data from Kubelet/cAdvisor to the metrics server.
If in the first version of HPA you would need Heapster to provide CPU and memory metrics; in HPA v2 and Kubernetes 1.8 only the metrics server is required with the horizontal-pod-autoscaler-use-rest-clients switched on. The HPA rest client is enabled by default in Kubernetes 1.9. GKE 1.9 comes with the Metrics Server pre-installed.
Deploy the Metrics Server in the kube-system namespace:
kubectl create -f ./metrics-server
After one minute the metric-server starts reporting CPU and memory usage for nodes and pods.
View nodes metrics:
kubectl get --raw "/apis/metrics.k8s.io/v1beta1/nodes" | jq .
View pods metrics:
kubectl get --raw "/apis/metrics.k8s.io/v1beta1/pods" | jq .
2. Auto Scaling Based on CPU and Memory Usage
You will use a small Golang-based web app to test the Horizontal Pod Autoscaler (HPA).
Deploy podinfo to the default namespace:
kubectl create -f ./podinfo/podinfo-svc.yaml,./podinfo/podinfo-dep.yaml
Access podinfo with the NodePort service at http://<K8S_PUBLIC_IP>:31198.
Next, define an HPA that maintains a minimum of two replicas and scales up to ten if the CPU average is over 80% or if the memory goes over 200Mi:
apiVersion: autoscaling/v2beta1
kind: HorizontalPodAutoscaler
metadata:
  name: podinfo
spec:
  scaleTargetRef:
    apiVersion: extensions/v1beta1
    kind: Deployment
    name: podinfo
  minReplicas: 2
  maxReplicas: 10
  metrics:
  - type: Resource
    resource:
      name: cpu
      targetAverageUtilization: 80
  - type: Resource
    resource:
      name: memory
      targetAverageValue: 200Mi
Create the HPA:
kubectl create -f ./podinfo/podinfo-hpa.yaml
After a couple of seconds the HPA controller contacts the metrics server and then fetches the CPU and memory usage:
kubectl get hpa
NAME      REFERENCE            TARGETS                      MINPODS   MAXPODS   REPLICAS   AGE
podinfo   Deployment/podinfo   2826240 / 200Mi, 15% / 80%   2         10        2          5m
In order to increase the CPU usage, run a load test with rakyll/hey:
#install hey
go get -u github.com/rakyll/hey
#do 10K requests
hey -n 10000 -q 10 -c 5 http://<K8S_PUBLIC_IP>:31198/
You can monitor the HPA events with:
$ kubectl describe hpa
Events:
  Type    Reason             Age   From                       Message
  ----    ------             ----  ----                       -------
  Normal  SuccessfulRescale  7m    horizontal-pod-autoscaler  New size: 4; reason: cpu resource utilization (percentage of request) above target
  Normal  SuccessfulRescale  3m    horizontal-pod-autoscaler  New size: 8; reason: cpu resource utilization (percentage of request) above target
Remove podinfo for the moment. You will deploy it again later on in this tutorial:
kubectl delete -f ./podinfo/podinfo-hpa.yaml,./podinfo/podinfo-dep.yaml,./podinfo/podinfo-svc.yaml
3. Setting up a Custom Metrics Server
In order to scale based on custom metrics you need to have two components. One component that collects metrics from your applications and stores them the Prometheus time series database. And a second component that extends the Kubernetes custom metrics API with the metrics supplied by the collect, the k8s-prometheus-adapter.

You will deploy Prometheus and the adapter in a dedicated namespace.
Create the monitoring namespace:
kubectl create -f ./namespaces.yaml
Deploy Prometheus v2 in the monitoring namespace:
kubectl create -f ./prometheus
Generate the TLS certificates needed by the Prometheus adapter:
make certs
Deploy the Prometheus custom metrics API adapter:
kubectl create -f ./custom-metrics-api
List the custom metrics provided by Prometheus:
kubectl get --raw "/apis/custom.metrics.k8s.io/v1beta1" | jq .
Get the FS usage for all the pods in the monitoring namespace:
kubectl get --raw "/apis/custom.metrics.k8s.io/v1beta1/namespaces/monitoring/pods/*/fs_usage_bytes" | jq .
4. Auto Scaling Based on Custom Metrics
Create podinfo NodePort service and deployment in the default namespace:
kubectl create -f ./podinfo/podinfo-svc.yaml,./podinfo/podinfo-dep.yaml
The podinfo app exposes a custom metric named http_requests_total. The Prometheus adapter removes the _total suffix and marks the metric as a counter metric.
Get the total requests per second from the custom metrics API:
kubectl get --raw "/apis/custom.metrics.k8s.io/v1beta1/namespaces/default/pods/*/http_requests" | jq .
{
  "kind": "MetricValueList",
  "apiVersion": "custom.metrics.k8s.io/v1beta1",
  "metadata": {
    "selfLink": "/apis/custom.metrics.k8s.io/v1beta1/namespaces/default/pods/%2A/http_requests"
  },
  "items": [
    {
      "describedObject": {
        "kind": "Pod",
        "namespace": "default",
        "name": "podinfo-6b86c8ccc9-kv5g9",
        "apiVersion": "/__internal"
      },
      "metricName": "http_requests",
      "timestamp": "2018-01-10T16:49:07Z",
      "value": "901m"    },
    {
      "describedObject": {
        "kind": "Pod",
        "namespace": "default",
        "name": "podinfo-6b86c8ccc9-nm7bl",
        "apiVersion": "/__internal"
      },
      "metricName": "http_requests",
      "timestamp": "2018-01-10T16:49:07Z",
      "value": "898m"
    }
  ]
}
The m represents milli-units, so for example, 901m means 901 milli-requests.
Create an HPA that will scale up the podinfo deployment if the number of requests goes over 10 per second:
apiVersion: autoscaling/v2beta1
kind: HorizontalPodAutoscaler
metadata:
  name: podinfo
spec:
  scaleTargetRef:
    apiVersion: extensions/v1beta1
    kind: Deployment
    name: podinfo
  minReplicas: 2
  maxReplicas: 10
  metrics:
  - type: Pods
    pods:
      metricName: http_requests
      targetAverageValue: 10
Deploy the podinfo HPA in the default namespace:
kubectl create -f ./podinfo/podinfo-hpa-custom.yaml
After a couple of seconds the HPA fetches the http_requests value from the metrics API:
kubectl get hpa
NAME      REFERENCE            TARGETS     MINPODS   MAXPODS   REPLICAS   AGE
podinfo   Deployment/podinfo   899m / 10   2         10        2          1m
Apply some load on the podinfo service with 25 requests per second:
#install hey
go get -u github.com/rakyll/hey
#do 10K requests rate limited at 25 QPS
hey -n 10000 -q 5 -c 5 http://<K8S-IP>:31198/healthz
After a few minutes the HPA begins to scale up the deployment:
kubectl describe hpa
Name:                       podinfo
Namespace:                  default
Reference:                  Deployment/podinfo
Metrics:                    ( current / target )
  "http_requests" on pods:  9059m / 10<
Min replicas:               2
Max replicas:               10
Events:
  Type    Reason             Age   From                       Message
  ----    ------             ----  ----                       -------
  Normal  SuccessfulRescale  2m    horizontal-pod-autoscaler  New size: 3; reason: pods metric http_requests above target
At the current rate of requests per second the deployment will never get to the max value of 10 pods. Three replicas are enough to keep the RPS under 10 per each pod.
After the load tests finishes, the HPA down scales the deployment to it's initial replicas:
Events:
  Type    Reason             Age   From                       Message
  ----    ------             ----  ----                       -------
  Normal  SuccessfulRescale  5m    horizontal-pod-autoscaler  New size: 3; reason: pods metric http_requests above target
  Normal  SuccessfulRescale  21s   horizontal-pod-autoscaler  New size: 2; reason: All metrics below target
You may have noticed that the autoscaler doesn't react immediately to usage spikes. By default the metrics sync happens once every 30 seconds. Also scaling up/down can only happen if there was no rescaling within the last 3-5 minutes. This ensures the HPA prevents rapid execution of conflicting decisions and gives time for the Cluster Autoscaler to kick in.
Conclusions
Not all systems can meet their SLAs by relying on CPU/memory usage metrics alone, most web and mobile backends require autoscaling based on requests per second to handle any traffic bursts.
For Extract Transform Load (ETL) apps, auto scaling could be triggered by the job queue length exceeding some threshold and so on.
But by instrumenting your applications with Prometheus and exposing the right metrics for autoscaling, you can fine tune your apps to better handle bursts and ensure high availability.
Thoughts, questions, remarks? Join our discussion on Slack!
Published at DZone with permission of Stefan Prodan. See the original article here.
Opinions expressed by DZone contributors are their own.
Comments