Environmental Monitoring with TPS, Azure, and PowerBI
Learn how to collect environmental data with Tibbo Project System devices, process it with Azure Stream Analytics and visualize using Power BI.
Join the DZone community and get the full member experience.
Join For FreeСollect environmental data with Tibbo Project System devices, process it with Azure Stream Analytics and visualize using Power BI.
Configure and Assemble the TPS
- Open LTPS Web Interface by simply entering its IP address in your browser, select the "Tibbits Layout" tab, and push the "Launch TPS Configurator..." button.
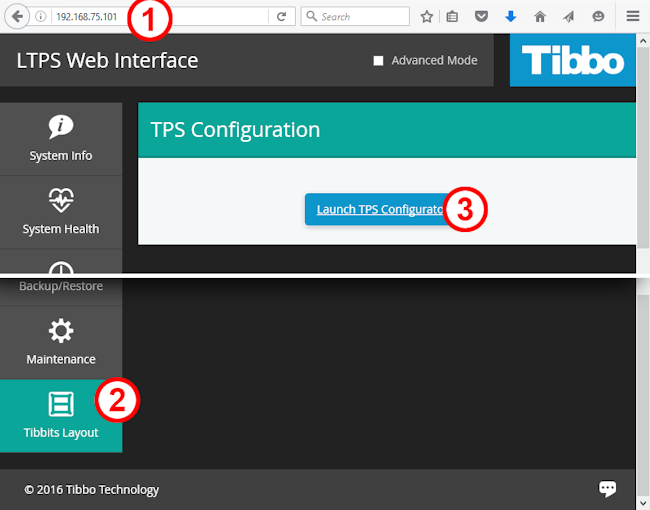
Setup Tibbits Layout as shown on the screenshot below and click File/Save
Note: TPS needs to be rebooted to take new Tibbits Layout into effect.

- Assemble TPS according to the Tibbits Layout
Attention: it's strongly recommended to shut down TPS before placing/removing Tibbits.

Step 1: First Application
Node.js, Git and Python 2.7 are installed on each LTPS by default, but NPM is not.
- For installing, connect it to your device with SSH and do the following:
# Setup package repositories
    smart channel --add 150a type=rpm-md name="LTPS all" baseurl=http://tibbo.com/downloads/LTPS/packets/all/ -y
    smart channel --add 150c type=rpm-md name="LTPS cortexa" baseurl=http://tibbo.com/downloads/LTPS/packets/cortexa8hf_neon/ -y
    smart update
# Install NPM
    smart install nodejs-npm -y
Then:
# Create folder for application
    cd /opt/node-apps/
    mkdir environment
    cd environment
# Install required modules
    npm install @tibbo-tps/tibbit-28
    npm install @tibbo-tps/tibbit-30
npm install @tibbo-tps/tibbit-35Note: opt/node-apps/ folder is proposed to be used for your Node.JS apps.
- In any IDE or even a text editor create azure-app-0.js file with you application:
var tibbit28 = require("@tibbo-tps/tibbit-28").init("S11");
var tibbit35 = require("@tibbo-tps/tibbit-35").init("S13");
var tibbit30 = require("@tibbo-tps/tibbit-30").init("S15");

setInterval(function(){
    var illuminationData = tibbit28.getData();
    var humidityData = tibbit30.getData();
    var pressureData = tibbit35.getData();
    var dateTime = new Date();

    console.log("Date/Time: "+dateTime);
    console.log("Illumination: "+illuminationData.illumination);
    console.log("Humidity: "+humidityData.humidity);
    console.log("Temperature: "+humidityData.temperature);
    console.log("Pressure: "+pressureData.pressure);
},1000);- Upload it to /environment folder and run:
$ node azure-app-0.js
    Date/Time: Tue Jul 19 2016 13:50:54 GMT+0000 (UTC)
    Illumination: 115
    Humidity: 43.755340576171875
    Temperature: 28.05670928955078
    Pressure: 738.7398681640625
Step 2: Setting Up Microsoft Azure IoT Hub
Microsoft Azure IoT Hub is a service that allows bi-directional communications between your devices and a solution back end. To complete this part of the tutorial you'll need:
- TPS device(s) prepared as shown on Step 0
- An active Azure account
- A PC with installed Node.js
Create an IoT Hub
- Sign in to the Azure Portal
- Choose New > Internet of Things > Azure IoT Hub
- Configure your IoT Hub, then click "Create".

- Wait a few minutes until your IoT Hub has been created then select All Resources > [name of your IoT hub] and click "Keys" icon.
- In the Shared access policies blade select the "iothubowner" item and then copy the value of "Connection string" field.

Step 3: Registering Device Identities
There are three ways to register device identities: with a script using Azure API, with GUI App (for Windows only) and with multiplatform CLI tool. The third way seems to be the most convenient one.
Note: To use iothub-explorer you need Node.js version 4.x or later installed.
- On your PC run:
npm install -g iothub-explorer@latest- Then:
$ iothub-explorer login <connection-string>
    Session started, expires Thu Jul 21 2016 13:22:10 GMT+0400
Where <connection-string> is an iothubowner connection string from Step 2.
- To register a new device and get its connection string:
$ iothub-explorer create <device-name> --connection-string
    Created device tps-centreville
    ...
    connectionString: HostName=iot-tps.azure-devices.net;DeviceId=tps-centreville;SharedAccessKey=fSCVQIY..TOprSsDE=
Where <device-name> is e.g. "tps-centreville".
- Make note of the connections string.
Step 4: Making Devices IoT-Enabled
- Connect with SSH to the TPS, change folder to /environment and do:
npm install azure-iot-device
npm install azure-iot-device-amqp- Create azure-app-1.js file with the following app:
var clientFromConnectionString = require('azure-iot-device-amqp').clientFromConnectionString;
var Message = require('azure-iot-device').Message;
var connectionString = '<THE DEVICE CONNECTION STRING FROM STEP 3>';
var client = clientFromConnectionString(connectionString);
var tibbit28 = require("@tibbo-tps/tibbit-28").init("S11");
var tibbit35 = require("@tibbo-tps/tibbit-35").init("S13");
var tibbit30 = require("@tibbo-tps/tibbit-30").init("S15");
client.open(function(err){
if(err){
    console.log('Could not connect: ' + err);
}else{
    console.log('Client connected');
    setInterval(function(){
        var illuminationData = tibbit28.getData();
        var humidityData = tibbit30.getData();
        var pressureData = tibbit35.getData();
        var time = new Date().toISOString();
        var data = JSON.stringify({
            deviceId: 'tps-centreville',
            humidity: humidityData.humidity,
            temperature: humidityData.temperature,
            pressure: pressureData.pressure,
            illumination: illuminationData.illumination,
            time: time
        });
        var message = new Message(data);
        client.sendEvent(message, function (err) {
            if(err){
                console.log(err.toString());
            }else{
                console.log("Message sent: " + message.getData());
            }
        });
    },60000)
}
});- Upload it to /opt/node-apps/environment folder on the TPS and run:
$ node azure-app-1.js
    Client connected
        Message sent: {"deviceId":"tps-centreville","humidity":37.1016960144043,"temperature":31.370407104492188,"pressure":742.8632202148438,"illumination":136,"time":"2016-07-21T10:19:07.490Z"}
        Message sent: {"deviceId":"tps-centreville","humidity":37.1016960144043,"temperature":31.370407104492188,"pressure":743.2034301757812,"illumination":137,"time":"2016-07-21T10:20:10.582Z"}
        Message sent: {"deviceId":"tps-centreville","humidity":37.1016960144043,"temperature":31.380477905273438,"pressure":743.2034301757812,"illumination":138,"time":"2016-07-21T10:21:12.003Z"}
Event monitoring is the most remarkable and very useful feature for the purpose of debugging iothub-explorer. With iot-explorer, you can easily observe events sent by your devices to cloud and vice versa.
Note: this command requires providing iothubowner connection string even if you're already logged in.
- On your PC do:
$ iothub-explorer <connection-string> monitor-events tps-centreville
    Monitoring events from device tps-centreville
    Event received:
        { deviceId: 'tps-centreville',
            humidity: 37.1016960144043,
            temperature: 31.380477905273438,
            pressure: 743.2034301757812,
            illumination: 138,
            time: '2016-07-21T10:21:12.003Z' }
You can see every event as soon as it's sent to IoT hub.
Step 5: Configure Stream Analytics
Note: To complete this part of the tutorial you'll need an active Microsoft Power BI subscription.
Before the information can be delivered to Power BI, it must be processed by a Azure Stream Analytics job.
- Choose New > Internet of Things > Stream Analytics Job
- Configure the Job, then click "Create"
- Wait a couple of minutes until the Job has been created, then select All resources > name of your Stream Analytics Job
- Click Inputs > Add
Set up input in the following way:
- Input alias : data-from-tps
- Source Type : Data stream
- Source : IoT Hub
- Subscription : Use IoT hub from current subscription
- Endpoint : Messaging
- Shared access policy name : iothubowner
- Consumer group : powerbi
- Click "Create"

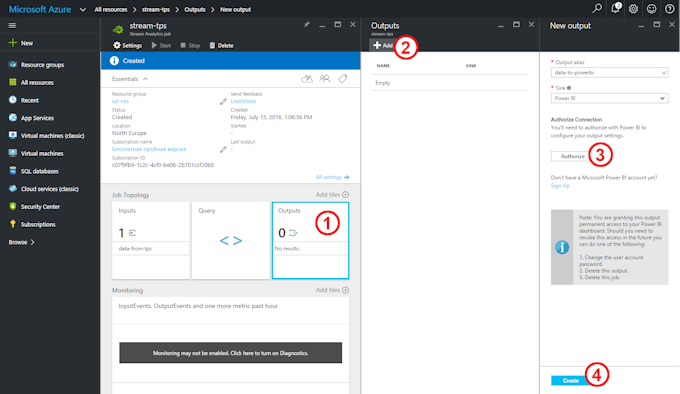
Set up output:
- Output alias : data-to-powerbi
- Click Outputs > Add
- Choose Power Bi as sink
- Click Authorize and enter your Power BI credentials in the appearing window
- Enter Dataset Name and Table Name, e.g. "telemetry" and "environment", respectively
- Click "Create"
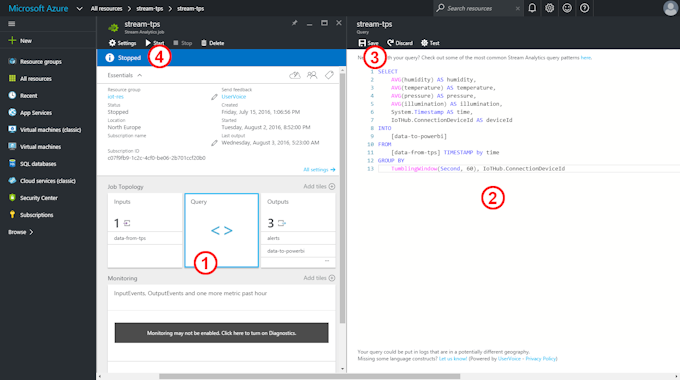
Now it's time to enter the query:
- Click Query
- Enter the following:
SELECT
    AVG(humidity) AS humidity,
    AVG(temperature) AS temperature,
    AVG(pressure) AS pressure,
    AVG(illumination) AS illumination,
    System.Timestamp AS time,
    IoTHub.ConnectionDeviceId AS deviceId
INTO
    [data-to-powerbi]
FROM
    [data-from-tps] TIMESTAMP by time
GROUP BY
TumblingWindow(Second, 60), IoTHub.ConnectionDeviceId- Click Save
Stream Analytics Query Language is a subset of SQL. Complete language documentation can be found here. There is also a very useful set of examples.
The query above, in short words, splits the timeline into 60-second periods and returns average values of humidity, temperature, pressure, and illumination for each period and each deviceld.
- Start your job
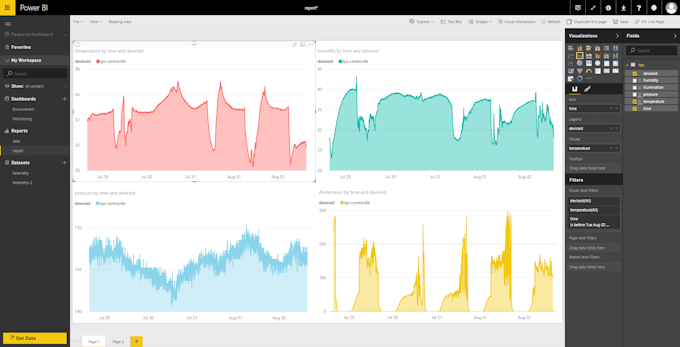
Step 6: Visualizing Your Data
Open your Power BI workspace. Soon after you started the Stream Analytics job, a new dataset appears in the Navigation Bar. Report creation should not be a great challenge. Use "time" as Axis, "deviceId" as Legend and temperature/humidity/illumination/pressure as Value.
Step 7: Adding Devices
- Register second device as described in Step 3.
- Upload and run code from Step 4 with modified connectionString value.
In a short time, the second curve appears in the report.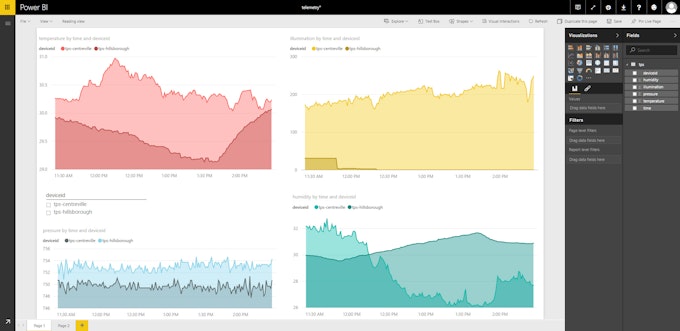
Opinions expressed by DZone contributors are their own.
Comments