Toward Explainable AI (Part 5): Bridging Theory and Practice—A Hands-On Introduction to LIME
Explainable AI bridges the gap between complex models and real-world accountability, helping teams build trust, ensure compliance, and make smarter decisions.
Join the DZone community and get the full member experience.
Join For FreeSeries reminder: This series explores how explainability in AI helps build trust, ensure accountability, and align with real-world needs, from foundational principles to practical use cases.
Previously, in Part IV: Beyond Explainability: What Else Is Needed: Governance, limits, and the need for operational frameworks.
In this Part: We shift from theory to practice with a medical use case: using LIME to explain predictions from a deep learning model detecting pneumonia in X-ray images.
Section II - Putting Explainability Into Practice
1. Introduction: Bridging Theory and Practice
The challenges of explainable AI can only be fully understood through hands-on experimentation.
This second part provides a transition from theory to practice through two emblematic use cases of explainable AI.
- The first explores a deep learning model that detects pneumonia from chest X-rays, using the LIME method.
- The second analyzes a credit scoring model based on the German Credit dataset, using SHAP to explain decisions at both the global and individual levels.
These cases aim to show how explainability tools can concretely help build trust, assess bias, and make AI more transparent and accountable.
While this document focuses on applying explainability techniques to classical machine learning models such as CNNs and gradient boosting, it is important to acknowledge that generative AI models (including large language models and multimodal architectures) introduce unique challenges for explainability that remain largely an open research area.
These models raise issues of qualitative interpretability, traceability of embedded knowledge, and management of hallucinations. Current methods like LIME and SHAP may not fully address these complexities.
Although these topics are beyond the scope of this document, they represent a critical frontier in the field of explainable AI.
2. Applying LIME to Medical Imaging: Detecting Pneumonia
Understanding LIME
LIME (Local Interpretable Model-agnostic Explanations) is a method designed to make the decisions of complex models more understandable by generating local explanations. Its principle is based on a simple yet powerful idea: instead of trying to explain the model globally, LIME focuses on the prediction for a specific case.
To do this, the method artificially generates new observations that are close to the instance being explained. For example, if one wants to understand a model’s prediction for a given patient, LIME creates many slightly modified versions of that patient’s data by changing variables such as age, income, or other features. These synthetic data points are then passed through the model to observe how its predictions change in response to these small variations. LIME then uses the results to fit a simple and interpretable model, such as a linear regression, which provides a local approximation of the original model. This simplified model makes it easier to identify which factors most influenced the decision, in a way that is more accessible to humans.
LIME offers several advantages: it is independent of the underlying model type, adapts to various techniques such as neural networks, random forests, or boosting models, and generally produces fast and intuitive explanations. However, it also has limitations: its results can be unstable from one run to another, depend on appropriate parameter tuning, and do not always guarantee perfect fidelity to the original model.
Explainability in Healthcare: Applying LIME
To illustrate the practical value of LIME, we applied it to a use case in the medical field. We worked with a deep learning model trained to detect cases of pneumonia from chest X-ray images. The model achieved strong performance overall, though its decision process remained difficult to interpret, particularly regarding which specific areas of the images it relied on to make its diagnoses. This is precisely where LIME addresses the interpretability gap: the method allows for the visualization, for each prediction, of the regions of the image that most influenced the model’s decision. The objective is twofold: to verify whether these explanations are medically meaningful, and to assess whether they can help strengthen healthcare professionals' trust in the decisions made by the algorithm.
Data Loading and Preprocessing
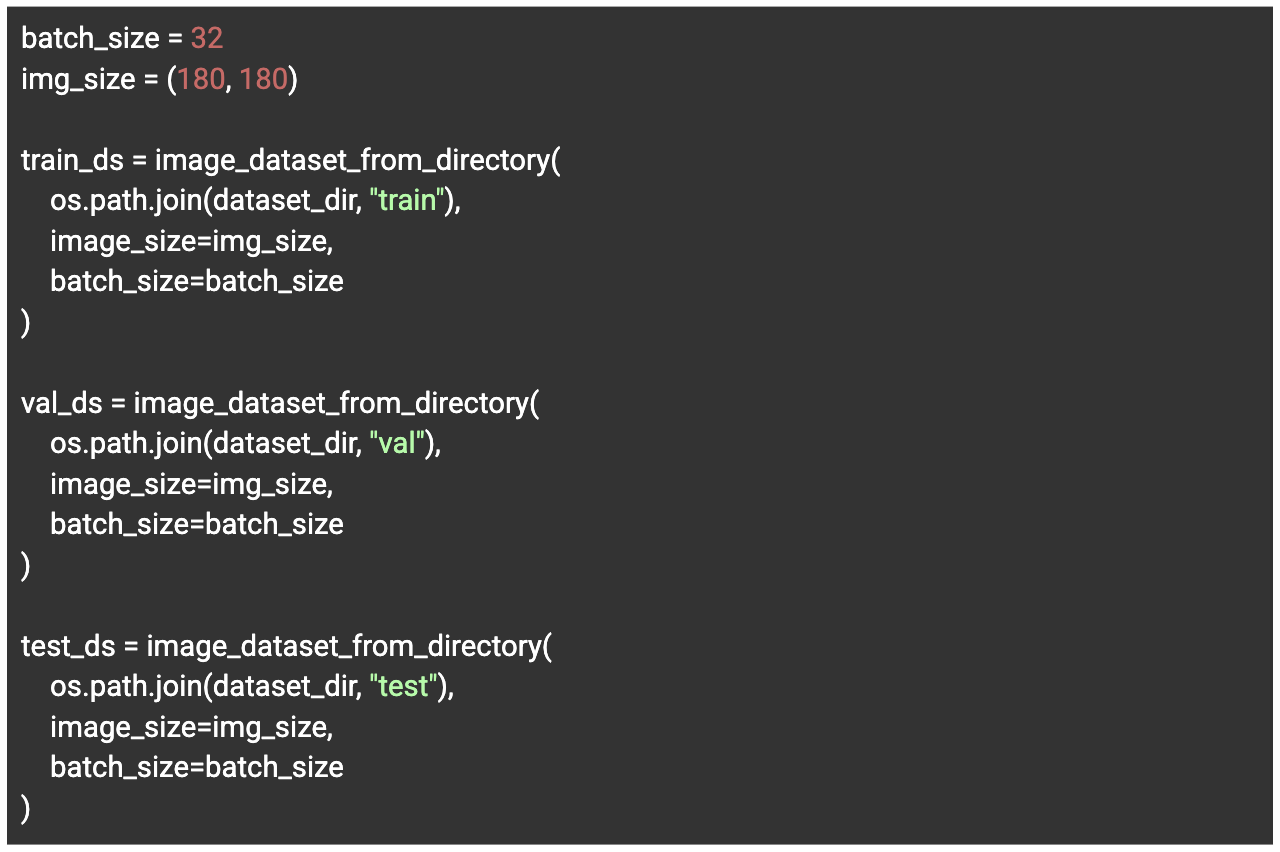
First, we import the Chest X-Ray Images (Pneumonia), dataset, which contains 5,863 chest X-ray images classified into two categories: “Normal” and “Pneumonia.” The dataset is organized into three separate subsets :
- Training set (train): used to teach the model how to distinguish pneumonia cases from normal ones.
- Validation set (val): used to tune hyperparameters and prevent overfitting
Test set (test): used to evaluate the model’s final performance on unseen data.


After loading the data, we perform preprocessing, during which we also apply data augmentation techniques such as flipping, rotation, zooming, and contrast adjustment. These transformations help simulate the variability of chest X-rays and improve the model’s robustness during training.

Model Training and Evaluation
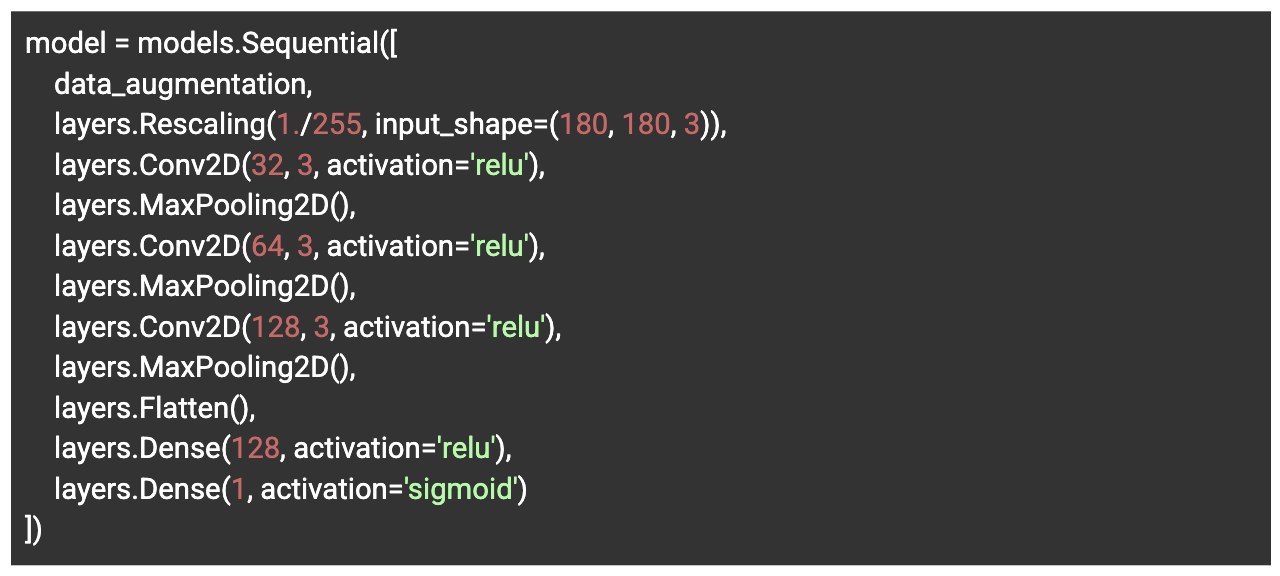
We then define a binary classification model based on a convolutional neural network (CNN), simple yet effective. It consists of three convolutional blocks followed by pooling layers, then a flattening layer and two dense layers. The final layer uses a sigmoid activation function to produce the probability that a given X-ray indicates pneumonia.
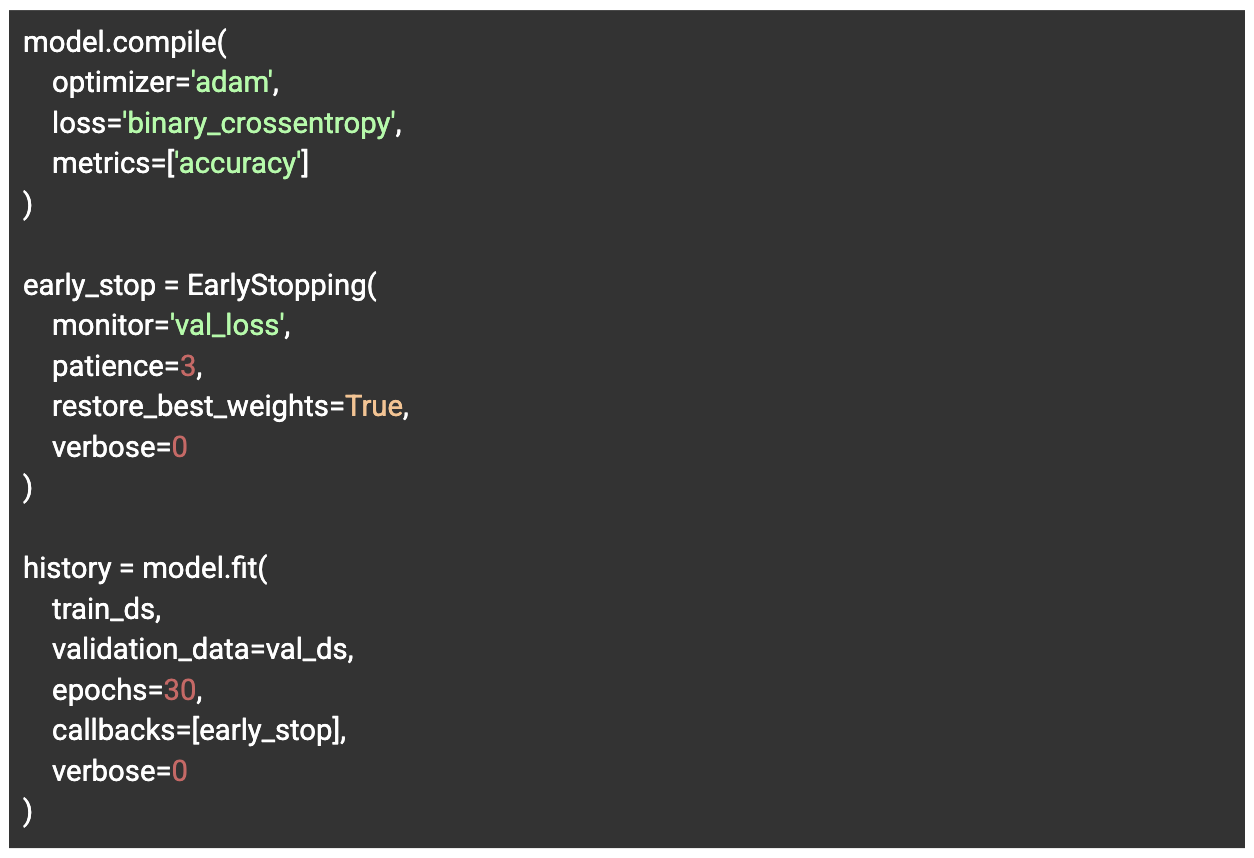
The model is compiled using the Adam optimizer and the binary_crossentropy loss function. Training is carried out over 30 epochs, with an early stopping mechanism that halts learning if performance on the validation set stops improving.
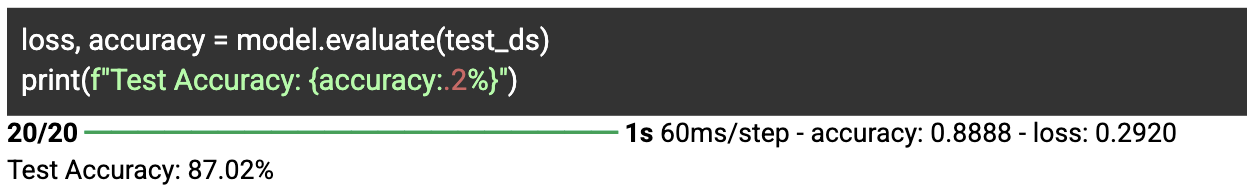
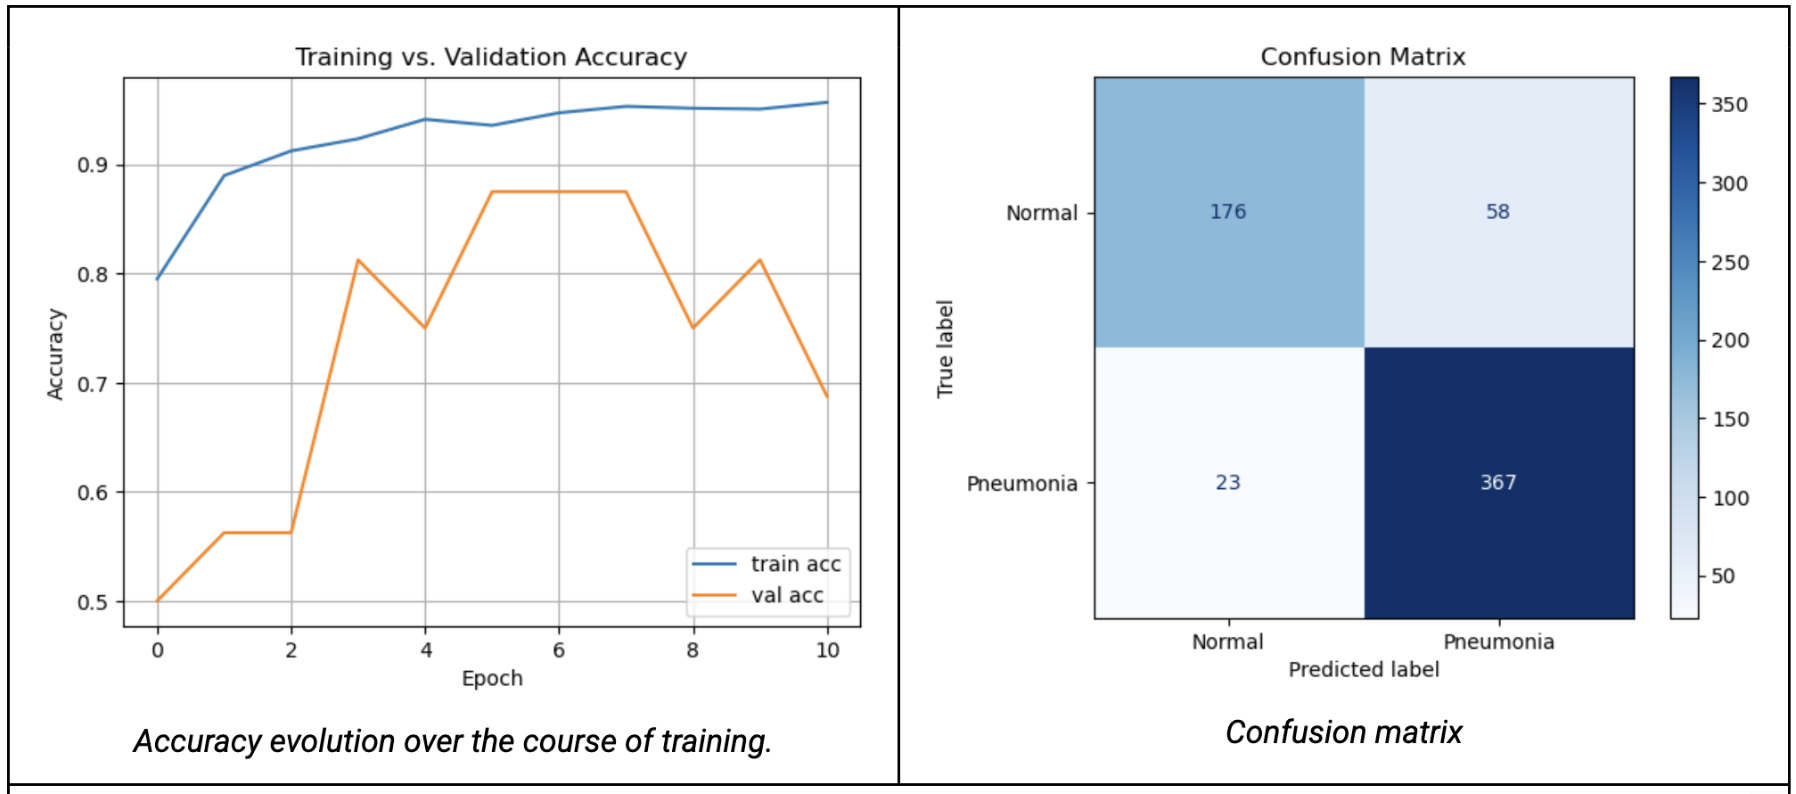
Once the model has been trained, we evaluate it on the test set to assess its ability to generalize to unseen data. The resulting score shows an accuracy of 87.02%, indicating that the model is able to distinguish pneumonia cases with a good level of performance.
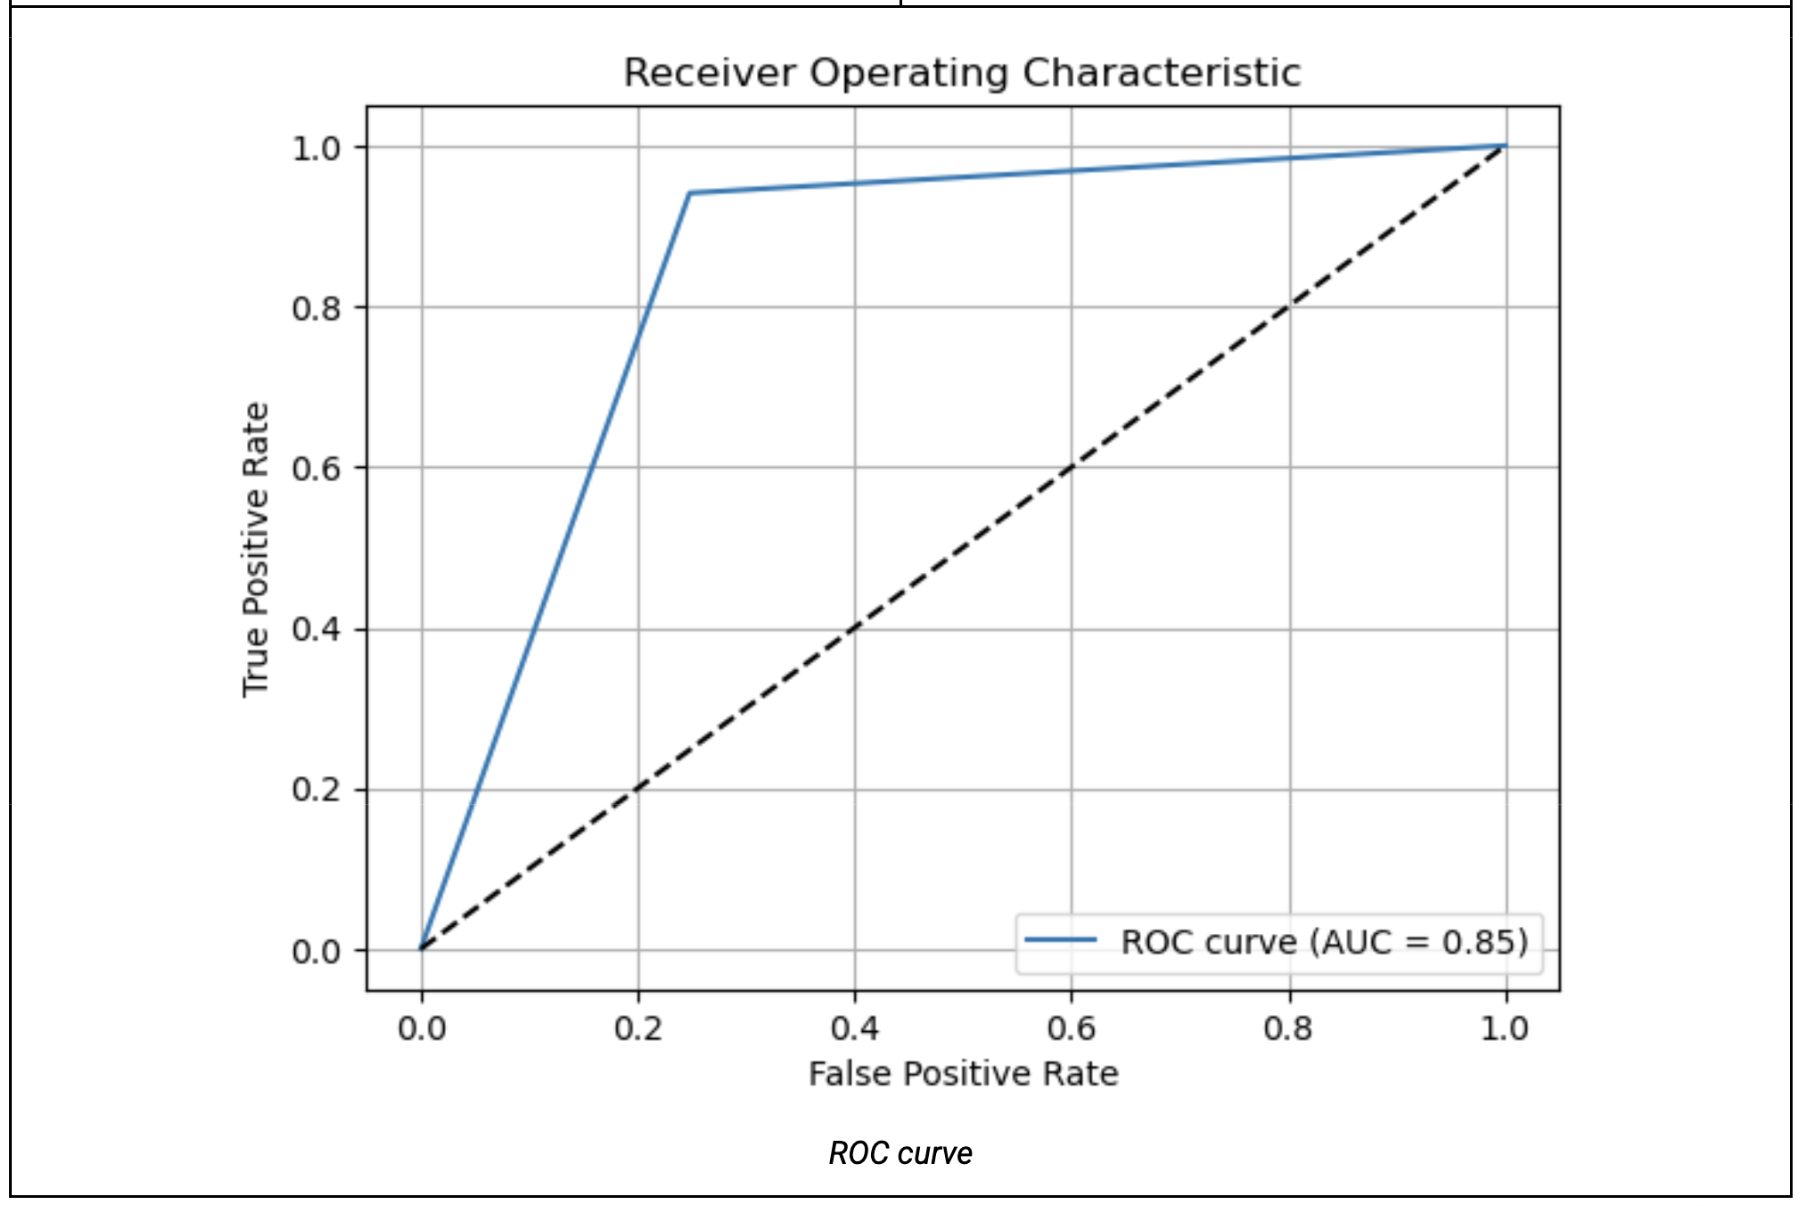
To assess our model’s performance more thoroughly, we use several standard visualizations for binary classification. First, we visualize the evolution of accuracy on the training and validation sets across epochs, in order to verify that the model converges properly without overfitting. We then generate the confusion matrix, which helps identify the most frequent types of errors, particularly false positives and false negatives. Finally, we visualize the ROC curve and compute the area under the curve (AUC) to measure the model’s ability to distinguish between the two classes, regardless of the decision threshold used.
Links to the previous articles published in this series:
- Toward Explainable AI (Part I): Bridging Theory and Practice—Why AI Needs to Be Explainable
- Toward Explainable AI (Part 2): Bridging Theory and Practice—The Two Major Categories of Explainable AI Techniques
- Toward Explainable AI (Part 3): Bridging Theory and Practice—When Explaining AI Is No Longer a Choice
- Toward Explainable AI (Part 4): Bridging Theory and Practice—Beyond Explainability, What Else Is Needed
Glossary
Algorithmic Bias: Systematic and unfair discrimination in AI outcomes caused by prejudices embedded in training data, model design, or deployment processes, which can lead to disparate impacts on certain population groups. Detecting and mitigating algorithmic bias is a key objective of explainable AI.
Bias Detection (via XAI): Use of explainability methods to identify biases or disproportionate effects in algorithmic decisions.
Contrastive and Counterfactual Explanations: Explanations that compare the decision made to what could have happened by changing certain variables (e.g., “Why this outcome instead of another?”).
Decision Plot: A graphical representation tracing the successive impact of variables on an individual prediction.
Evaluation Metrics for Explainability: Criteria used to assess the quality of an explanation (fidelity, robustness, consistency, etc.).
Feature Importance (Variable Contribution): Measurement or attribution of the relative impact of each variable on the model’s final decision.
Force Chart (Force Plot): An interactive visualization illustrating positive or negative forces exerted by each variable on a prediction.
Fidelity: A measure of how faithfully the explanation reflects the true logic of the model.
Global Explanation: An overview of the model’s behavior across the entire dataset.
Human Interpretability: The quality of an explanation to be understood and useful to a human, non-expert user.
Intrinsically Interpretable Models: Models whose very structure allows direct understanding (e.g., decision trees, linear regressions).
LIME (Local Interpretable Model-agnostic Explanations): A local explanation method that generates simple approximations around a given prediction to reveal the influential factors.
Local Explanation: A detailed explanation regarding a single prediction or individual case.
Model Transparency: The quality of a model in making its decision-making processes accessible and understandable.
Post-hoc Explainability: Explainability techniques applied after model training, without altering its internal functioning.
Robustness (Stability): The ability of an explainability method to provide consistent explanations despite small variations in input data.
SHAP (SHapley Additive exPlanations): An approach based on game theory that assigns each variable a quantitative contribution to the prediction, providing both global and local explanations.
Summary Chart (Summary Plot): A visualization ranking variables according to their average influence on predictions.
Waterfall Chart: A static visualization showing step by step how each variable contributes to the final prediction.
References
1. LIME: [link]
2. Chest X-Ray Images (Pneumonia): [link]
3. German Credit Dataset: [link]
4. Complete notebook for the LIME case study: [link]
5. Complete notebook for the SHAP case study: [link]
6. Leslie, D., Rincón, C., Briggs, M., Perini, A., Jayadeva, S., Borda, A., et al. (2024). AI Explainability in Practice, The Alan Turing Institute, AI Ethics and Governance in Practice Programme. Participant & Facilitator Workbook. https://www.turing.ac.uk/sites/default/files/2024-06/aieg-ati-7-explainabilityv1.2.pdf
7. AI explainability in practice. (2024). The Alan Turing Institute. https://www.turing.ac.uk/sites/default/files/2024-06/aieg-ati-7-explainabilityv1.2.pdf
8. What is AI (artificial intelligence)? (2024, April 3). McKinsey & Company. https://www.mckinsey.com/featured-insights/mckinsey-explainers/what-is-ai
9. Kite-Powell, J. (2022, July 28). Explainable AI is trending and here’s why. Forbes. https://www.forbes.com/sites/jenniferhicks/2022/07/28/explainable-ai-is--trending-and-heres-why
10. Excellence and Trust in AI — Brochure. (n.d.). Shaping Europe’s Digital Future. https://digital-strategy.ec.europa.eu/en/library/excellence-and-trust-ai-brochure
11. Heikkilä, M. (2024, March 6). Nobody knows how AI works. MIT Technology Review. https://www.technologyreview.com/2024/03/05/1089449/nobody-knows-how-ai-works/
12. Heaven, W. D. (2025, July 30). Large language models can do jaw-dropping things. But nobody knows exactly why. MIT Technology Review. https://www.technologyreview.com/2024/03/04/1089403/large-language-models-amazing-but-nobody-knows-why/
13. Francis, J. (2024, November 15). Council Post: Why 85% of your AI models may fail. Forbes. https://www.forbes.com/councils/forbestechcouncil/2024/11/15/why-85-of-your-ai-models-may-fail
14. Bao, A., & Zeng, Y. (2024). Understanding the dilemma of explainable artificial intelligence: a proposal for a ritual dialog framework. Humanities and Social Sciences Communications, 11(1). https://doi.org/10.1057/s41599-024-02759-2
15. Gallese, C. (2023). The AI Act proposal: a new right to technical interpretability? arXiv (Cornell University). https://doi.org/10.48550/arxiv.2303.17558
16. GALDON CLAVELL, G. (n.d.). AI Auditing - Checklist for AI auditing. In SUPPORT POOL OF EXPERTS PROGRAMME. https://www.edpb.europa.eu/system/files/2024-06/ai-auditing_checklist-for-ai-auditing-scores_edpb-spe-programme_en.pdf
17. White, B., & Guha, K. (2025, June 14). Component based Quantum Machine Learning explainability. arXiv.org. https://arxiv.org/abs/2506.12378
Opinions expressed by DZone contributors are their own.
Comments