Exploring the Java ‘hs_err_pid’ File
In this post, we’re about to unravel the enigma of this file. We’ll delve into its purpose, learn how to decipher its contents and explore its vital information.
Join the DZone community and get the full member experience.
Join For FreeHave you ever wondered what happens when the Java Virtual Machine (JVM) encounters a critical error and crashes unexpectedly? Well, that’s when the JVM generates a mysterious file called ‘hs_err_pid.’ In this post, we’re about to unravel the enigma of this file. We’ll delve into its purpose, learn how to decipher its contents, and explore the vital information it provides when your Java application goes awry. So, if you’ve ever been perplexed by the ‘hs_err_pid’ file, or if you’re simply curious about how to make sense of it, read on to discover the key insights you need.
What Is the ‘hs_err_pid’ File?
When the Java Virtual Machine (JVM) encounters a severe error and crashes, it leaves behind a trail of breadcrumbs in the form of an ‘hs_err_pid’ file. This file is a goldmine of information containing details at various levels, such as thread, library, application, resource, environment, and system. It serves as a comprehensive report of the JVM’s state at the moment of the crash. These details can be invaluable for diagnosing the cause of the crash.
Where Is the ‘hs_err_pid’ File Created?
When the JVM crashes, the ‘hs_err_pid’ file’s location is determined as follows:
- -XX:ErrorFile: If the JVM argument ‘-XX:ErrorFile’ is specified, the ‘hs_err_pid‘ file will be created in the path specified by this argument.
- Working Directory: In cases where the ‘-XX:ErrorFile’ argument is not used, the JVM generates the ‘hs_err_pid‘ file in the working directory of the Java application.
- Temporary Directory: If, for any reason, the file cannot be created in the working directory (e.g., due to insufficient space, permission issues, or other constraints), the JVM resorts to creating the ‘hs_err_pid’ file in the temporary directory designated by the operating system.
How To Read the ‘hs_err_pid’ File?
The ‘hs_err_pid’ file is a plain text document, and while it is possible to access and inspect its contents by opening it with a standard text editor, interpreting the raw data within the file can be a challenging task due to its technical nature. In many cases, deciphering the file in its raw format can be complex and time-consuming.
To simplify the process and make the information more accessible, many developers opt to use specialized tools like fastThread. This tool is designed to parse ‘hs_err_pid’ files and presents the data in a more readable and organized format, complete with graphs and metrics.
How Do You Analyze the ‘hs_err_pid’ File?
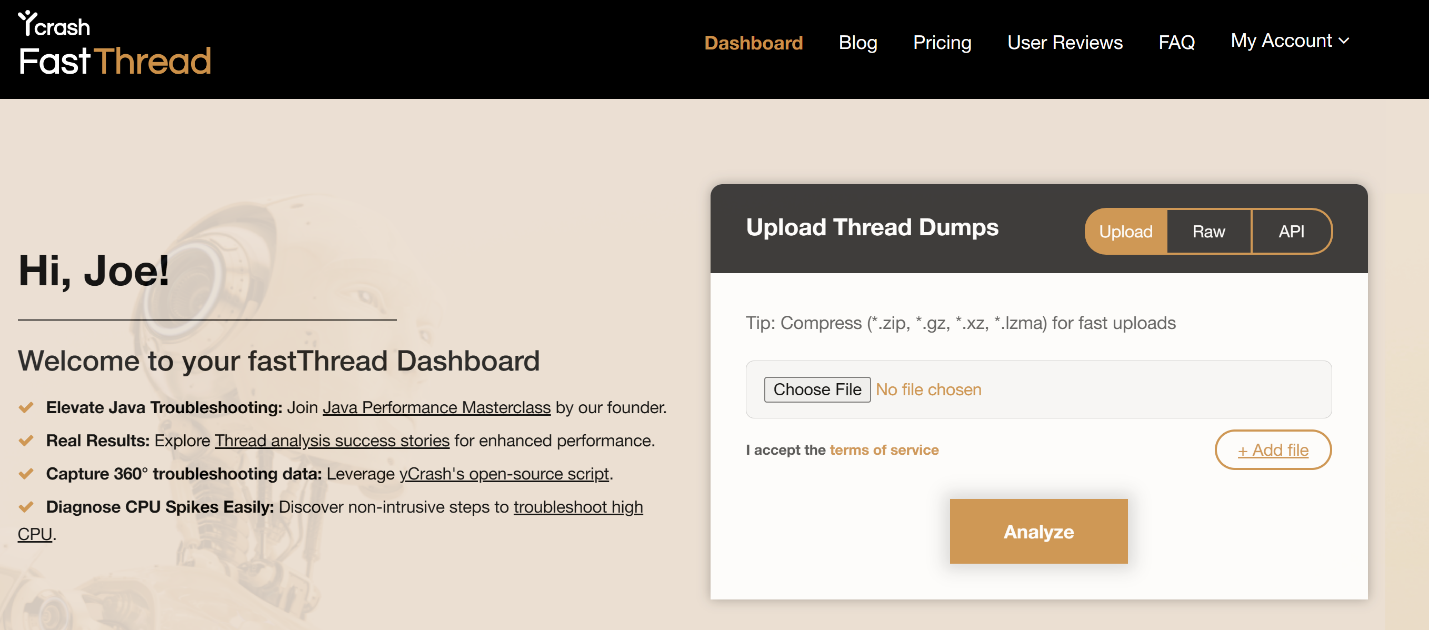
Fig: fastThread tool to analyze hs_err_pid file
You can analyze the ‘hs_err_pid’ file using the fastThread tool.
- Sign In to fastThread
- Upload the hs_err_pid file
- Click on the Analyze button
Upon completing these steps, fastThread will instantly generate a comprehensive report. This report is designed to provide you with a wealth of information. It includes multiple sections that will help you gain a deep understanding of the JVM issue. Continue reading this post to learn about these sections.
JVM Information
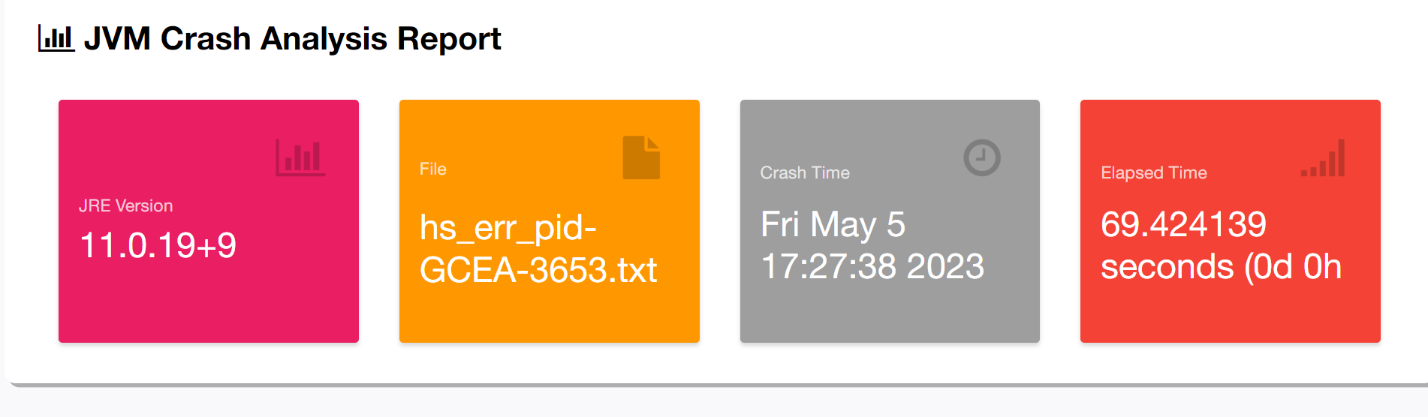
Fig: JVM version information
The first section of the report is dedicated to providing key details about the Java Virtual Machine (JVM). It encompasses:
- JRE Version: This section reveals the Java Runtime Environment (JRE) version in use at the time of the JVM crash.
- Crash Time: You’ll find the precise date and time when the JVM encountered a critical error and crashed.
- Elapsed Time: This valuable metric indicates how long the JVM was operational before the crash occurred.
Reason To Crash

Fig: High-Level Reason for JVM to crash
In this section, you’ll find a high-level reason that led to the JVM crash. Common crash reasons include:
- SIGSEGV
- SIGBUS
- EXCEPTION_ACCESS_VIOLATION
- EXCEPTION_STACK_OVERFLOW
- Out of Memory Error
For explanations of these reasons, you can refer to this Oracle documentation.
Heap Size
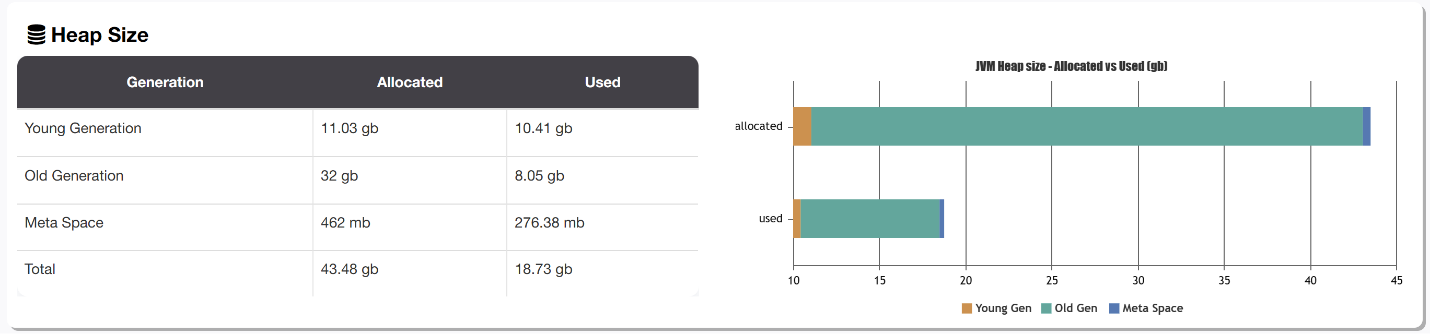
Fig: JVM Memory regions utilization
This section provides a breakdown of the allocated and consumed memory of the JVM’s internal memory regions:
- Young Gen
- Old Gen
- MetaSpace
Understanding the allocated and used sizes of these memory regions is essential for diagnosing issues related to memory consumption. In the case of memory leaks, you may observe the used size approaching its maximum capacity.
Executed Code/Library
In this section, you will find the exact line of code or library that your JVM was executing when the crash occurred. The following are a few examples:
Line of Code
# J 11538 C2 com.buggyapp.StoryContentPushProcessor.scribeUpsert(Lcom/espn/cricket/data/domain/StoryType;Ljava/nio/file/Path;)V (224 bytes) @ 0x0000000002629d49 [0x0000000002626ce0+0x3069]# J 17883 c2 java.util.concurrent.ConcurrentSkipListMap.doPut(Ljava/lang/Object;Ljava/lang/Object;Z)Ljava/lang/Object; [email protected] (548 bytes) @ 0x00007fe0bd97e957 [0x00007fe0bd97b740+0x0000000000003217]
Libraries
- [jvm.dll+0x374bae]
- [libCSTBk5.so+0x43949]
Active Thread
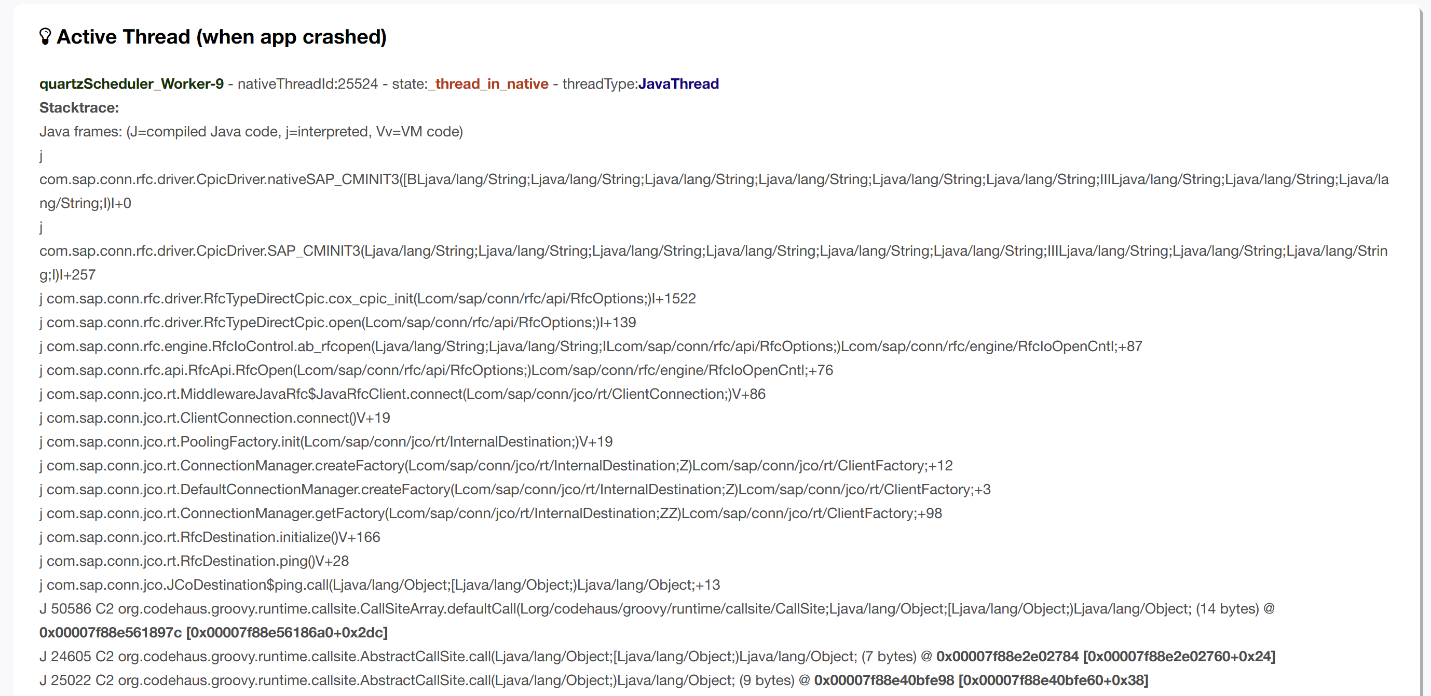
Fig: Active Thread’s stack trace
This section is probably the most important section in the report as it reveals the thread that was actively executing at the precise moment of the JVM crash, along with its accompanying stack trace. In many instances, the thread actively executing at the time of the crash is a key focal point for identifying the root cause.
In the above example, you can notice that the thread is working on the ‘com.sap.conn.rfc.driver’ package. This package is present in a SAP driver library. Apparently, this application was running on an old version of SAP driver, known to have bugs. Due to this, this application crashed. Once the SAP drivers were upgraded, the JVM crashes within the application ceased.
Core Dump Location
In the event of a JVM crash, core dumps may be generated. This section informs you about the specific file path where these core dumps are written.
All Threads
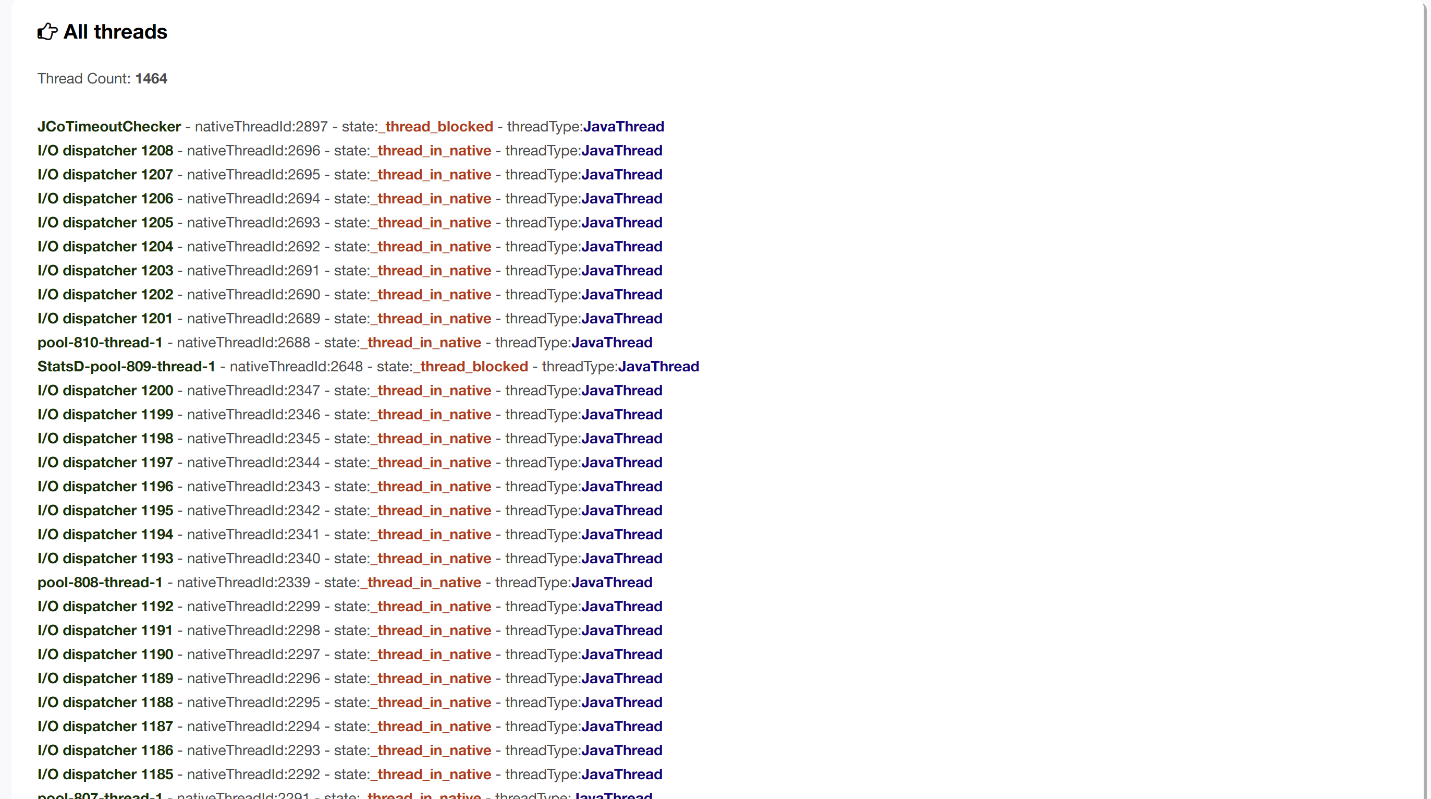
Fig: All Threads running in JVM at the time of crash
This section offers insights into the threads within the JVM at the time of the crash. It includes details on the number of threads, their names, states, and types. The number of threads in the JVM can be a critical factor to consider, and in the provided example, there were 1464 threads, which is notably high for the application in question.
The names of the threads often provide valuable clues regarding their origin or association with specific thread pools. For instance, in this example, you can observe that there were over a thousand threads originating from the ‘I/O dispatcher’ thread pool. Understanding the thread landscape can be helpful in diagnosing performance and concurrency issues within your Java application.
JVM Arguments
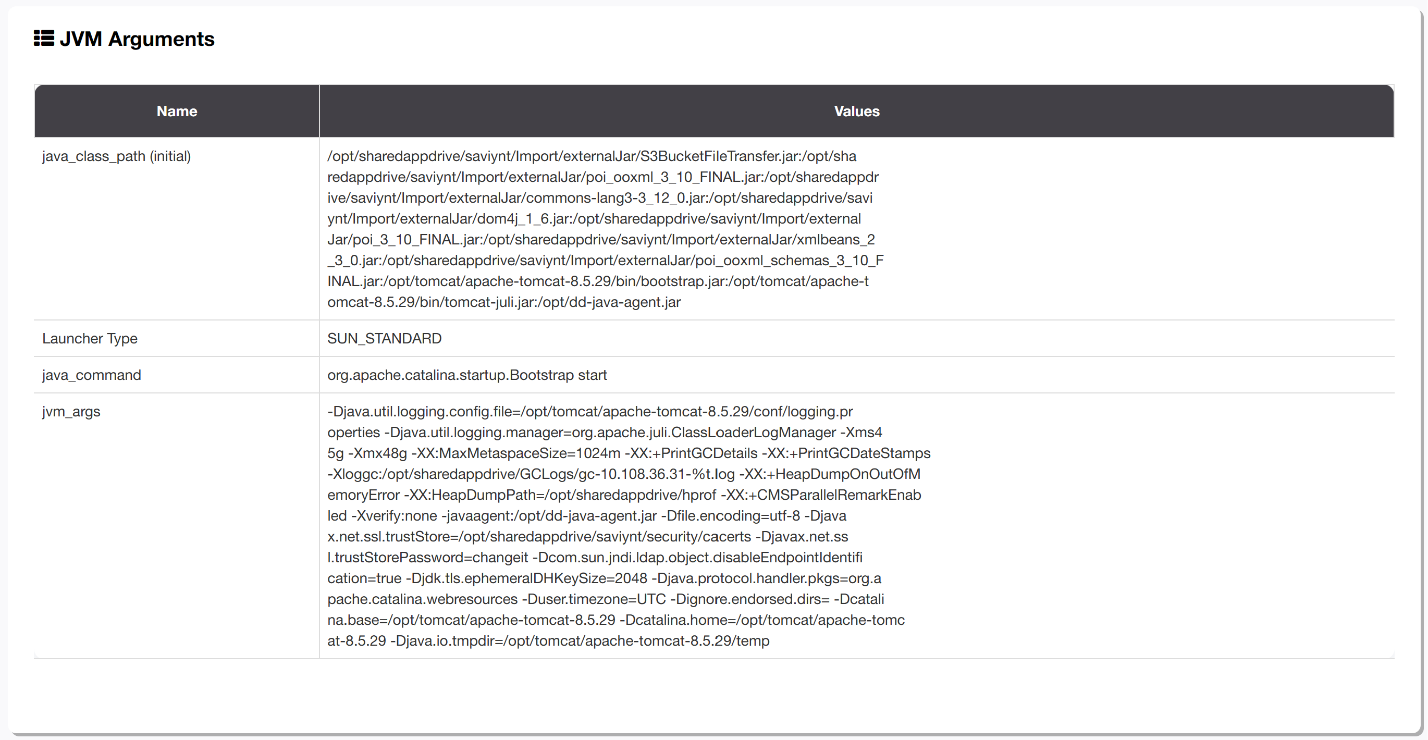
Fig: JVM arguments with the application were launched
This section reveals the System properties (i.e., ‘D’) and JVM arguments (-i.e. -‘X’ and ‘-XX:’) with which your application was launched.
Environment Variables
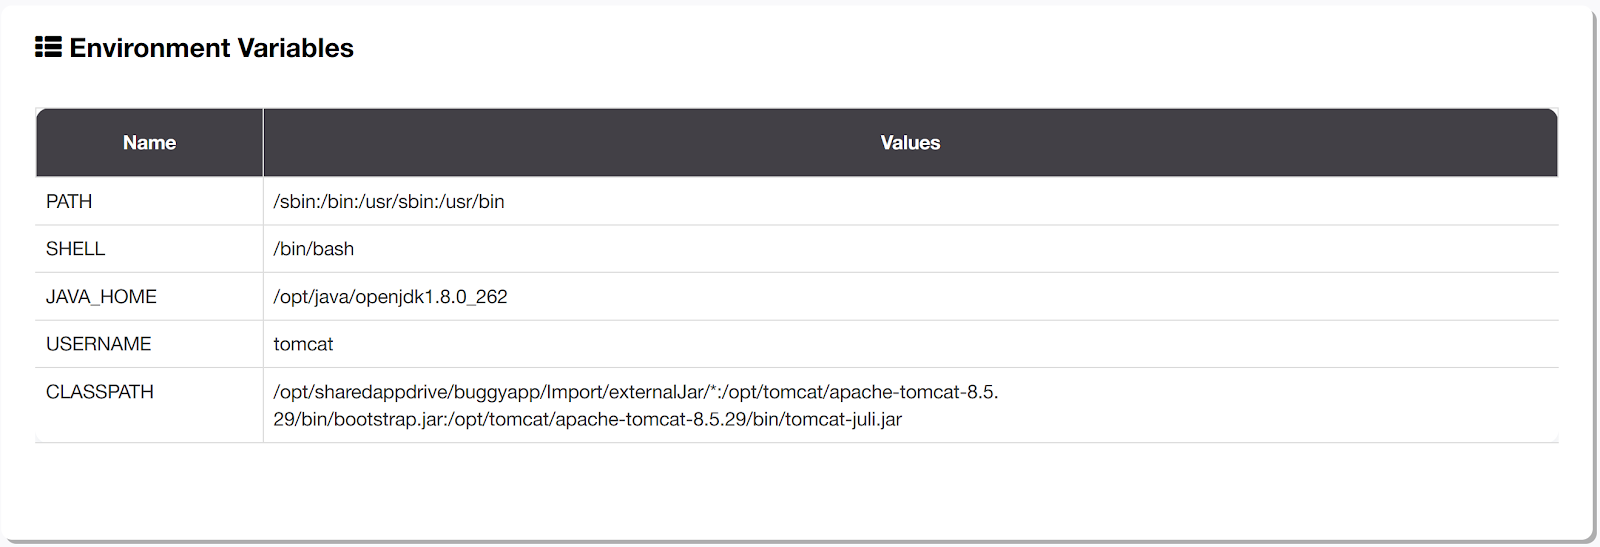
Fig: Environment Variables of the device
This section contains a comprehensive list of the environment variables that were in effect when the JVM was launched. These variables can include critical elements like ‘PATH,’ ‘SHELL,’ ‘JAVA_HOME,’ ‘CLASSPATH,' and more. Understanding the environment variables is essential for assessing the context in which your Java application operates.
Dynamic Libraries
This section presents a complete list of all the libraries and dependencies, including application libraries, 3rd party libraries, frameworks, and native libraries, with which your Java application was launched. The inventory includes a diverse range of components, such as dynamic libraries (.dll), shared objects (.so), and Java archives (*.jar).
System
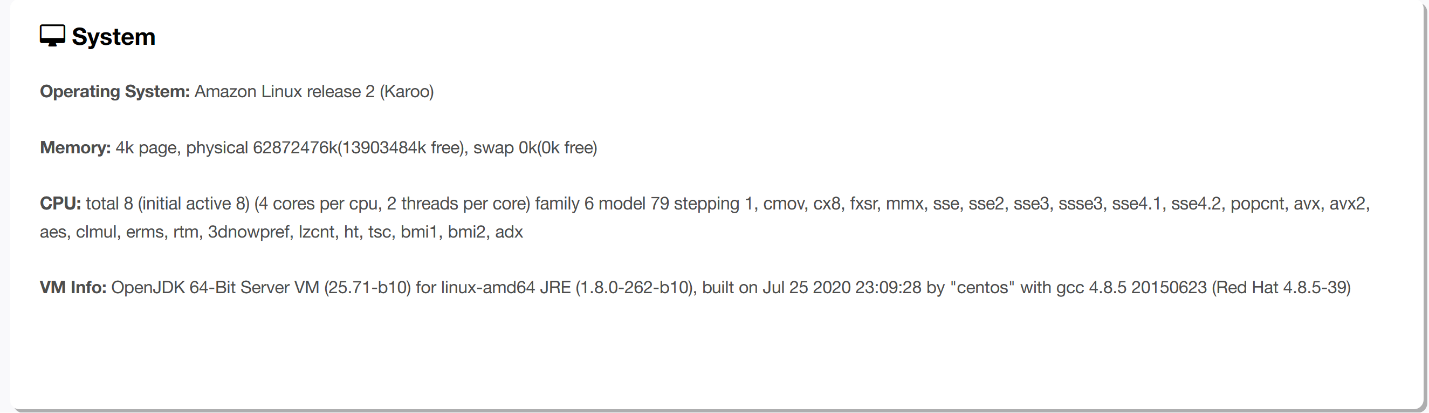
Fig: System-level details
This section provides system-level details pertaining to your application:
- Operating System: It provides detailed information about the operating system on which your application was running.
- Memory: This section covers the memory configuration of the device where your application was executed. It also reports memory utilization at the time of the crash, providing insights into resource consumption.
- CPU: You’ll find information about the CPU configuration of the device where your application was running, which can be instrumental in assessing performance and compatibility.
- JVM Version: This part of the report discloses the JVM version in use, which is critical for compatibility and debugging.
Events Info
The events Info section of the report contains the following subsections:
- Internal exceptions: Most recent exceptions that are thrown in JVM are reported here.
- DeOptimization events: Sometimes, JVM converts compiled (or more optimized) stack frames into interpreted (or less optimized) stack frames. Example: A compiler initially assumes a reference value is never null and tests for it using a trapping memory access. Later on, the application uses null values, and the method is deoptimized and recompiled to use an explicit test-and-branch idiom to detect such nulls. Most recent such deoptimized events are reported in this section.
- Class redefined: Most recent classes that are redefined are reported in this section. Sometimes, classes get redefined by the APM agents and by other agent technologies.
- Compilation events: Shows which methods have been recently compiled from Java bytecode to native code.
Conclusion
In this exploration of the ‘hs_err_pid’ file in Java, we’ve delved into a valuable source of information that can be the key to diagnosing JVM crashes. By decoding the ‘hs_err_pid’ file, you can transform error messages into actionable insights, making troubleshooting a smoother journey than it needs to be.
Published at DZone with permission of Ram Lakshmanan. See the original article here.
Opinions expressed by DZone contributors are their own.
Comments