

Exposing SonarQube Metrics to Grafana
Follow this tutorial in order to learn how to show SonarQube metrics such as code coverage, number of lines, etc. in the Grafana dashboard.
Join the DZone community and get the full member experience.
Join For FreeThere may be cases when we want to show measures of a metric of the Sonarqube into the Grafana dashboard. Here, we are going to one simple way to expose the Sonarqube metrics data to the Grafana dashboard using SpringBoot.
Following software are required for this tutorial:
- SonarQube
- Grafana ( with SimpleJson plugin )
- An IDE for creating REST endpoints ( using SpringBoot)
This tutorial is divided into 3 sections:
- Analyze a project on SonarQube
- Create REST endpoints required for the SimpleJson plugin
- Create a Grafana dashboard.
1. Analyse a Project on SonarQube
SonarQube is an open-source platform developed by SonarSource for continuous inspection of code quality to perform automatic reviews with static analysis of code to detect bugs, code smells, and security vulnerabilities on 20+ programming languages.
You can follow the steps under Analyse a Project section from the following link:
https://docs.sonarqube.org/latest/setup/get-started-2-minutes/
If you did not get Code Coverage metrics using this approach, you need to use plugins that generate coverage reports. Some such plugins are Jacoco, Cobertura, etc. Here, we are using the Jacoco plugin. You can add the Jacoco plugin in maven as below —
<plugin>
<groupId>org.jacoco</groupId>
<artifactId>jacoco-maven-plugin</artifactId>
<version>0.8.5</version>
<executions>
<execution>
<id>report</id>
<goals>
<goal>prepare-agent</goal>
<goal>report</goal>
</goals>
</execution>
</executions>
</plugin>
If required you can also include the following plugin —
xxxxxxxxxx
<plugin>
<groupId>org.apache.maven.plugins</groupId>
<artifactId>maven-surefire-plugin</artifactId>
</plugin>
Run the maven command with goal including "clean install" along with the sonar maven command (provided while creating a project for analysis in Sonarqube).
2. Create REST Endpoints Required for SimpleJson Plugin
In this step, we are creating REST endpoints required for SimpleJson plugin. These endpoints can be created in any backend technologies like SpringBoot, Node, etc. Here, we are using SpringBoot to create REST endpoints, you can use other technologies also. Following link provide details about SimpleJson plugin of Grafana. References for other technologies are also provided in the link.
https://grafana.com/grafana/plugins/grafana-simple-json-datasource
Create following endpoints which are being used by SimpleJson plugin during multiple phases:
- "/" — should return 200 ok. Used for "Test connection" on the datasource config page.
- "/search" — used by the find metric options on the query tab in panels. Here, we provide various Sonarqube metrics such as nloc, complexity, coverage, etc.
- "/query" — should return metrics based on input. Here we are returning Sonarqube measures (data) for metric (passed on Query tab) based on time range.
- "/annotation" — should return annotation. Here, I have provided simple dummy implementation.
You can also implement other two optional REST endpoints:
- "/tag-keys" — should return tag keys for ad hoc filters.
- "/tag-values" — should return tag values for ad hoc filters.
Here, is the link of my repository where I have implemented these endpoints.
https://github.com/35mohitgupta/grafana-rest-sonar-connection
NOTE: I am providing a simple implementation with minimum code. Like, I have provided empty implementation of endpoints like "/", "/tag-keys", etc., hard-coded implementations, just to make understanding the concept simpler and easy. Also I have created a "/test" endpoints just for testing the response data, you can ignore this endpoint. I have implemented only time-series type, not table type, as my goal is to display metrics in form of a graph, not in a table.
Following is the controller class for the REST endpoint implementation:
x
public class SonarAPIController {
private SonarApiService sonarApiService;
("/")
public ResponseEntity<String> testDataSourceConnection(){
System.out.println(">>>>>> testing datasource connection-\n");
return new ResponseEntity<String>("Test connection established",HttpStatus.OK);
}
("/search")
public ResponseEntity<List<String>> getMetrics( JSONObject request){
System.out.println(">>>>>> getting metrics -\n"+request);
List<String> metrics = Arrays.asList("coverage","new_violations","ncloc");
return new ResponseEntity<List<String>>(metrics, HttpStatus.OK);
}
("/annotations")
public ResponseEntity<List<String>> getAnnotations( AnnotationRequest request){
System.out.println(">>>>>> getting annotation -\n"+request);
List<String> metrics = Arrays.asList("coverage","new_violations","ncloc","complexity");
return new ResponseEntity<List<String>>(metrics, HttpStatus.OK);
}
("/query")
public ResponseEntity<List<Object>> query( QueryRequest request){
System.out.println(">>>>>> querying -\n"+request);
List<Object> response = new ArrayList<Object>();
Range range = request.getRange();
for(Target target: request.getTargets()) {
String metric = target.getTarget();
QueryType type = target.getType();
if(type == QueryType.timeserie) {
List<List<Object>> datapoints = sonarApiService.getDataPoint(range, metric);
System.out.println("datapoints - "+datapoints);
TimeserieQueryResponse timeQuery = new TimeserieQueryResponse();
timeQuery.setDatapoints(datapoints);
timeQuery.setTarget(metric);
response.add(timeQuery);
}else {
TableQueryResponse tableQuery = new TableQueryResponse();
response.add(tableQuery);
}
}
return new ResponseEntity<List<Object>>(response, HttpStatus.OK);
}
("/tag-keys")
public List<TagKeysResponse> getTagKey( JSONObject request){
List<TagKeysResponse> tagKeys = new ArrayList<TagKeysResponse>();
return null;
}
}
NOTE: Here, many DTO classes are being used. These are created based on requests and responses required by the endpoints.You can go through the repository, whose link is passed, to get these classes.
Here is the service class method used in the controller to get the data from the Sonarqube, you can provide another implementation of this method where we can provide from date and to date as request parameter to the Sonarqube API request.
xxxxxxxxxx
()
public class SonarApiServiceImpl implements SonarApiService{
public List<List<Object>> getDataPoint(Range range, String metrics) {
List<List<Object>> datapoints = new ArrayList<>();
RestTemplate restTemplate = new RestTemplate();
String historyMetrics = "http://localhost:9000/api/measures/search_history";
UriComponentsBuilder builder = UriComponentsBuilder
.fromUriString(historyMetrics)
// Add query parameter
.queryParam("component", "com.infy.sonar:sonar-spring-demo")
.queryParam("metrics", metrics);
MeasureHistoryResponse measureHistoryResponse = restTemplate.getForObject(builder.toUriString(), MeasureHistoryResponse.class);
System.out.println("sonar response - "+measureHistoryResponse);
for(Measure measure: measureHistoryResponse.getMeasures()) {
for(MeasureHistory measureHistory: measure.getHistory()) {
ZonedDateTime zonedDateTime = measureHistory.getDate();
System.out.println("zoned time - "+zonedDateTime);
Long epochSecond = zonedDateTime.toEpochSecond();
LocalDateTime historyTime = zonedDateTime.toLocalDateTime();
LocalDateTime rangeFrom = range.getFrom();
LocalDateTime rangeTo = range.getTo();
System.out.println("history - "+historyTime);
System.out.println("from - "+rangeFrom);
System.out.println("to - "+rangeTo);
System.out.println("epoch sec - "+epochSecond);
if(historyTime.isBefore(range.getFrom()) || historyTime.isAfter(range.getTo()))
continue;
List<Object> datapoint = Arrays.asList(measureHistory.getValue(),epochSecond*1000);
datapoints.add(datapoint);
}
}
return datapoints;
}
}
3. Create Grafana Dashboard
In this step, first, we have to install the SimpleJson plugin. You can install the SimpleJson datasource plugin in Grafana by running the following command:
grafana-cli plugins install grafana-simple-json-datasource
After the installation, you need to restart the grafana-server.
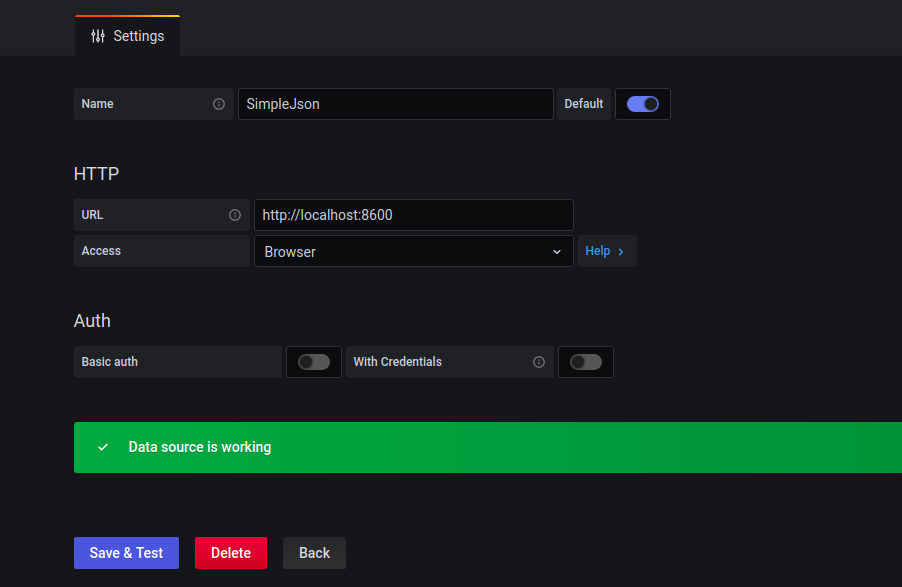
Once the SimpleJson datasource is installed, we can use it as datasource. Now select it as a datasource and provide details as per following snapshot:
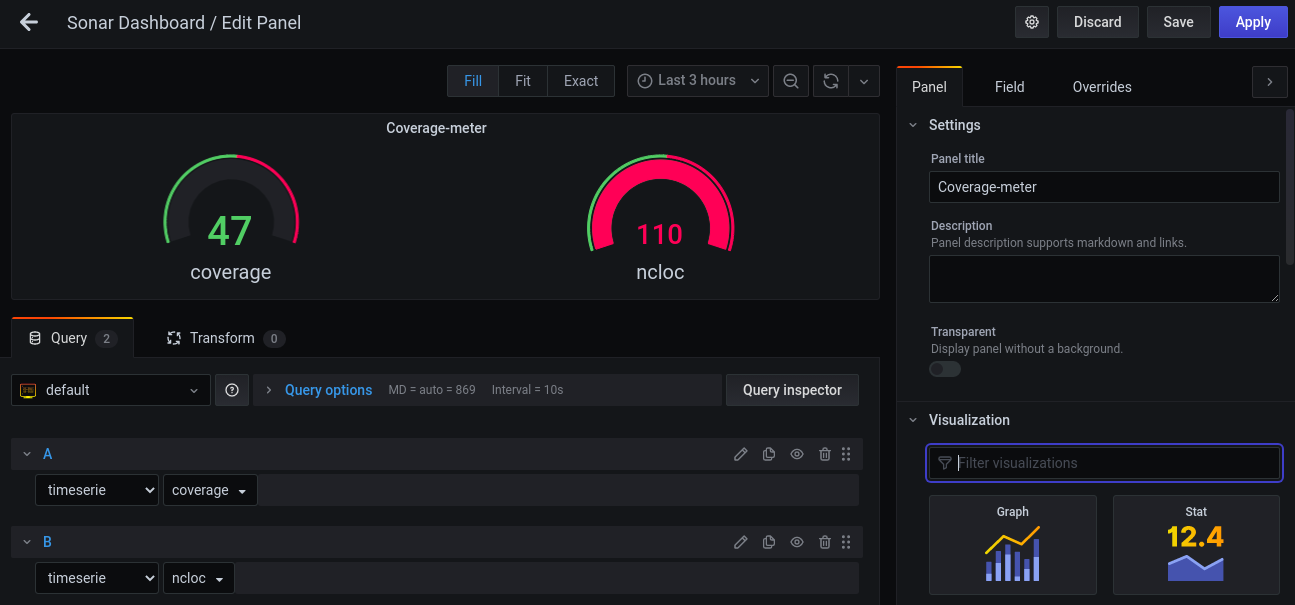
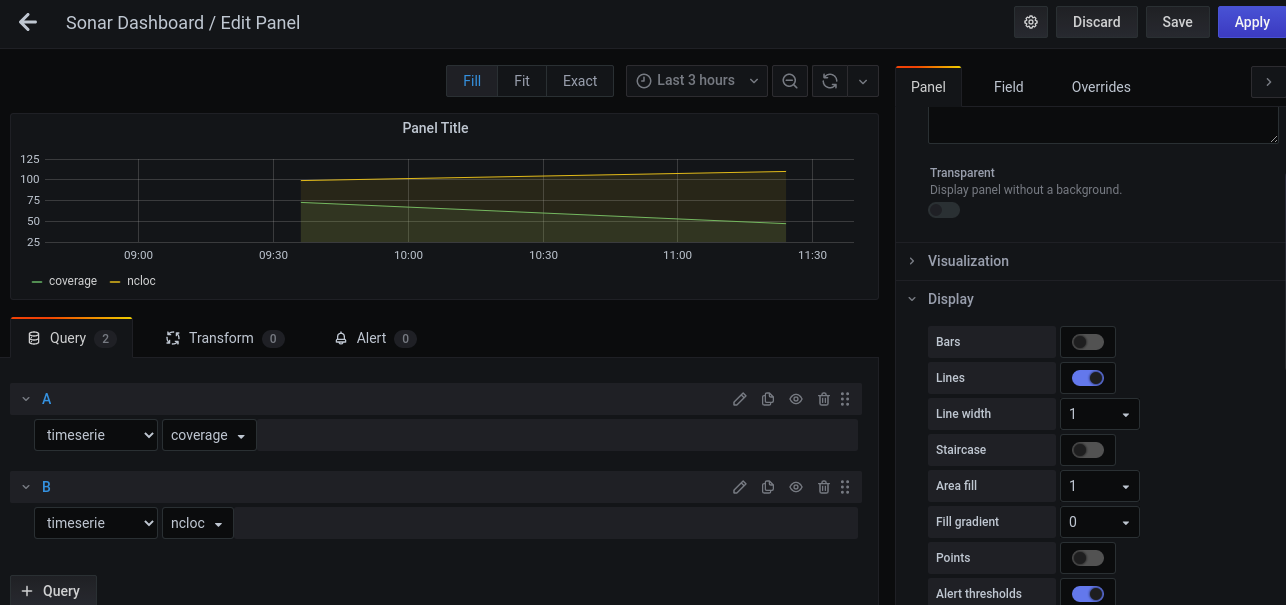
Now, create grafana dashboard. I am creating two pannel one showing coverage and number of lines of code in guage form while other in line-graph form. Here is the screenshot for the creation of the panel.
Thanks for reading!!
Opinions expressed by DZone contributors are their own.
Comments