Spring Boot Monitoring via Prometheus -Grafana
In this article, take a look at a tutorial on how to show your spring boot application metrics in Prometheus and Grafana.
Join the DZone community and get the full member experience.
Join For FreeHi guys, today, I will explain how to show our spring boot application metrics in Prometheus and Grafana.
First of all, we have to add our micrometer and actuator dependencies to our pom.
x
<dependency>
<groupId>org.springframework.boot</groupId>
<artifactId>spring-boot-starter-actuator</artifactId>
</dependency>
<dependency> <groupId>io.micrometer</groupId>
<artifactId>micrometer-registry-prometheus</artifactId>
</dependency>
Spring actuator module contains the actuator endpoints and the actuator endpoints allow you to monitor and interact with your application.
Here you can find the endpoints that you can access
micrometer-registry-prometheus dependency is used to expose Prometheus related metrics via JMX or HTTP
By default all actuator endpoints are exposed via JMX but only the health and info endpoints are exposed over HTTP
You can change this behaviour via application.properties by adding your configuration as follows
In order to expose all of them via web
xxxxxxxxxx
management.endpoints.web.exposure.include=*
management.endpoints.web.exposure.exclude=
In order expose all endpoint view jmx
xxxxxxxxxx
management.endpoints.jmx.exposure.include=*
management.endpoints.jmx.exposure.exclude=
In order expose some of the metric via web
xxxxxxxxxx
management.endpoints.web.exposure.include=health,info,prometheus
management.endpoints.web.exposure.exclude
The health endpoints check the health of the application via several auto configured health indicators such as DiskSpaceHealthIndicator ,DataSourceHealthIndicator You can find the all of the indicators from here
You can disable all of them by setting this argument to your application.properties
xxxxxxxxxx
management.health.defaults.enabled =false
You can disable specific indicator by setting this argument
xxxxxxxxxx
management.health.cassandra.enabled=false
Prometheus is a free software which is used for event monitoring and alerting.It records realt time events and store in them in a time series db
Prometheus has a property file prometheus.yml .In order to show our metrics in Prometheus we need to add our configuration to this file.For instance
xxxxxxxxxx
- job_name: 'AcrHandler-Actuator'
metrics_path: 'acrhandler/actuator/prometheus'
scrape_interval: 5s
static_configs:
- targets: ['127.0.0.1:8898']
At this example in we expose our metrics to web. We can reach the metrics a url like this
http://127.0.0.1:8898/acrhandler/actuator/prometheus
xxxxxxxxxx
# HELP tomcat_sessions_created_sessions_total # TYPE tomcat_sessions_created_sessions_total counter tomcat_sessions_created_sessions_total 0.0 # HELP tomcat_sessions_expired_sessions_total # TYPE tomcat_sessions_expired_sessions_total counter tomcat_sessions_expired_sessions_total 0.0 # HELP http_server_requests_seconds # TYPE http_server_requests_seconds summary http_server_requests_seconds_count{exception="None",method="GET",outcome="SUCCESS",status="200",uri="/actuator/prometheus",} 5.0 http_server_requests_seconds_sum{exception="None",method="GET",outcome="SUCCESS",status="200",uri="/actuator/prometheus",} 0.135901256 # HELP http_server_requests_seconds_max # TYPE http_server_requests_seconds_max gauge http_server_requests_seconds_max{exception="None",method="GET",outcome="SUCCESS",status="200",uri="/actuator/prometheus",} 0.084112625 # HELP health # TYPE health gauge health 1.0 # HELP process_files_max_files The maximum file descriptor count # TYPE process_files_max_files gauge process_files_max_files 4096.0 # HELP hikaricp_connections_creation_seconds_max Connection creation time # TYPE hikaricp_connections_creation_seconds_max gauge hikaricp_connections_creation_seconds_max{pool="HikariPool-1",} 0.0 # HELP hikaricp_connections_creation_seconds Connection creation time # TYPE hikaricp_connections_creation_seconds summary hikaricp_connections_creation_seconds_count{pool="HikariPool-1",} 0.0 hikaricp_connections_creation_seconds_sum{pool="HikariPool-1",} 0.0 # HELP jvm_threads_live_threads The current number of live threads including both daemon and non-daemon threads # TYPE jvm_threads_live_threads gauge jvm_threads_live_threads 33.0 # HELP process_uptime_seconds The uptime of the Java virtual machine # TYPE process_uptime_seconds gauge process_uptime_seconds 38.376 # HELP jvm_gc_memory_promoted_bytes_total Count of positive increases in the size of the old generation memory pool before GC to after GC # TYPE jvm_gc_memory_promoted_bytes_total counter jvm_gc_memory_promoted_bytes_total 9702952.0 # HELP system_load_average_1m The sum of the number of runnable entities queued to available processors and the number of runnable entities running on the available processors averaged over a period of time # TYPE system_load_average_1m gauge system_load_average_1m 3.23 # HELP jvm_gc_memory_allocated_bytes_total Incremented for an increase in the size of the young generation memory pool after one GC to before the next # TYPE jvm_gc_memory_allocated_bytes_total counter jvm_gc_memory_allocated_bytes_total 1.1564802E9 # HELP jvm_gc_live_data_size_bytes Size of old generation memory pool after a full GC # TYPE jvm_gc_live_data_size_bytes gauge jvm_gc_live_data_size_bytes 2.4583664E7 # HELP logback_events_total Number of error level events that made it to the logs # TYPE logback_events_total counter logback_events_total{level="warn",} 2.0 logback_events_total{level="debug",} 0.0 logback_events_total{level="error",} 0.0 logback_events_total{level="trace",} 0.0 logback_events_total{level="info",} 24.0 # HELP jvm_threads_daemon_threads The current number of live daemon threads # TYPE jvm_threads_daemon_threads gauge jvm_threads_daemon_threads 18.0 # HELP hikaricp_connections_pending Pending threads # TYPE hikaricp_connections_pending gauge hikaricp_connections_pending{pool="HikariPool-1",} 0.0 # HELP hikaricp_connections_usage_seconds Connection usage time # TYPE hikaricp_connections_usage_seconds summary hikaricp_connections_usage_seconds_count{pool="HikariPool-1",} 18.0 hikaricp_connections_usage_seconds_sum{pool="HikariPool-1",} 0.392 # HELP hikaricp_connections_usage_seconds_max Connection usage time # TYPE hikaricp_connections_usage_seconds_max gauge hikaricp_connections_usage_seconds_max{pool="HikariPool-1",} 0.23 # HELP jvm_memory_max_bytes The maximum amount of memory in bytes that can be used for memory management # TYPE jvm_memory_max_bytes gauge jvm_memory_max_bytes{area="heap",id="PS Survivor Space",} 1.1534336E7 jvm_memory_max_bytes{area="heap",id="PS Old Gen",} 4.185915392E9 jvm_memory_max_bytes{area="heap",id="PS Eden Space",} 2.069364736E9 jvm_memory_max_bytes{area="nonheap",id="Metaspace",} -1.0 jvm_memory_max_bytes{area="nonheap",id="Code Cache",} 2.5165824E8 jvm_memory_max_bytes{area="nonheap",id="Compressed Class Space",} 1.073741824E9 # HELP hikaricp_connections_acquire_seconds Connection acquire time # TYPE hikaricp_connections_acquire_seconds summary hikaricp_connections_acquire_seconds_count{pool="HikariPool-1",} 18.0 hikaricp_connections_acquire_seconds_sum{pool="HikariPool-1",} 0.129593483 # HELP hikaricp_connections_acquire_seconds_max Connection acquire time # TYPE hikaricp_connections_acquire_seconds_max gauge hikaricp_connections_acquire_seconds_max{pool="HikariPool-1",} 0.065776108 # HELP process_files_open_files The open file descriptor count # TYPE process_files_open_files gauge process_files_open_files 35.0 # HELP jdbc_connections_min # TYPE jdbc_connections_min gauge jdbc_connections_min{name="dataSource",} 5.0 # HELP jdbc_connections_idle # TYPE jdbc_connections_idle gauge jdbc_connections_idle{name="dataSource",} 5.0 # HELP system_cpu_usage The "recent cpu usage" for the whole system # TYPE system_cpu_usage gauge system_cpu_usage 0.06451612903225806 # HELP jvm_classes_unloaded_classes_total The total number of classes unloaded since the Java virtual machine has started execution # TYPE jvm_classes_unloaded_classes_total counter jvm_classes_unloaded_classes_total 0.0 # HELP hikaricp_connections_min Min connections # TYPE hikaricp_connections_min gauge hikaricp_connections_min{pool="HikariPool-1",} 5.0 # HELP jvm_memory_committed_bytes The amount of memory in bytes that is committed for the Java virtual machine to use # TYPE jvm_memory_committed_bytes gauge jvm_memory_committed_bytes{area="heap",id="PS Survivor Space",} 1.1534336E7 jvm_memory_committed_bytes{area="heap",id="PS Old Gen",} 2.86261248E8 jvm_memory_committed_bytes{area="heap",id="PS Eden Space",} 6.0030976E8 jvm_memory_committed_bytes{area="nonheap",id="Metaspace",} 7.6324864E7 jvm_memory_committed_bytes{area="nonheap",id="Code Cache",} 1.6515072E7 jvm_memory_committed_bytes{area="nonheap",id="Compressed Class Space",} 1.0797056E7 # HELP hikaricp_connections Total connections # TYPE hikaricp_connections gauge hikaricp_connections{pool="HikariPool-1",} 5.0 # HELP jvm_buffer_memory_used_bytes An estimate of the memory that the Java virtual machine is using for this buffer pool # TYPE jvm_buffer_memory_used_bytes gauge jvm_buffer_memory_used_bytes{id="direct",} 49152.0 jvm_buffer_memory_used_bytes{id="mapped",} 0.0 # HELP process_start_time_seconds Start time of the process since unix epoch. # TYPE process_start_time_seconds gauge process_start_time_seconds 1.604402424269E9 # HELP jvm_classes_loaded_classes The number of classes that are currently loaded in the Java virtual machine # TYPE jvm_classes_loaded_classes gauge jvm_classes_loaded_classes 14017.0 # HELP hikaricp_connections_active Active connections # TYPE hikaricp_connections_active gauge hikaricp_connections_active{pool="HikariPool-1",} 0.0 # HELP jvm_gc_pause_seconds Time spent in GC pause # TYPE jvm_gc_pause_seconds summary jvm_gc_pause_seconds_count{action="end of major GC",cause="Metadata GC Threshold",} 1.0 jvm_gc_pause_seconds_sum{action="end of major GC",cause="Metadata GC Threshold",} 0.15 jvm_gc_pause_seconds_count{action="end of minor GC",cause="Metadata GC Threshold",} 1.0 jvm_gc_pause_seconds_sum{action="end of minor GC",cause="Metadata GC Threshold",} 0.035 jvm_gc_pause_seconds_count{action="end of minor GC",cause="Allocation Failure",} 2.0 jvm_gc_pause_seconds_sum{action="end of minor GC",cause="Allocation Failure",} 0.059 # HELP jvm_gc_pause_seconds_max Time spent in GC pause # TYPE jvm_gc_pause_seconds_max gauge jvm_gc_pause_seconds_max{action="end of major GC",cause="Metadata GC Threshold",} 0.15 jvm_gc_pause_seconds_max{action="end of minor GC",cause="Metadata GC Threshold",} 0.035 jvm_gc_pause_seconds_max{action="end of minor GC",cause="Allocation Failure",} 0.03 # HELP jdbc_connections_active # TYPE jdbc_connections_active gauge jdbc_connections_active{name="dataSource",} 0.0 # HELP tomcat_sessions_active_current_sessions # TYPE tomcat_sessions_active_current_sessions gauge tomcat_sessions_active_current_sessions 0.0 # HELP jvm_buffer_total_capacity_bytes An estimate of the total capacity of the buffers in this pool # TYPE jvm_buffer_total_capacity_bytes gauge jvm_buffer_total_capacity_bytes{id="direct",} 49152.0 jvm_buffer_total_capacity_bytes{id="mapped",} 0.0 # HELP hikaricp_connections_timeout_total Connection timeout total count # TYPE hikaricp_connections_timeout_total counter hikaricp_connections_timeout_total{pool="HikariPool-1",} 0.0 # HELP hikaricp_connections_idle Idle connections # TYPE hikaricp_connections_idle gauge hikaricp_connections_idle{pool="HikariPool-1",} 5.0 # HELP jvm_memory_used_bytes The amount of used memory # TYPE jvm_memory_used_bytes gauge jvm_memory_used_bytes{area="heap",id="PS Survivor Space",} 9109568.0 jvm_memory_used_bytes{area="heap",id="PS Old Gen",} 2.4591856E7 jvm_memory_used_bytes{area="heap",id="PS Eden Space",} 4.32988248E8 jvm_memory_used_bytes{area="nonheap",id="Metaspace",} 7.1654952E7 jvm_memory_used_bytes{area="nonheap",id="Code Cache",} 1.558432E7 jvm_memory_used_bytes{area="nonheap",id="Compressed Class Space",} 9960632.0 # HELP jvm_threads_peak_threads The peak live thread count since the Java virtual machine started or peak was reset # TYPE jvm_threads_peak_threads gauge jvm_threads_peak_threads 34.0 # HELP hikaricp_connections_max Max connections # TYPE hikaricp_connections_max gauge hikaricp_connections_max{pool="HikariPool-1",} 5.0 # HELP system_cpu_count The number of processors available to the Java virtual machine # TYPE system_cpu_count gauge system_cpu_count 2.0 # HELP tomcat_sessions_active_max_sessions # TYPE tomcat_sessions_active_max_sessions gauge tomcat_sessions_active_max_sessions 0.0 # HELP jvm_gc_max_data_size_bytes Max size of old generation memory pool # TYPE jvm_gc_max_data_size_bytes gauge jvm_gc_max_data_size_bytes 4.185915392E9 # HELP jvm_buffer_count_buffers An estimate of the number of buffers in the pool # TYPE jvm_buffer_count_buffers gauge jvm_buffer_count_buffers{id="direct",} 6.0 jvm_buffer_count_buffers{id="mapped",} 0.0 # HELP process_cpu_usage The "recent cpu usage" for the Java Virtual Machine process # TYPE process_cpu_usage gauge process_cpu_usage 0.01282051282051282 # HELP jvm_threads_states_threads The current number of threads having NEW state # TYPE jvm_threads_states_threads gauge jvm_threads_states_threads{state="runnable",} 6.0 jvm_threads_states_threads{state="blocked",} 0.0 jvm_threads_states_threads{state="waiting",} 12.0 jvm_threads_states_threads{state="timed-waiting",} 15.0 jvm_threads_states_threads{state="new",} 0.0 jvm_threads_states_threads{state="terminated",} 0.0 # HELP tomcat_sessions_rejected_sessions_total # TYPE tomcat_sessions_rejected_sessions_total counter tomcat_sessions_rejected_sessions_total 0.0 # HELP jdbc_connections_max # TYPE jdbc_connections_max gauge jdbc_connections_max{name="dataSource",} 5.0 # HELP tomcat_sessions_alive_max_seconds # TYPE tomcat_sessions_alive_max_seconds gauge tomcat_sessions_alive_max_seconds 0.0
After we define our scrape configuration we can reach the metrics from Prometheus. Here is some examples
Cpu Usage
system_cpu_usage{job="AcrHandler-Actuator",instance="127.0.0.1:8898"}*100
| Element | Value |
|---|---|
| {instance="127.0.0.1:8898",job="AcrHandler-Actuator"} | 7.918781725888325 |
Memory Usage
jvm_memory_used_bytes{instance="127.0.0.1:8898",job="AcrHandler-Actuator"}/1024/1024/1024
| {area="heap",id="PS Eden Space",instance="127.0.0.1:8898",job="AcrHandler-Actuator"} | 0.3060152754187584 |
| {area="heap",id="PS Old Gen",instance="1127.0.0.1:8898",job="AcrHandler-Actuator"} | 0.022910580039024353 |
| {area="heap",id="PS Survivor Space",instance="127.0.0.1:8898",job="AcrHandler-Actuator"} | 0.010879650712013245 |
| {area="nonheap",id="Code Cache",instance="127.0.0.1:8898",job="AcrHandler-Actuator"} | 0.027592718601226807 |
| {area="nonheap",id="Compressed Class Space",instance="127.0.0.1:8898",job="AcrHandler-Actuator"} | 0.009301654994487762 |
| {area="nonheap",id="Metaspace",instance="127.0.0.1:8898",job="AcrHandler-Actuator"} | 0.0699569433927536 |
To sum all values we should use without in order to ignore area and id value differences
sum without(area,id)(jvm_memory_used_bytes{instance="127.0.0.1:8898",job="AcrHandler-Actuator"})/1024/1024/1024
| Element | Value |
|---|---|
| {instance="127.0.0.1:8898",job="AcrHandler-Actuator"} | 0.4311163127422333 |
Health
In order to expose health value in Prometheus we need to write our own configuration code for registering to micrometer module
Here you can find an example configuration
public class HealthMetricsConfiguration {
MeterRegistryCustomizer<MeterRegistry> healthRegistryCustomizer(HealthContributorRegistry healthRegistry) {
return registry -> registry.gauge("health", emptyList(), healthRegistry, health -> {
var status = aggregatedStatus(health);
switch (status.getCode()) {
case "UP":
return 1;
case "OUT_OF_SERVICE":
return -1;
case "DOWN":
return -2;
case "UNKNOWN":
default:
return 0;
}
});
}
private static Status aggregatedStatus(HealthContributorRegistry health) {
var healthList = health.stream()
.map(r -> ((HealthIndicator) r.getContributor()).getHealth(false).getStatus())
.collect(Collectors.toSet());
var statusAggregator = new SimpleStatusAggregator();
return statusAggregator.getAggregateStatus(healthList);
}
In Prometheus
health{instance="10.127.0.01:8898", job="AcrHandler-Actuator"}
| Element | Value |
|---|---|
| health{instance="127.0.0.1:8898",job="AcrHandler-Actuator"} | 1 |
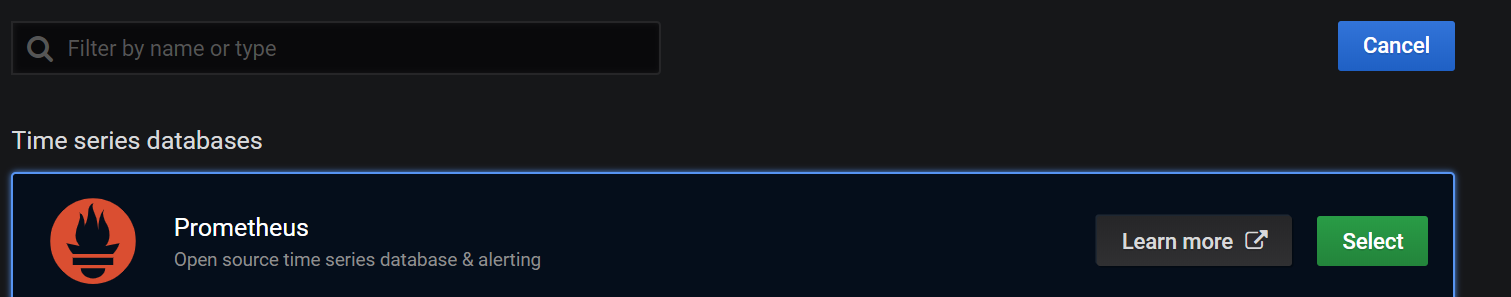
In order to show our metrics in a more user friendly interface.We could use Grafana
We have to add Prometheus as a datasource to Grafana
We need to define a panel
At the panel We can define our queries in query tab

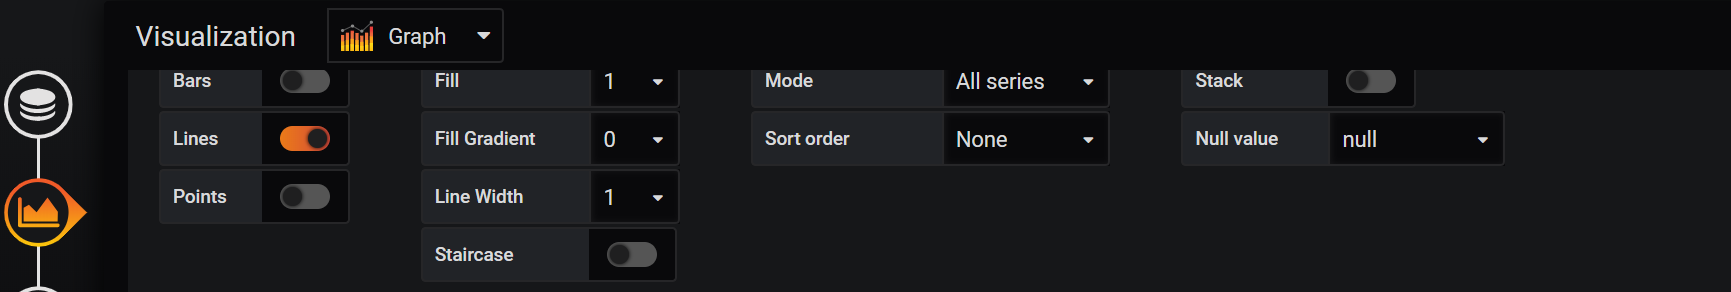
We define our graphs from the visualisation tab
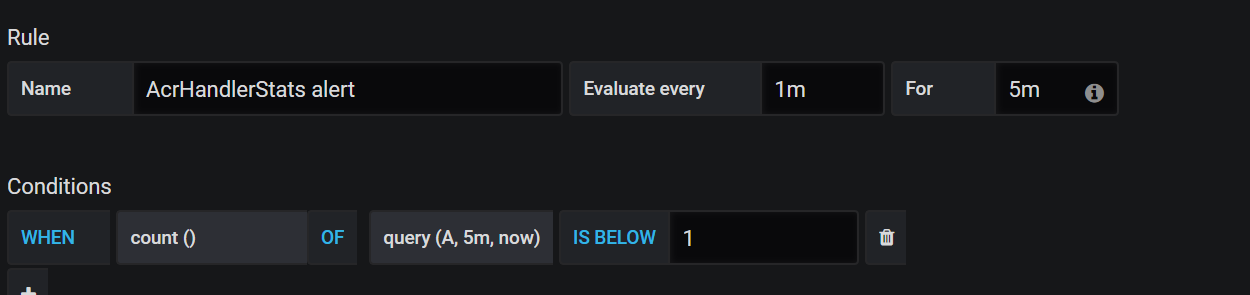
We can define our alarms with using aggregate functions
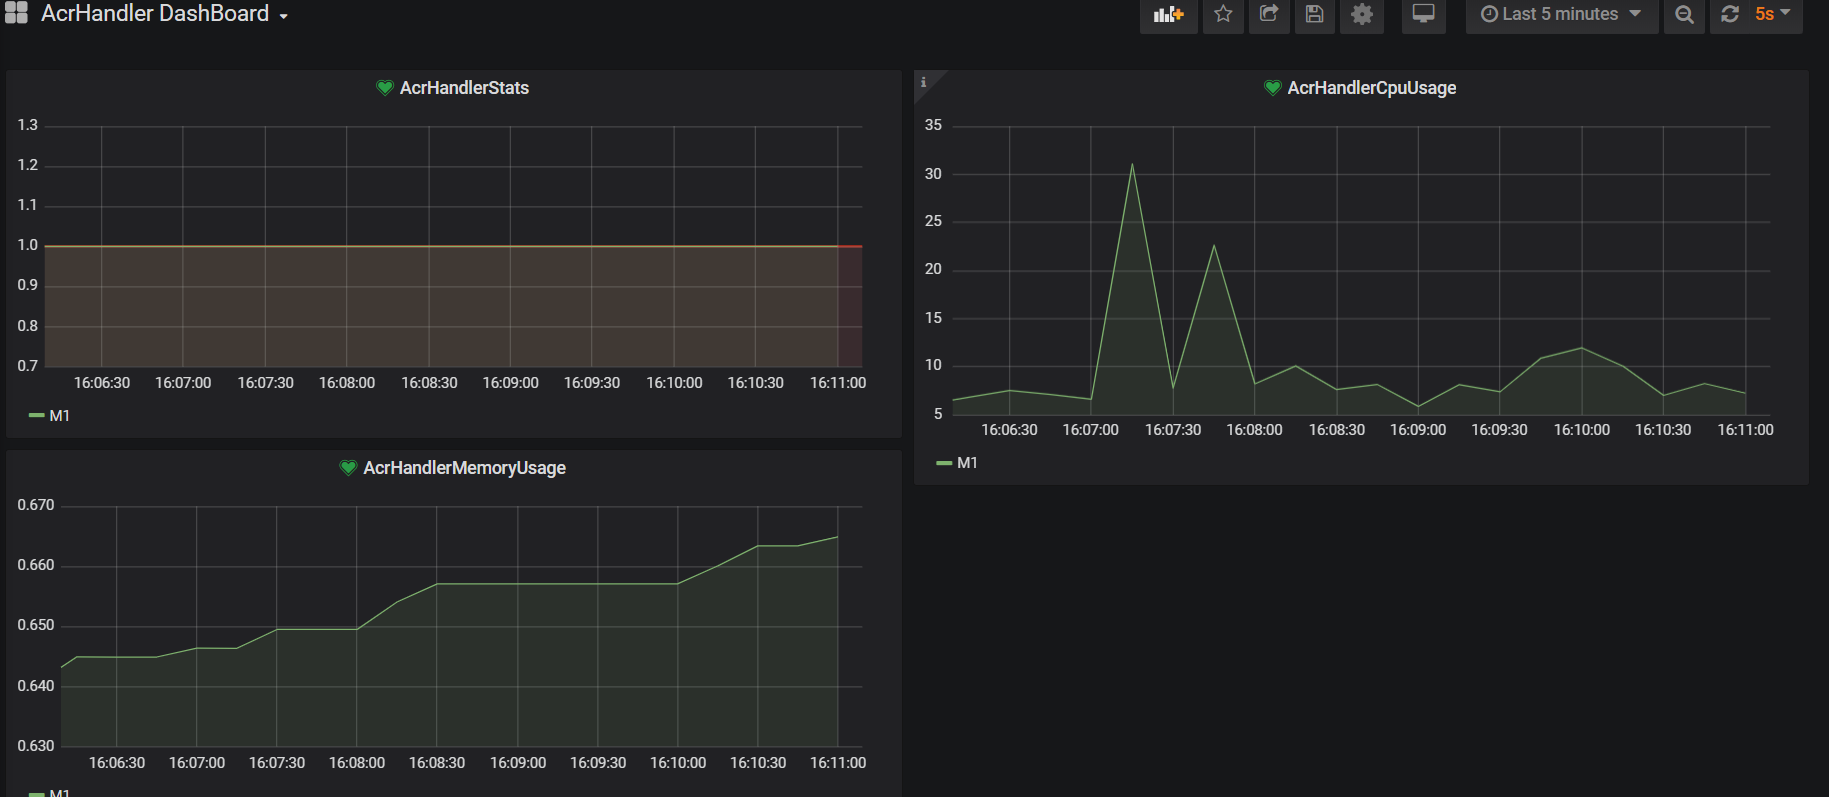
Here you can find how it seems in Grafana
Opinions expressed by DZone contributors are their own.
Comments