Spring Boot Metrics with Dynamic Tag Values
Tweak around with the new Spring Boot Micrometer to get a semi-dynamic tagged metrics.
Join the DZone community and get the full member experience.
Join For FreeMetrics are essential tools for every scalable application.
Spring Boot 2.0 introduced a new level of metrics with the Micrometer library, making integration of our code with monitoring systems like Prometheus and Graphite simpler than ever.
One of the features we found missing is dynamic tag values. Tag name and value are declared at counter creation. In fact, tag values are treated as a name decorator: tags with the same name and tag name, but different tag values are two different standalone counters.
xxxxxxxxxx
Counter counterWithTag1 = Counter.builder(name).tags(tagName, tagValue1).register(registry);
Counter counterWithTag2 = Counter.builder(name).tags(tagName, tagValue2).register(registry);
Our system is multi-tenant: it serves messages from multiple customers. We want to know the rate of messages we process per customer. The list of names of the active customers is dynamic, as they connect and disconnect. We do not want to hold a counter for a customer that exists in the system but does not send data, we do not want to sync our counters with a db holding the list of customers to detect newly added customers. We want to have a counter only if and when a customer is sending data.
The full code described below can be found at https://github.com/firedome/dynamic-actuator-metrics and used under MIT license.
For this case (and many others) we implemented the TaggedCounter:
xxxxxxxxxx
import io.micrometer.core.instrument.Counter;
import io.micrometer.core.instrument.MeterRegistry;
import java.util.HashMap;
import java.util.Map;
public class TaggedCounter {
private String name;
private String tagName;
private MeterRegistry registry;
private Map<String, Counter> counters = new HashMap<>();
public TaggedCounter(String name, String tagName, MeterRegistry registry) {
this.name = name;
this.tagName = tagName;
this.registry = registry;
}
public void increment(String tagValue){
Counter counter = counters.get(tagValue);
if(counter == null) {
counter = Counter.builder(name).tags(tagName, tagValue).register(registry);
counters.put(tagValue, counter);
}
counter.increment();
}
}
In our message receiver constructor, we create a TaggedCounter, noting the name of the counter and the name of the tag. No values. Note that MeterRegistry can be autowired, you do not have to explicitly create it.
x
private TaggedCounter perCustomerMessages;
public ReaderMessageReceiver(MeterRegistry meterRegistry) {
this.perCustomerMessages = new TaggedCounter("per-customer-messages", "customer", meterRegistry);
}
Later on, when a message is received (in this case, a pubsub message), we increment the counter, now noting the tag value.
xxxxxxxxxx
public void receiveMessage(PubsubMessage pubsubMessage, AckReplyConsumer ackReplyConsumer) {
String customer = pubsubMessage.getAttributesMap().get("customer_id");
perCustomerMessages.increment(customer);
try {
//process the message...
} finally {
ackReplyConsumer.ack();
}
}
And that's it. Our monitoring server is Prometheus, this is what we get in /actuator/prometheus endpoint (note that all delimiters in the counter name or tag name are replaced with underscores):
xxxxxxxxxx
# TYPE per_customer_messages_total counter
per_customer_messages_total{customer="0f43e152",} 1291460.0
per_customer_messages_total{customer="93c2adbb",} 118899.0
per_customer_messages_total{customer="1eab1589",} 301311.0
per_customer_messages_total{customer="270e5ca0",} 1710188.0
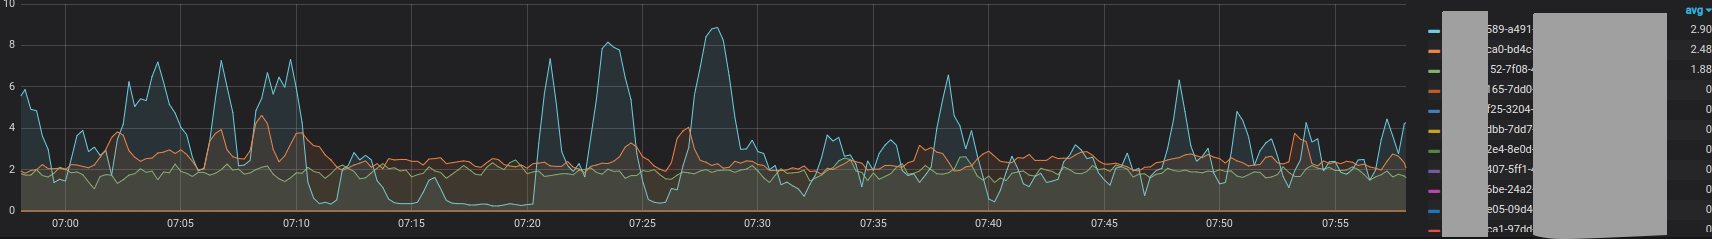
In Grafana we can see a graph of messages per customer by the query
x
sum by (customer)(rate(per_customer_messages_total[1m]))
With {{customer}} in the Legend format field, we get the graph we wanted: a line per customer.
Another use case is processing different types of messages. Each type has its own processing time, and we want to measure by a timer the processing latency per type. (Although the message types are predefined in the system, some of them are not in use: deprecated or just rarely used. We want the counters to be triggered only if used.)
So we have a similar class of TaggedTimer:
xxxxxxxxxx
import io.micrometer.core.instrument.MeterRegistry;
import io.micrometer.core.instrument.Timer;
import java.util.HashMap;
import java.util.Map;
public class TaggedTimer {
private String name;
private String tagName;
private MeterRegistry registry;
private Map<String, Timer> timers = new HashMap<>();
public TaggedTimer(String name, String tagName, MeterRegistry registry) {
this.name = name;
this.tagName = tagName;
this.registry = registry;
}
public Timer getTimer(String tagValue){
Timer timer = timers.get(tagValue);
if(timer == null) {
timer = Timer.builder(name).tags(tagName, tagValue).register(registry);
timers.put(tagValue, timer);
}
return timer;
}
}
xxxxxxxxxx
TaggedTimer perTypeTimer = new TaggedTimer("per-type-processing-timer", "message-type", meterRegistry);
And then use it, in this case for the 'heartbeat' message type, by
x
perTypeTimer.getTimer("heartbeat").record(() -> {
//process the message...
});
In Grafana, we display the process latency per message type by
xxxxxxxxxx
sum by (message_type)(rate(per_type_processing_timer_seconds_sum[1m])/rate(rate(per_type_processing_timer_seconds_count[1m]))
(We did not create a tagged Gauge as we did not need it, but one can be created in the same manner.)
The above TaggedCounter and TaggedTimer are solving the most frequent case of a counter with a single tag. But what if you need to count by multiple tags? For example, in order to profile the functional difference between our customers, we wanted to get the rate of messages of a specific type per customer.
For this, we created the MultiTaggedCounter:
xxxxxxxxxx
import io.micrometer.core.instrument.Counter;
import io.micrometer.core.instrument.ImmutableTag;
import io.micrometer.core.instrument.MeterRegistry;
import io.micrometer.core.instrument.Tag;
import java.util.*;
public class MultiTaggedCounter {
private String name;
private String[] tagNames;
private MeterRegistry registry;
private Map<String, Counter> counters = new HashMap<>();
public MultiTaggedCounter(String name, MeterRegistry registry, String ... tags) {
this.name = name;
this.tagNames = tags;
this.registry = registry;
}
public void increment(String ... tagValues){
String valuesString = Arrays.toString(tagValues);
if(tagValues.length != tagNames.length) {
throw new IllegalArgumentException("Counter tags mismatch! Expected args are "+Arrays.toString(tagNames)+", provided tags are "+valuesString);
}
Counter counter = counters.get(valuesString);
if(counter == null) {
List<Tag> tags = new ArrayList<>(tagNames.length);
for(int i = 0; i<tagNames.length; i++) {
tags.add(new ImmutableTag(tagNames[i], tagValues[i]));
}
counter = Counter.builder(name).tags(tags).register(registry);
counters.put(valuesString, counter);
}
counter.increment();
}
}
When building the counter we note only the tag names
x
MultiTaggedCounter perCustomerPerTypeMessages = new MultiTaggedCounter("per-customer-per-type", meterRegistry, "customer", "message-type");
And then using the counter, we increment noting the tag values
xxxxxxxxxx
perCustomerPerTypeMessages.increment(message.getCustomerName(), message.getType());
In Grafana we sum by both customer and message_type tags:
xxxxxxxxxx
sum by (customer, message_type)(rate(per_customer_per_type_total[1m]))
(Legend format {{customer}}-{{message_type}} is the short notation of that values in the legend)
We can also get the data for a specific customer or specific type by
xxxxxxxxxx
sum by (message_type)(rate(per_customer_per_type_total{customer="89450f"}[1m]))
Hope you found this helpful!
Opinions expressed by DZone contributors are their own.
Comments