Filtering the Stack Trace From Hell
Join the DZone community and get the full member experience.
Join For FreeI love stack traces. Not because I love errors, but the moment they
occur, stack trace is priceless source of information. For instance in
web application the stack trace shows you the complete request
processing path, from HTTP socket, through filters, servlets,
controllers, services, DAOs, etc. - up to the place, where an error
occurred. You can read them as a good book, where every event has cause
and effect. I even implemented some enhancements in the way Logback prints exceptions, see Logging exceptions root cause first.
But one thing's been bothering me for a while. The infamous “stack trace from hell"
symptom – stack traces containing hundreds of irrelevant, cryptic,
often auto-generated methods. AOP frameworks and over-engineered
libraries tend to produce insanely long execution traces. Let me show a
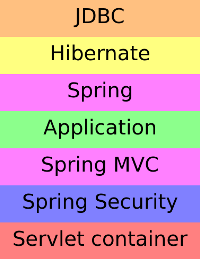
real-life example. In a sample application I am using the following
technology stack:
Colours are important. According to framework/layer colour I painted a sample stack trace, caused by exception thrown somewhere deep while trying to fetch data from the database:
No longer that pleasant, don't you think? Placing Spring between application and Hibernate in the first diagram was a huge oversimplification. Spring framework is a glue code that wires up and intercepts your business logic with surrounding layers. That is why application code is scattered and interleaved by dozens of lines of technical invocations (see green lines). I put as much stuff as I could into the application (Spring AOP, method-level @Secured annotations, custom aspects and interceptors, etc.) to emphasize the problem – but it is not Spring specific. EJB servers generate equally terrible stack traces (...from hell) between EJB calls. Should I care? Think about it, when you innocently call BookService.listBooks() from BookController.listBooks() do you expect to see this?
at com.blogspot.nurkiewicz.BookService.listBooks()
at com.blogspot.nurkiewicz.BookService$$FastClassByCGLIB$$e7645040.invoke()
at net.sf.cglib.proxy.MethodProxy.invoke()
at org.springframework.aop.framework.Cglib2AopProxy$CglibMethodInvocation.invokeJoinpoint()
at org.springframework.aop.framework.ReflectiveMethodInvocation.proceed()
at org.springframework.aop.aspectj.MethodInvocationProceedingJoinPoint.proceed()
at com.blogspot.nurkiewicz.LoggingAspect.logging()
at sun.reflect.NativeMethodAccessorImpl.invoke0()
at sun.reflect.NativeMethodAccessorImpl.invoke()
at sun.reflect.DelegatingMethodAccessorImpl.invoke()
at java.lang.reflect.Method.invoke()
at org.springframework.aop.aspectj.AbstractAspectJAdvice.invokeAdviceMethodWithGivenArgs()
at org.springframework.aop.aspectj.AbstractAspectJAdvice.invokeAdviceMethod()
at org.springframework.aop.aspectj.AspectJAroundAdvice.invoke()
at org.springframework.aop.framework.ReflectiveMethodInvocation.proceed()
at org.springframework.aop.interceptor.AbstractTraceInterceptor.invoke()
at org.springframework.aop.framework.ReflectiveMethodInvocation.proceed()
at org.springframework.transaction.interceptor.TransactionInterceptor.invoke()
at org.springframework.aop.framework.ReflectiveMethodInvocation.proceed()
at org.springframework.aop.interceptor.ExposeInvocationInterceptor.invoke()
at org.springframework.aop.framework.ReflectiveMethodInvocation.proceed()
at org.springframework.aop.framework.Cglib2AopProxy$DynamicAdvisedInterceptor.intercept()
at com.blogspot.nurkiewicz.BookService$$EnhancerByCGLIB$$7cb147e4.listBooks()
at com.blogspot.nurkiewicz.web.BookController.listBooks()
And have you even noticed there is custom aspect in between? That's the
thing, there is so much noise in the stack traces nowadays that
following the actual business logic is virtually impossible. One of the
best troubleshooting tools we have is bloated with irrelevant
framework-related stuff we don't need in 99% of the cases.
Tools and IDEs are doing a good job of reducing the noise. Eclipse has stack trace filter patterns for Junit, IntelliJ IDEA supports console folding customization. See also: Cleaning noise out of Java stack traces,
which inspired me to write this article. So why not having such
possibility at the very root – in the logging framework such as Logback?
I implemented a very simple enhancement in Logback. Basically you can
define a set of stack trace frame patterns that are suppose to be
excluded from stack traces. Typically you will use package or class
names that you are not interested in seeing. This is a sample logback.xml excerpt with the new feature enabled:
<root level="ALL">
  <appender name="STDOUT" class="ch.qos.logback.core.ConsoleAppender">
    <encoder>
      <pattern>%d{HH:mm:ss.SSS} | %-5level | %thread | %logger{1} | %m%n%rEx{full,
          java.lang.reflect.Method,
          org.apache.catalina,
          org.springframework.aop,
          org.springframework.security,
          org.springframework.transaction,
          org.springframework.web,
          sun.reflect,
          net.sf.cglib,
          ByCGLIB
        }
        </pattern>
    </encoder>
  </appender>
</root>
I am a bit extreme in filtering almost whole Spring framework + Java
reflection and CGLIB classes. But it is just to give you an impression
how much can you get. The very same error after applying my enhancement
to Logback:
Just as a reminder, green is our application. Finally in one place, finally you can really see what was your code doing when an error occurred:
at com.blogspot.nurkiewicz.DefaultBookHelper.findBooks()
at com.blogspot.nurkiewicz.BookService.listBooks()
at com.blogspot.nurkiewicz.LoggingAspect.logging()
at com.blogspot.nurkiewicz.web.BookController.listBooks()
Simpler? If you like this feature, I opened a ticket LBCLASSIC-325: Filtering out selected stack trace frames. Vote and discuss. This is only a proof-of-concept, but if you like to have a look at the implementation (improvements are welcome!), it is available under my fork of Logback (around 20 lines of code).
Published at DZone with permission of Tomasz Nurkiewicz, DZone MVB. See the original article here.
Opinions expressed by DZone contributors are their own.


Comments