Gantt Chart vs. Roadmap vs. Timeline
You may see these terms all the time, but are you sure you know their true meaning and what their differences are?
Join the DZone community and get the full member experience.
Join For FreeGantt chart, roadmap, and timeline ― three common concepts in project management. But what do these terms really mean?
If you’ve been wondering about the true meaning of these terms and their differences, you’re in the right place.
In this article, we’ll talk about the concepts behind a Gantt chart, roadmap, and timeline. We’ll also compare them side by side.
What Is a Gantt Chart?
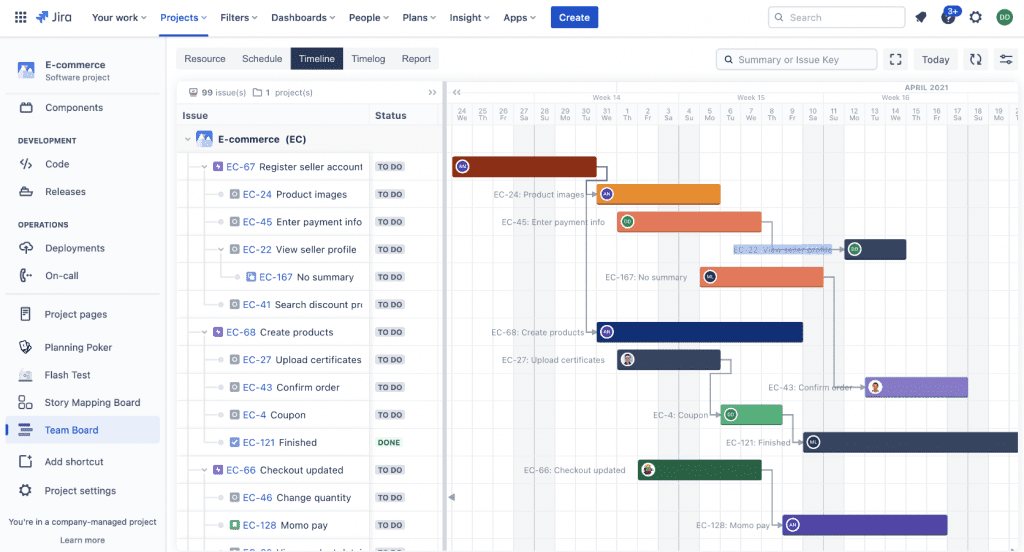
Commonly used in project management, a Gantt chart shows the sequence of tasks that require completion.
In particular, a list of activities can be found on the left side of the chart. On the other hand, a suitable time scale can be found along the top of the Gantt chart.
When you look at a Gantt chart, you’ll see that each bar represents an activity. The bar’s position and length reflect the start date, duration, and end date of the activity.
At a glance, a Gantt chart allows you to see the following:
- A project schedule’s start date
- What the project tasks are
- Which team members are working on a specific task
- When the tasks start and finish
- How long each task will take
- How tasks group together, overlap, and link with each other
- The project’s finish date
Typically, a Gantt chart contains horizontal bars. Different lengths represent the project timeline for horizontal bars.
These can include task sequences, duration, and each task’s start and end dates. The horizontal bars also show how much of a task requires completion.
In addition, a Gantt chart helps in scheduling, managing, and monitoring specific tasks and resources.
These project timelines include scheduled and completed work over a period of time. Project managers are aided by the Gantt chart in communicating project status or plans as well. Also, it helps to ensure that the project remains on track.
Gantt charts can be created through project management software like ProScheduler. This software lets you create Gantt charts quickly and easily, so you can manage projects properly.
To sum it up, a Gantt chart shows you what needs to be done, and when.
What Is a Roadmap?
A plan and strategy are built around every team in a company. Doing this pushes the business goals forward. However, workers get lost in routine task management if they get busy executing the strategy.
This is where a roadmap comes in.
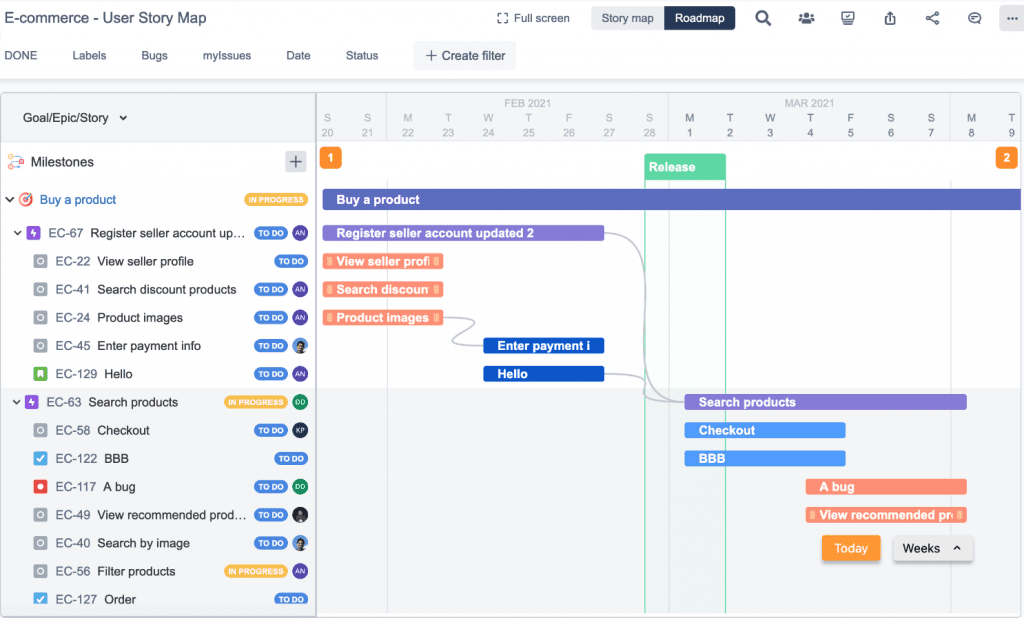
A roadmap is one of the most effective tools to help employees stay on track. In particular, a roadmap gives you a bird’s eye view of everything happening in your team or company.
Additionally, a roadmap can serve as a communication tool. It can also help with strategic thinking. Roadmaps can also help you understand the why behind the goal and the plan.
Project managers and owners should use roadmaps in line with two strategic reasons.
For one, project roadmaps serve as an ongoing reminder of the strategic objectives of a project. Through this, teams make progress on any complex project.
Second, roadmaps should be used by project managers because they can use them to set expectations. Roadmaps can also help in earning buy-ins and quickly updating other stakeholders including executives and investors.
What Is a Timeline?
Time is a crucial factor in any project. However, keeping track of multiple things happening simultaneously can be hard in the long run. This is where a timeline comes in.
As its name suggests, a timeline is a chronological statement. A timeline is used to define a certain chain of events or activities that happened at a particular phase.
Visually speaking, a timeline is a representation of data. It can be visualized through lists, tables, or graphics.
Just like a flowchart, a timeline helps users identify specific patterns in a scheme. It also helps determine the course of a process using a streamlined format.
Interestingly, a timeline is easy to make and look at. It’s also handy to work with. Timelines make it easier to manage and remember important tasks and goals as well.
A lot of enterprises mainly use timelines to track the progress of a project or plan.
Gantt Chart vs. Roadmap vs. Timeline: Comparison
A Gantt chart helps a team set a plan. This plan specifies how a project will be completed.
On the other hand, a roadmap helps a team define and communicate why a plan should be completed.
Meanwhile, a timeline is a chronological description of tasks, goals, and the like.
So, in a sense, a Gantt chart and roadmap can include or be called timelines. However, not all timelines can be called Gantt charts and roadmaps.
Using a Gantt chart is the most common way to visualize a timeline. It details all the tasks, deadlines, and resources that are needed for a project’s success. On the other hand, a roadmap provides a macro view of a project’s development.
On top of that, a roadmap shows the general work for and the end date of a project. Conversely, a Gantt chart specifically shows all the phases of work required to meet a deadline. A Gantt chart also features dependencies between tasks and milestones that can affect deadlines or delivery dates.
Here’s a table comparing a Gantt chart, roadmap, and timeline:
| Gantt Chart | Roadmap | Timeline | |
| Definition | Shows the sequence of tasks that need to be completed | Shows a general view of what must happen for a team or company to reach its goals | Shows a certain chain of events or activities |
| Main Purpose | To visualize a timeline | To provide a macro view of a project’s development | To provide a chronological statement of events |
| Usual Features | Dates, tasks, bars, milestones | Objectives, steps, dates | Dates, events |
| When to Use | Visualize work timeline | Visualize work objectives | Show the sequence of work activities or events |
Conclusion
Gantt charts, road maps, and timelines are necessary for project management. However, Gantt charts and roadmaps serve various purposes.
Fortunately, you don’t have to choose between the three. When used properly, all of them can work together to help a team combine their plan’s strategic elements.
Published at DZone with permission of Tam Nguyen. See the original article here.
Opinions expressed by DZone contributors are their own.
Comments