Getting Started with Eclipse Jifa
In this blog post, discover how you can use Eclipse Jifa to identify potential performance bottlenecks in your Java applications.
Join the DZone community and get the full member experience.
Join For FreeI have been posting multiple videos about the Performance Engineering Series on the QAInsights channel, which will help you to get started with troubleshooting Java applications. In this blog post, we are going to see how you can use Eclipse Jifa to identify potential performance bottlenecks in your Java applications. Let us get started.
Eclipse Jifa
Eclipse Jifa (Java Issue Finder Assistant) is an open-source application to troubleshoot Java applications. The inception phase of Jifa was back in 2020 by Alibaba under the Eclipse Foundation. Developers from Netflix, Alibaba Cloud, and other developers are contributing to the Jifa project.
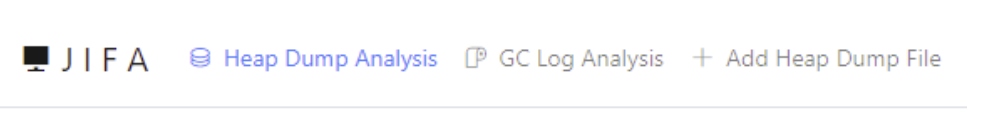
Jifa is a scalable web-based application, easy to deploy, and maintain. Right now, it supports the following analysis: Heap Dump, Thread Dump (an enterprise feature), and GC Log.
Jifa's frontend is Vue 2.0, and the backend is Eclipse Vert.x. Jifa's analytical engine consists of Heap Dump service and GC Log Analyzer.
Scalability can be achieved by deploying Jifa in a Master-Worker fashion, also known as the Map-Reduce pattern. Most of the performance testing tools use this technique to generate more load for the target application.
Install
There are multiple ways you can follow to install Jifa. The easiest way is to run the Docker container using the below command.
docker run -p 8102:8102 jifadocker/jifa-worker:demoJifa also supports Kubernetes and Master-Worker patterns for scalability, or you can build the artifacts using Gradle and deploy.
For personal use, I'd recommend Docker mode. For enterprise use, please use Master-Worker or Kubernetes patterns for the enterprise features.
Master-Worker Deployment
Before you get started, please make sure you have nodejs, npm, Gradle and JDK 11 is installed.
git clone https://github.com/eclipse/jifa
./gradlew buildJifa
cd jifa/deploy/default_pattern
./deploy_jifa.sh
Launch 127.0.0.1:8089
cd deploy
./deploy_worker.sh
Launch 127.0.0.1:8102.
In Master-Worker mode, master node routes the user requests from the client to the workers and schedules new workers on-demand.
worker nodes perform the analysis.
Kubernetes
cd scripts/docker_images
./build_image.sh
cd ../..
cd deploy/k8s_pattern
./deploy.sh
Launch localhost:8089
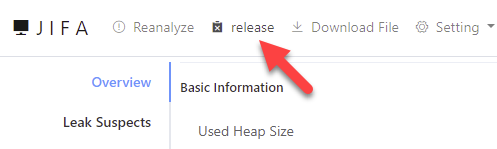
release button.
Heap Dump Analysis
Let us upload a sample heap dump to Jifa and play around with the features. There are multiple ways you can generate a heap dump. In this demo, I am going to upload a heap dump from JMeter, but you can upload any heap dump you want.
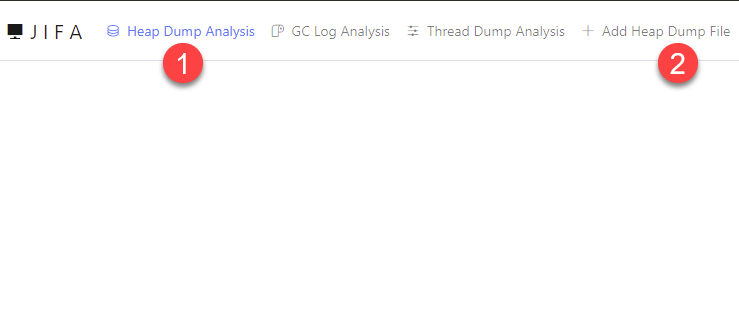
Launch Jifa, click on Heap Dump Analysis > Add Heap Dump file to upload the file.
Jifa supports various sources such as S3, OSS, URL, SCP or local for upload the file. Drag and drop the heap dump file (OpenJDK HPROF format) or click the Upload icon to upload.
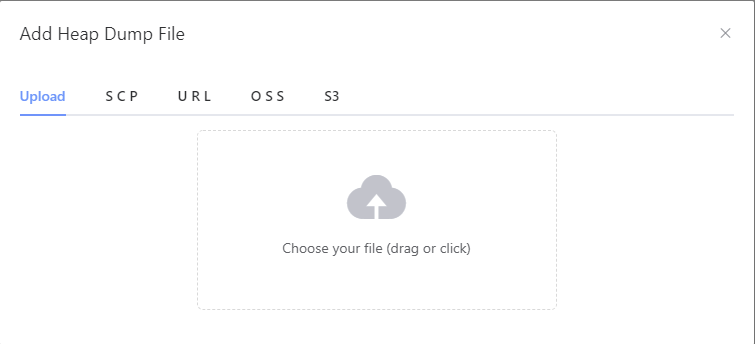
Click analyze to get started. Check keep unreachable objects and click Confirm.

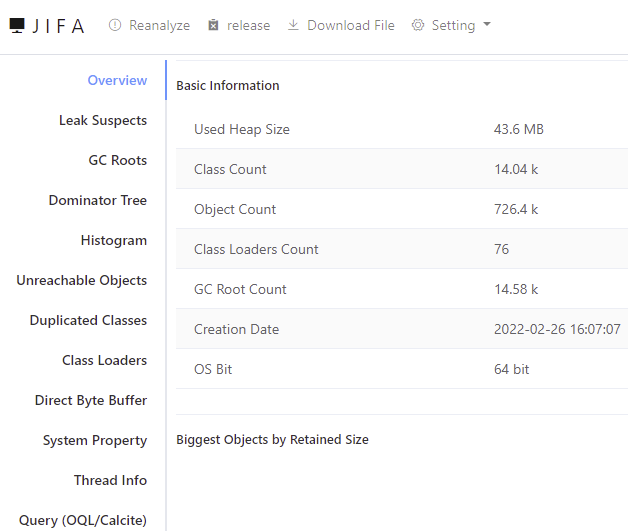
- Overview
- Leak Suspects
- GC Roots
- Dominator Tree
- Class Histogram
- Unreachable Objects
- Duplicated Classes
- Class Loaders
- Direct Byte Buffer
- System Property
- Thread Info
- OQL
- Other features
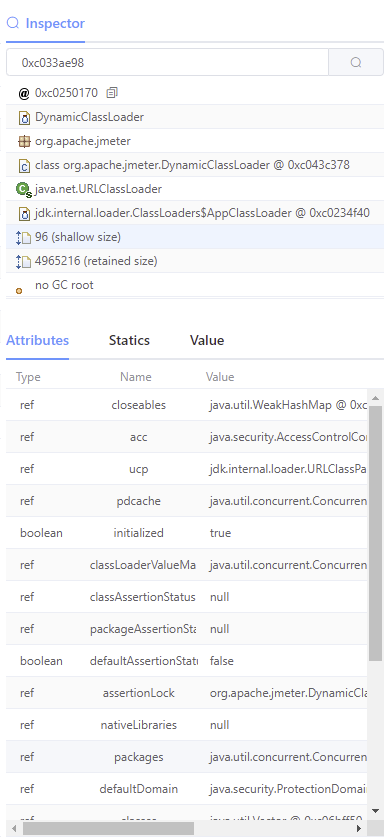
Jifa features an inspector panel where the search using the object address is possible to dive into the respective object. The Inspector panel can be toggled on/off under Settings.
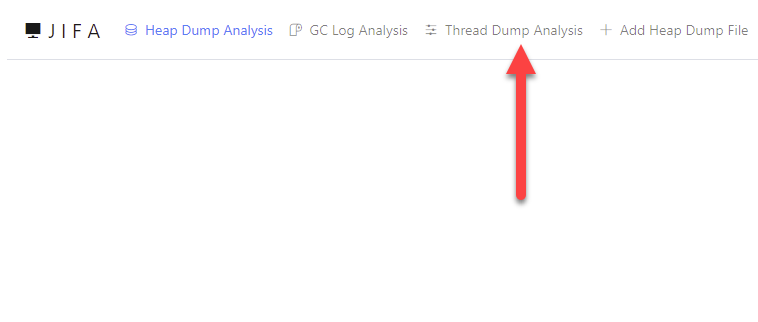
Thread Dump Analysis
Go to Jifa home page and click on Thread Dump Analysis to upload a sample thread dump. Analyze the thread dump to view the output. Thread dump analysis helps to identify issues like thread locks, deadlocks, to understand threads' state and more.
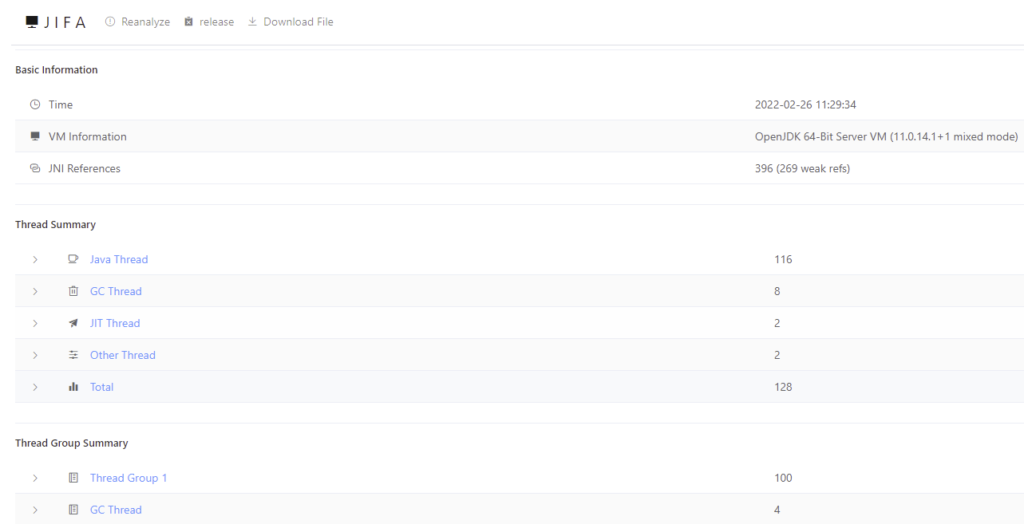
- Basic Information
- Thread Overview
- Thread Group Overview
- Java Monitor
- Stack Trace
- Raw content
GC Log Analysis
Garbage Collection Log analysis helps to optimize GC settings, memory management and more. To generate a GC log, pass the -verbose:gc -Xlog:gc*:file=./gc.log to the JVM arguments for Java 9 or above. This will generate a GC log in the current directory.
Upload gc.log to Jifa to analyze.
Jifa supports the following for GC log analysis:
- OpenJDK 8 and 11
- Serial GC, Parallel GC, CMS GC, G1 GC, ZGC

The Overview tab features the problems and suggestions, metadata, and Key Performance Indicators.
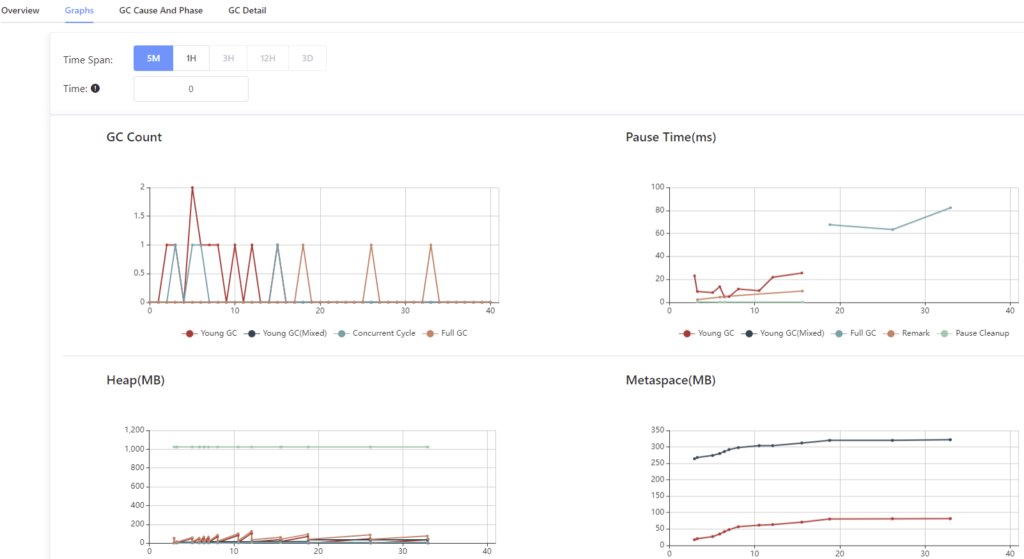
Graph tab features visualizations about GC count, pause time, heap, and more.
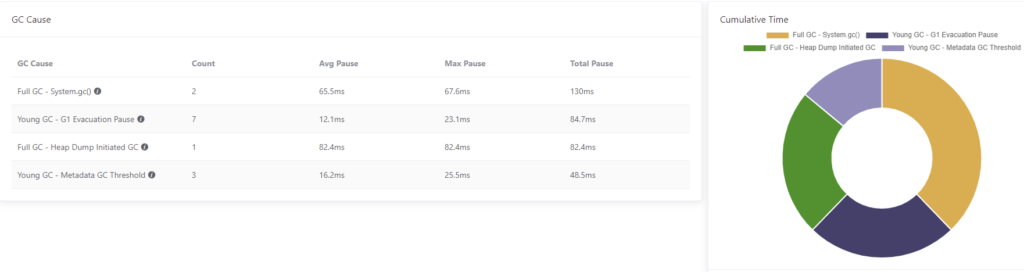
GC Cause and Phase displays about GC activities such as Full GC, Young GC, and more and the pie chart.
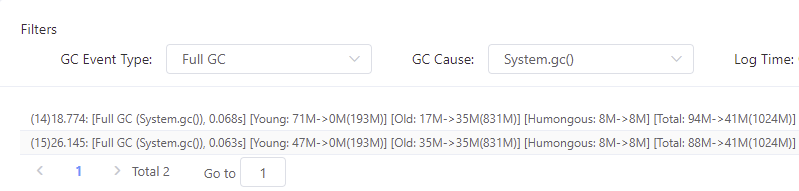
GC Detail tab helps to filter the GC events, log time, and more.
Conclusion
Jifa is a great tool to identify potential memory leaks, thread issues for Java applications. If you do not have the ability to install GUI based tools like MAT, VisualVM, or if you do not have high memory to process large dump files, then Jifa can help you. Jifa supports multiple sources to upload the dump/log file. Jifa user interface is intuitive and easy to navigate. But navigating tree structure is cumbersome.
GC Log analysis in JIFA provides problems and suggestions, but for heap dump and thread dump, you need to wear a detective hat to troubleshoot the problems.
Published at DZone with permission of NaveenKumar Namachivayam. See the original article here.
Opinions expressed by DZone contributors are their own.
Comments