Getting Started With Prometheus Workshop: Exploring Basic Queries
In this tutorial, you'll continue your open-source observability journey exploring basic Prometheus queries using PromQL.
Join the DZone community and get the full member experience.
Join For FreeAre you looking to get away from proprietary instrumentation? Are you interested in open-source observability, but lack the knowledge to just dive right in? This workshop is for you, designed to expand your knowledge and understanding of open-source observability tooling that is available to you today.
Dive right into a free, online, self-paced, hands-on workshop introducing you to Prometheus. Prometheus is an open-source systems monitoring and alerting tool kit that enables you to hit the ground running with discovering, collecting, and querying your observability today. Over the course of this workshop, you will learn what Prometheus is, what it is not, install it, start collecting metrics, and learn all the things you need to know to become effective at running Prometheus in your observability stack.
Previously, I shared an introduction to Prometheus, installing Prometheus, and an introduction to the query language as free online workshop labs. In this article, you'll continue your journey exploring basic Prometheus queries using PromQL.
Your learning path continues in this article with the exploration of a few basic PromQL queries. Note this article is only a short summary, so please see the complete lab found online here to work through it in its entirety yourself:
The following is a short overview of what is in this specific lab of the workshop. Each lab starts with a goal. In this case, it is fairly simple:
- This lab dives into using PromQL to explore basic querying so that you can use it to visualize collected metrics data.
You'll start off by getting comfortable selecting metrics and at the same time learning the basic definitions of metrics query terminology. Each query is presented for you to cut and paste into your own Prometheus expression browser and followed by an example output so that you see what the query is doing.
These examples have been generated on a system running for several hours giving them more color and diversity when graphing data results that you might see if you are quickly working self-paced through this workshop. This doesn't take away from the exercise; it's meant to provide a bit more extensive example results than you might be seeing yourself.
Next, you'll learn about how to filter your query results as you narrow the sets of data you're selecting using metric labels, also known as metric dimensions. You'll explore matching operators, filtering with regular expressions, dig into instant vectors, range vectors, learn about time-shifting, explore a bunch of ways to visualize your data in graphs, take a side step into the discussion around the functions without and by, and finally, learn how to use math in your queries.
Selecting Data
The very basic beginning of any query language is being able to select data from your metrics collection. You'll kick this lab off learning about the basic terminology involved with your metrics queries, such as:
- Metric name - Querying for all time series data collected for that metric
- Label - Using one or more assigned labels filters metric output
- Timestamp - Fixes a query single moment in the time of your choosing
- Range of time - Setting a query to select over a certain period of time
- Time-shifted data - Setting a query to select over a period of time while adding an offset from the time of query execution (looking in the past)
Applying all of these you'll quickly start selecting metrics by name, such as the metric below from the services demo you set up in a previous lab:
demo_api_request_duration_seconds_count
This query, when entered in your Prometheus expression browser will result in something like the following query results:

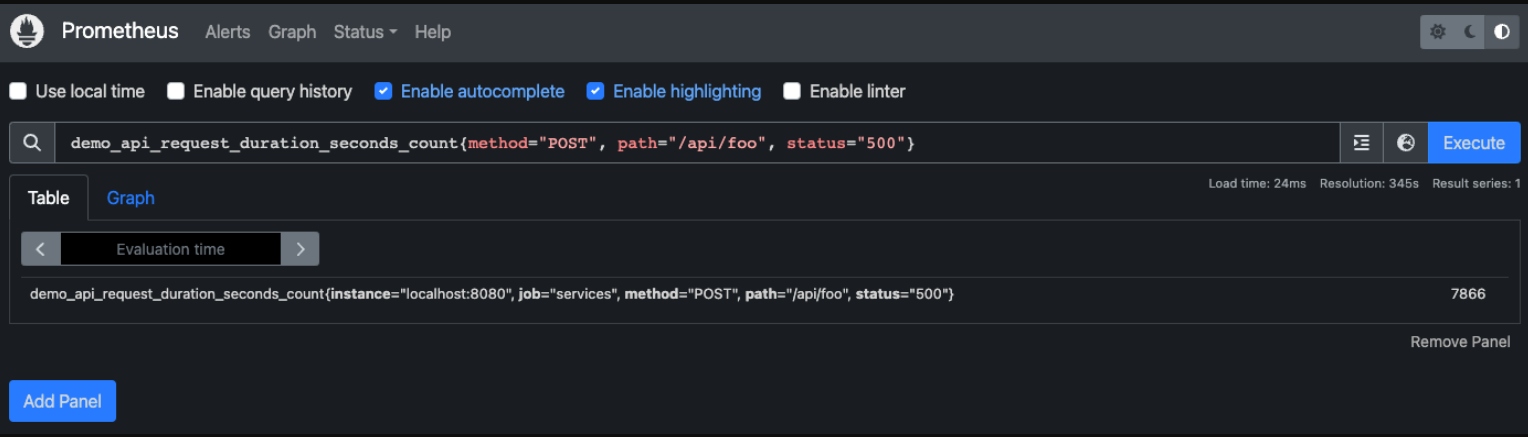
You'll continue to learn how to filter using labels, and how to narrow down your query results and metrics dimensions. After several iterations, you'll eventually find the data you're looking for with the following selection query filtering with multiple labels:
demo_api_request_duration_seconds_count{method="POST", path="/api/foo", status="500"}
The final results are much more refined than where you started:
This wraps up the selection query section and sends you onward to having hands-on practical experience with selection queries.
More Ways to Skin Your Data
While using the equals operator is one way to select and filter data, there are more ways to approach it. The next section spends some time sharing how you can use regular expressions in your queries. This wraps up with you learning that up to now you've done queries selecting the single latest value for all time series data found, better known as an instant vector.
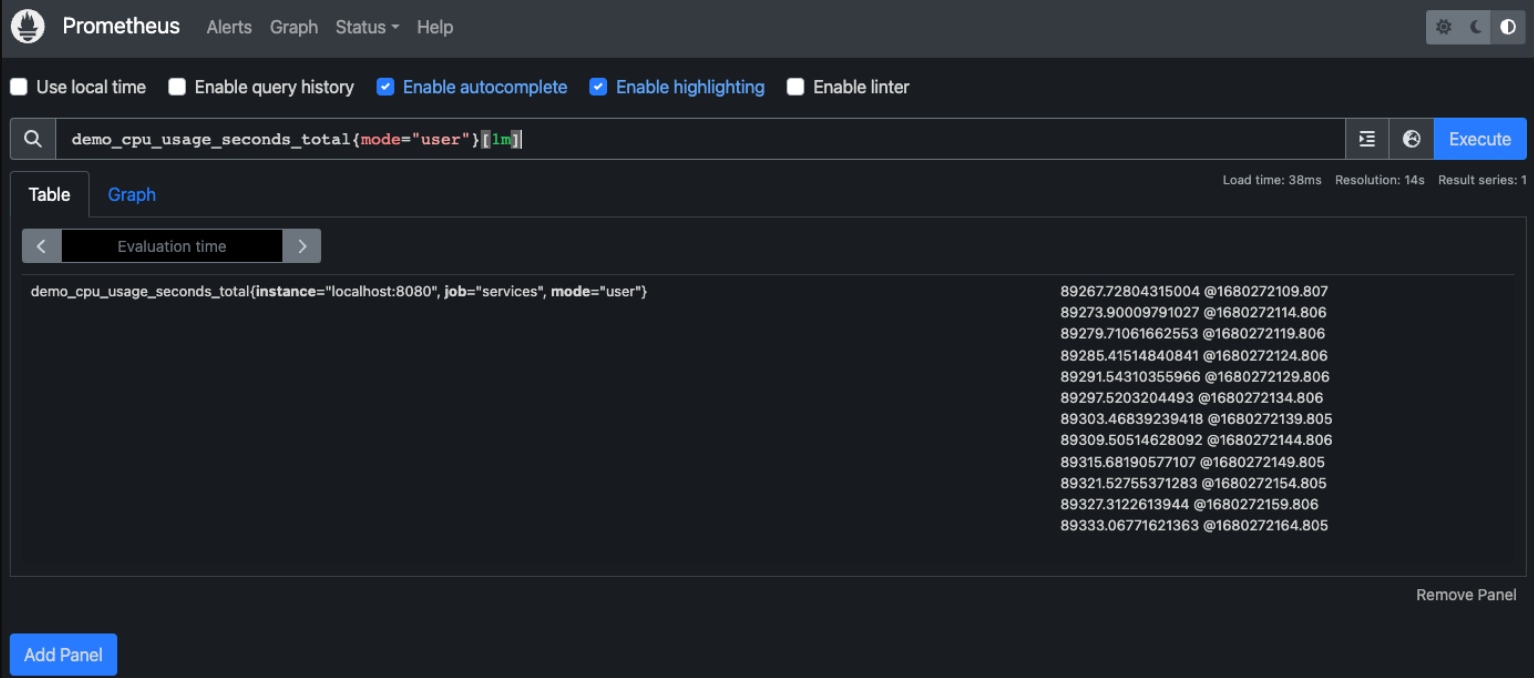
You are now introduced to the concept of a range vector, or queries using functions that require a range of values. They have a duration specifier in the form of [number, unit]; for example, the following query selects all user CPU usage over the last minute:
demo_cpu_usage_seconds_total{mode="user"}[1m]
Resulting in the following display of all the values found over the last minute for this metric:
Next, you'll learn how to take the range vectors and apply a little time-shifting to look at a window of data in the past, something that is quite common in troubleshooting issues after the fact.
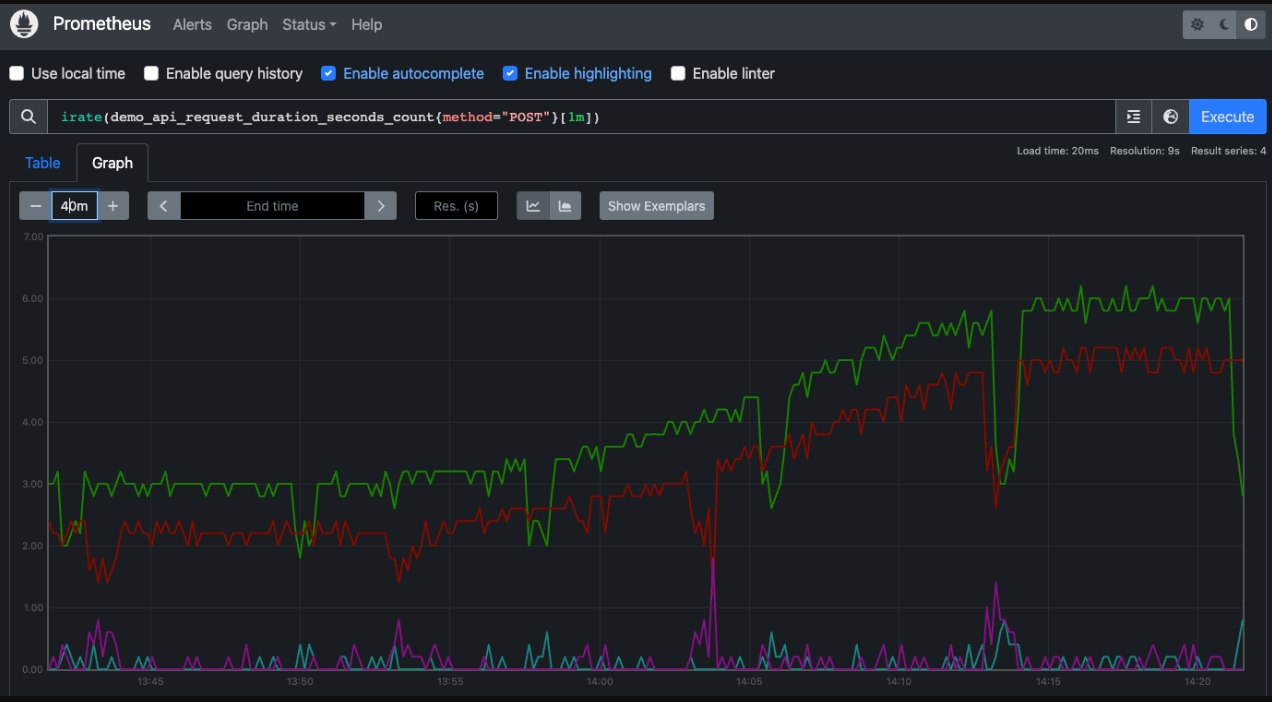
While this can be fun, one of the most common things you'll want to see in your data is how some metric has changed over a certain period of time. This is done using the rate function and you'll explore both this and its helper, the irate function. Below is the rate query:
rate(demo_api_request_duration_seconds_count{method="POST"}[1m])
And the corresponding results in a graph:
While these functions up to now have visualized counters in graph form, you have many other types of metrics you'll want to explore, such as gauge metrics. You'll spend time exploring all these examples and running more queries to visualize gauge metrics.
This leads to a bit of a more complex issue. What do you do with queries where you want to aggregate over highly dimensional data in your queries? This requires simplifying and creating a less detailed view of the data results with functions like sum, min, max, and avg. These do not aggregate over time, but across multiple series at each point in time.
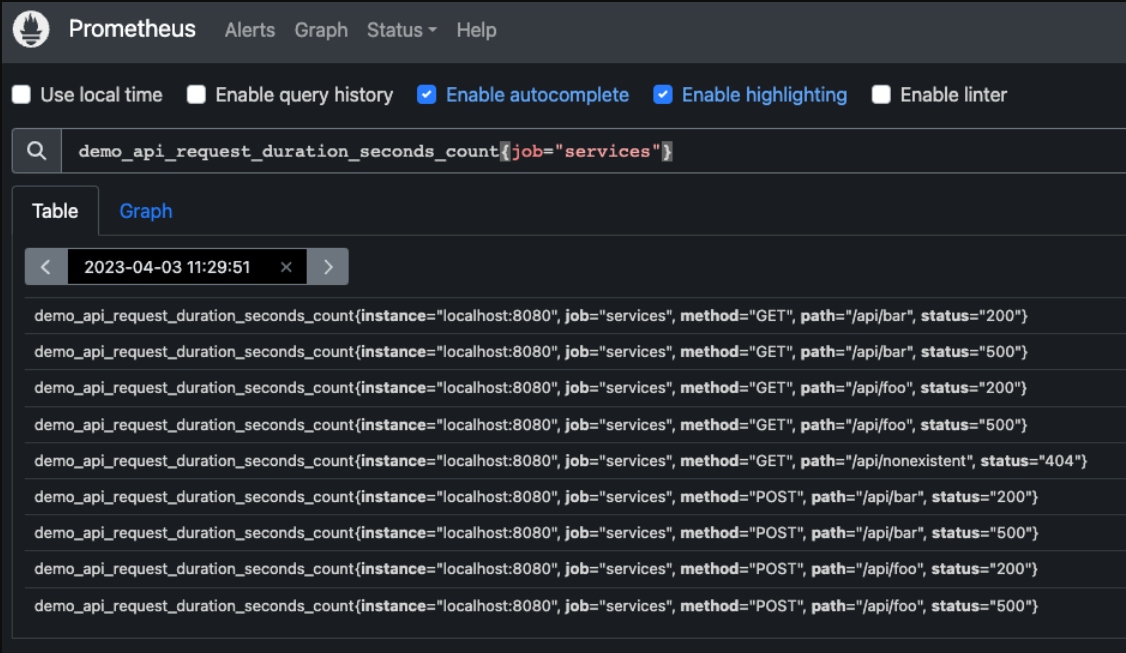
The following query will give you a table view of all the dimensions you have at a single point in time with this metric:
demo_api_request_duration_seconds_count{job="services"}
The results are showing that this metric is highly dimensional:
In this example, you are going to use the sum function, look across all the previous dimensions for a five-minute period of time, and then look across all captured time series data:
sum(
  rate(demo_api_request_duration_seconds_count{job="services"}[5m])
)
The resulting graph shows the sum across highly dimensional metrics:
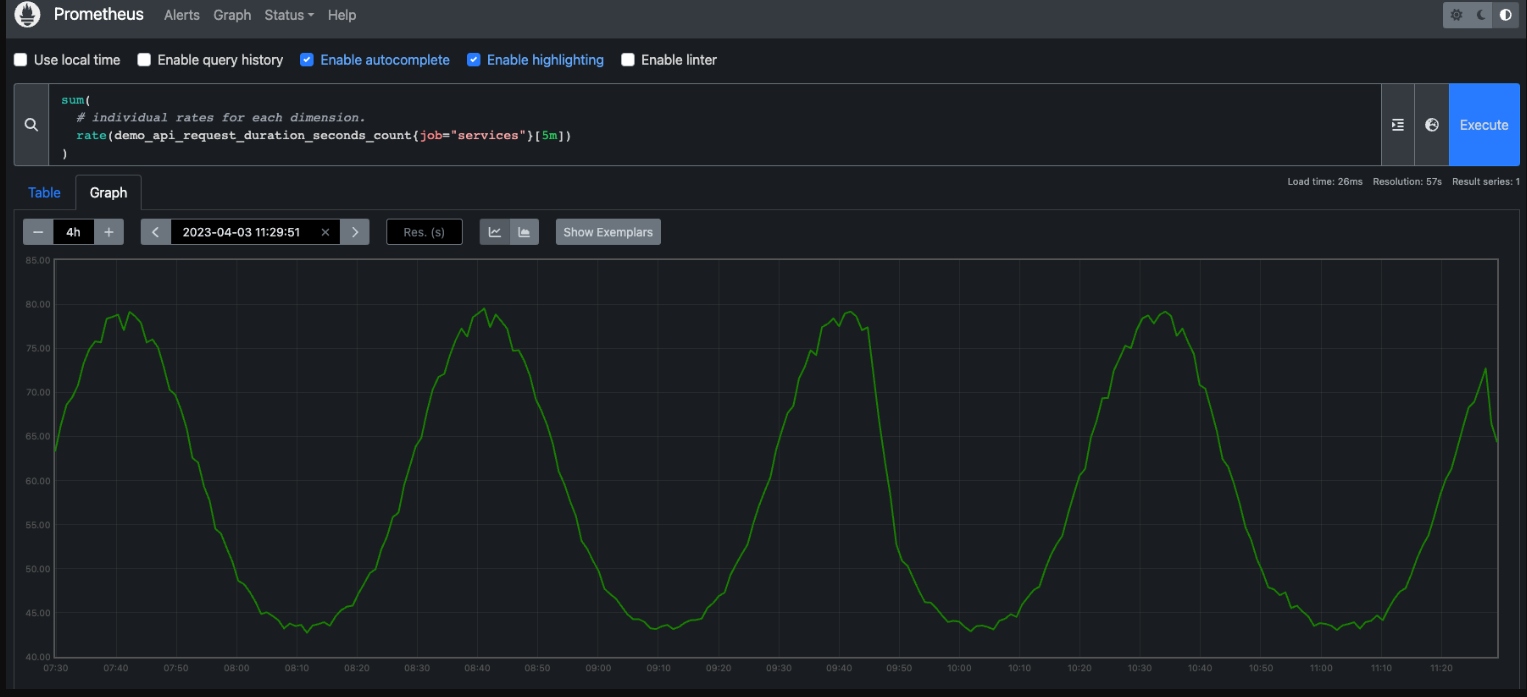
You'll work through the entire list of aggregation functions, testing most of them in hands-on query examples using your demo installation to generate visualizations of your time series data collection.
You'll finish up this lab by learning about how to apply arithmetic, or math to your queries. You'll sum it all up with a query to calculate per-mode CPU usage divided by the number of cores to find a per-core usage value of 0 to 1. To make it more interesting, the metrics involved have mismatched dimensions, so you'll be telling it to group by the one extra label dimension.
It all sounds like a complex problem you have no idea how to solve? Don't worry, this entire lab builds you from the ground up to reach this point. You will be running this query to solve this problem and ready for the next more advanced query lab coming up!
Missed Previous Labs?
This is one lab in the more extensive free online workshop. Feel free to start from the very beginning of this workshop here if you missed anything previously:
You can always proceed at your own pace and return any time you like as you work your way through this workshop. Just stop and later restart Perses to pick up where you left off.
Coming Up Next
I'll be taking you through the following lab in this workshop where you'll continue learning about the PromQL and dig deeper into advanced queries to gain more complex insights into your collected metrics. Stay tuned for more hands-on material to help you with your cloud-native observability journey.
Published at DZone with permission of Eric D. Schabell. See the original article here.
Opinions expressed by DZone contributors are their own.
Comments