Golang: Is It a Memory Leak?
Figuring out where memory went in Go is tricky. This article explores lessons learned and how to pinpoint the exact allocations in a 3rd party library.
Join the DZone community and get the full member experience.
Join For FreeThis is an illustrated walkthrough for how to find the cause of high memory usage in Go programs with standard tools, based on our recent experience. There's plenty of information online, but it still took us considerable time and effort to find what works and what doesn't. Hopefully, this post will save time for everyone else.

Context
At Adiom, we're building an open-source tool for online database migration and real-time replication, called dsync. Our primary focus is on ease of use, robustness, and speed. One of the areas that we're focusing on heavily is data integrity, as Enterprise customers want to ensure data consistency between the source and the destination and know the differences, if there are any.
To that end, we have recently come across Merkle Search Trees (MST) that have some interesting properties. It may be worth a whole different post, but for those interested now, here's the link to the original paper. In theory, MSTs should allow us to efficiently and cheaply diff the source and destination datasets. Naturally, we wanted to experiment with that, so we added a dsync verify <source> <destination> command as a POC leveraging an open-source reference implementation from GitHub: jrhy/mast. It worked like a charm on "toy" datasets from 100 to 1000 records. But in one of our larger tests, to our surprise, the binary consumed 3.5GB RAM for a million records on both sides. While not a whole lot in absolute numbers, this was orders of magnitude higher than what we were expecting — maybe 10s or 100s of megabytes — because we only stored the record ID (8 bytes) and a hash (8 bytes) for each record.
Our first thought was a memory "leak." Similar to Java, Go manages memory for you and has a garbage collector based on open object references. There's no concept of leaks as such, but rather unexpected or undesirable accumulation of objects that the code kept references to. Unlike Java though, Go doesn't run as byte code on top of a JVM, so it doesn't know which specific objects are accumulating in memory.
Part 1: Run Garbage Collector
In Go, you can forcefully trigger garbage collection hoping that the memory is consumed by objects that are no longer needed:
func main() {
	// App code

	log.Println("Triggering garbage collection...")
	runtime.GC()
	printMemUsage()

  	// More app code
}

func printMemUsage() {
	var m runtime.MemStats
	runtime.ReadMemStats(&m)
	log.Printf("Alloc = %v MiB", bToMb(m.Alloc))
	log.Printf("TotalAlloc = %v MiB", bToMb(m.TotalAlloc))
	log.Printf("Sys = %v MiB", bToMb(m.Sys))
	log.Printf("NumGC = %v\n", m.NumGC)
}
Unfortunately, that only freed up a few hundred MBs for us, so it wasn't very effective.
Part 2: Examine the Memory
In theory, we should be able to do the coredump of the process (dump the raw memory) and then examine it directly. Here are some relevant resources for that:
- Obtaining the core dump from a running process: Go Wiki: CoreDumpDebugging
- Specific instructions for Mac OS where
gcoredoesn't work right away: "How to Dump a Core File on MacOS" - The
viewcoretool to parse thecoredump: GitHub: golang/debug
Unfortunately, the viewcore didn't work with our coredump, presumably because we're doing development on a Mac laptop with Darwin architecture:
user@MBP viewcore % ./viewcore /cores/dsync-52417-20241114T234221Z html
failed to parse core: bad magic number '[207 250 237 254]' in record at byte 0x0
If you're using Linux, you should give it a shot.
Part 3: Profiling and Debugging
We had to resort to investigative debugging instead. The most common sources of memory leaks in Go are:
- Accumulating and not closing resources such as network connections, files, etc.
- Global variables
- Slices with large backing arrays
- Lingering Go routines that don't finish
After a brief examination of the codebase, we didn't see any smoking guns. Our next step was to use pprof. Pprof lets us sample a running process and obtain a heap dump that can later be examined.
Pprof Setup
Pprof runs as a webserver in your application. Adding it is easy:
import (
    "net/http"
    _ "net/http/pprof" // Import pprof package for profiling
)

func main() {
    go func() {
        log.Println(http.ListenAndServe("localhost:8081", nil)) // Start pprof server
    }()
    // Your application logic here
}
In our case, it's accessible on port 8081.
When the application is running and shows excessive memory consumption, we can collect heap dumps:
curl -s http://localhost:8081/debug/pprof/heap > /tmp/heap1.outI recommend collecting a few just to have a few different samples. Note that pprof actually samples information about allocations, so it's not going to be a 100% representation. By default, it's 1 sample per 512kb allocated.
From here on out, it's really smooth sailing.
Memory Profiling
We examined inuse_space and inuse_objects with pprof that track the active space and the number of objects respectively:
go tool pprof --inuse_objects /tmp/heap1.out
go tool pprof --inuse_space /tmp/heap1.out
The in-use space was particularly fruitful. First, we tried to visualize the memory allocation using the web command, which opens a new web browser window.
user@MBP viewcore % go tool pprof --inuse_space /tmp/heap1.out
File: dsync
Type: inuse_space
Time: Nov 14, 2024 at 5:34pm (PST)
Entering interactive mode (type "help" for commands, "o" for options)
(pprof) web
(pprof)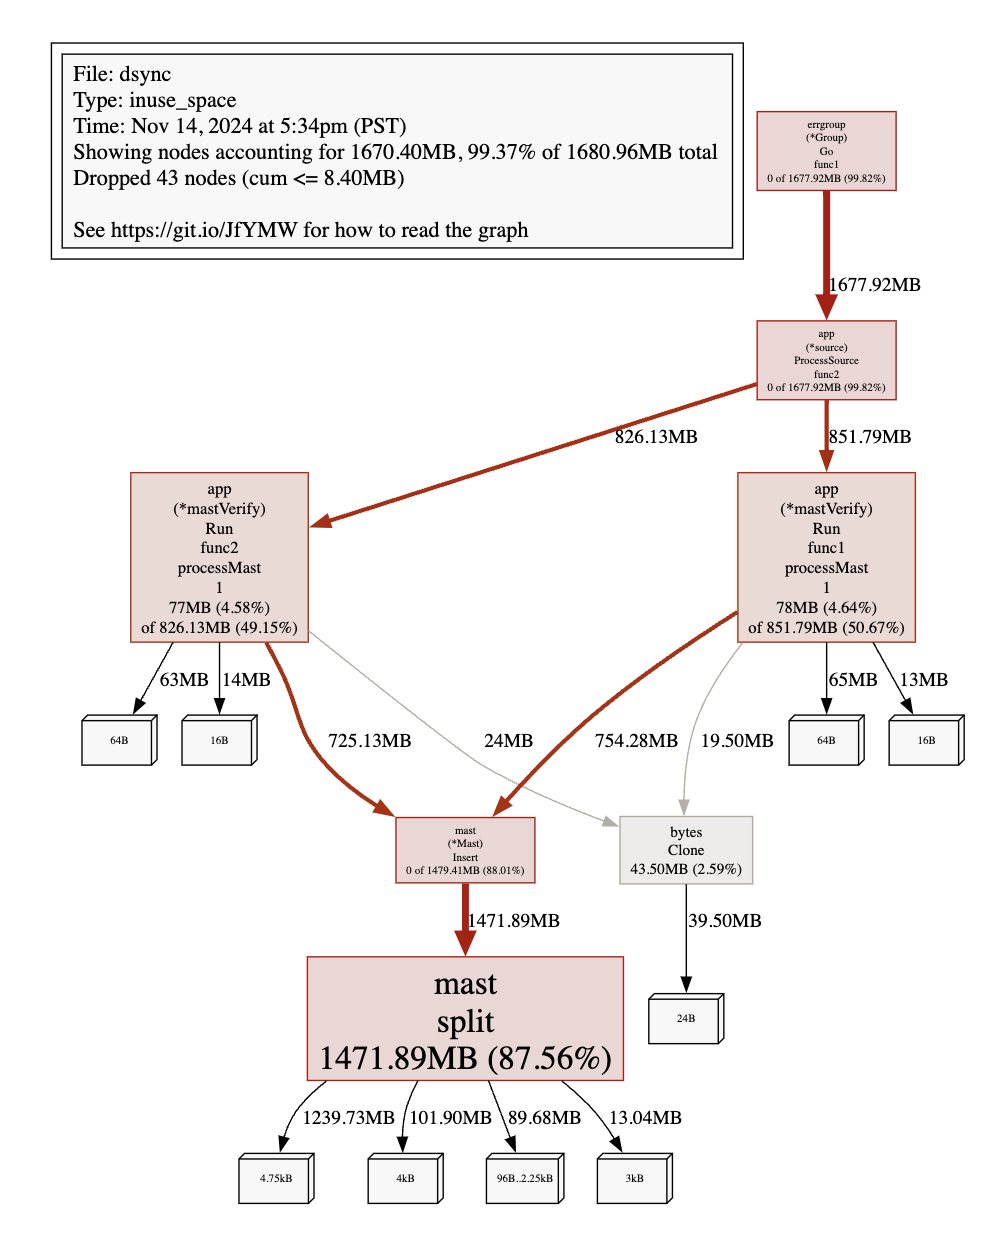
The thicker the link on the graph, the more memory went to that node (and that node is bigger, too). An alternative way to do this is to use the top5 command:
user@MBP viewcore % go tool pprof --inuse_space /tmp/heap1.out
File: dsync
Type: inuse_space
Time: Nov 14, 2024 at 5:34pm (PST)
Entering interactive mode (type "help" for commands, "o" for options)
(pprof) top5
Showing nodes accounting for 1670.40MB, 99.37% of 1680.96MB total
Dropped 43 nodes (cum <= 8.40MB)
Showing top 5 nodes out of 7
      flat  flat%   sum%        cum   cum%
 1471.89MB 87.56% 87.56%  1471.89MB 87.56%  github.com/jrhy/mast.split
      78MB  4.64% 92.20%   851.79MB 50.67%  github.com/adiom-data/dsync/internal/app.(*mastVerify).Run.func1.processMast.1
      77MB  4.58% 96.78%   826.13MB 49.15%  github.com/adiom-data/dsync/internal/app.(*mastVerify).Run.func2.processMast.1
   43.50MB  2.59% 99.37%    43.50MB  2.59%  bytes.Clone
         0     0% 99.37%  1677.92MB 99.82%  github.com/adiom-data/dsync/internal/app.(*source).ProcessSource.func2
(pprof)
These told us that the excessive memory was allocated in the mast.split function, and that it is a lot of 4.75kB objects.
While we can't see what those objects are, we can see where in the code they were allocated using the list command:
user@MBP viewcore % go tool pprof --inuse_space /tmp/heap1.out
File: dsync
Type: inuse_space
Time: Nov 14, 2024 at 5:34pm (PST)
Entering interactive mode (type "help" for commands, "o" for options)
(pprof) top5
Showing nodes accounting for 1670.40MB, 99.37% of 1680.96MB total
Dropped 43 nodes (cum <= 8.40MB)
Showing top 5 nodes out of 7
      flat  flat%   sum%        cum   cum%
 1471.89MB 87.56% 87.56%  1471.89MB 87.56%  github.com/jrhy/mast.split
      78MB  4.64% 92.20%   851.79MB 50.67%  github.com/adiom-data/dsync/internal/app.(*mastVerify).Run.func1.processMast.1
      77MB  4.58% 96.78%   826.13MB 49.15%  github.com/adiom-data/dsync/internal/app.(*mastVerify).Run.func2.processMast.1
   43.50MB  2.59% 99.37%    43.50MB  2.59%  bytes.Clone
         0     0% 99.37%  1677.92MB 99.82%  github.com/adiom-data/dsync/internal/app.(*source).ProcessSource.func2
(pprof) list github.com/jrhy/mast.split
Total: 1.64GB
ROUTINE ======================== github.com/jrhy/mast.split in /Users/alexander/go/pkg/mod/github.com/jrhy/[email protected]/lib.go
    1.44GB     1.54GB (flat, cum) 93.57% of Total
         .          .     82:func split(ctx context.Context, node *mastNode, key interface{}, mast *Mast) (leftLink, rightLink interface{}, err error) {
         .          .     83:	var splitIndex int
         .          .     84:	for splitIndex = 0; splitIndex < len(node.Key); splitIndex++ {
         .          .     85:		var cmp int
         .          .     86:		cmp, err = mast.keyOrder(node.Key[splitIndex], key)
         .          .     87:		if err != nil {
         .          .     88:			return nil, nil, fmt.Errorf("keyCompare: %w", err)
         .          .     89:		}
         .          .     90:		if cmp == 0 {
         .          .     91:			panic("split shouldn't need to handle preservation of already-present key")
         .          .     92:		}
         .          .     93:		if cmp > 0 {
         .          .     94:			break
         .          .     95:		}
         .          .     96:	}
         .          .     97:	var tooBigLink interface{} = nil
       8MB        8MB     98:	left := mastNode{
         .          .     99:		Node{
  416.30MB   416.30MB    100:			make([]interface{}, 0, cap(node.Key)),
  458.51MB   458.51MB    101:			make([]interface{}, 0, cap(node.Value)),
  427.87MB   427.87MB    102:			make([]interface{}, 0, cap(node.Link)),
         .          .    103:		},
         .          .    104:		true, false, nil, nil,
         .          .    105:	}
         .          .    106:	left.Key = append(left.Key, node.Key[:splitIndex]...)
         .          .    107:	left.Value = append(left.Value, node.Value[:splitIndex]...)
         .          .    108:	left.Link = append(left.Link, node.Link[:splitIndex+1]...)
         .          .    109:
         .          .    110:	// repartition the left and right subtrees based on the new key
         .          .    111:	leftMaxLink := left.Link[len(left.Link)-1]
         .          .    112:	if leftMaxLink != nil {
         .          .    113:		var leftMax *mastNode
         .          .    114:		leftMax, err = mast.load(ctx, leftMaxLink)
         .          .    115:		if mast.debug {
         .          .    116:			fmt.Printf("  splitting leftMax, node with keys: %v\n", leftMax.Key)
         .          .    117:		}
         .          .    118:		if err != nil {
         .          .    119:			return nil, nil, fmt.Errorf("loading leftMax: %w", err)
         .          .    120:		}
         .    91.39MB    121:		leftMaxLink, tooBigLink, err = split(ctx, leftMax, key, mast)
         .          .    122:		if err != nil {
         .          .    123:			return nil, nil, fmt.Errorf("splitting leftMax: %w", err)
         .          .    124:		}
         .          .    125:		if mast.debug {
         .          .    126:			fmt.Printf("  splitting leftMax, node with keys: %v is done: leftMaxLink=%v, tooBigLink=%v\n", leftMax.Key, leftMaxLink, tooBigLink)
         .          .    127:		}
         .          .    128:		left.Link[len(left.Link)-1] = leftMaxLink
         .          .    129:	}
         .          .    130:	if !left.isEmpty() {
         .          .    131:		leftLink, err = mast.store(&left)
         .          .    132:		if err != nil {
         .          .    133:			return nil, nil, fmt.Errorf("store left: %w", err)
         .          .    134:		}
         .          .    135:	}
       1MB        1MB    136:	right := mastNode{
         .          .    137:		Node{
   54.24MB    54.24MB    138:			make([]interface{}, 0, cap(node.Key)),
   56.75MB    56.75MB    139:			make([]interface{}, 0, cap(node.Value)),
   49.22MB    49.22MB    140:			make([]interface{}, 0, cap(node.Link)),
         .          .    141:		},
         .          .    142:		true, false, nil, nil,
         .          .    143:	}
         .          .    144:	right.Key = append(right.Key, node.Key[splitIndex:]...)
         .          .    145:	right.Value = append(right.Value, node.Value[splitIndex:]...)
         .          .    146:	right.Link = append(right.Link, node.Link[splitIndex:]...)
         .          .    147:	right.Link[0] = tooBigLink
         .          .    148:
         .          .    149:	rightMinLink := right.Link[0]
         .          .    150:	if rightMinLink != nil {
         .          .    151:		var rightMin *mastNode
         .          .    152:		rightMin, err = mast.load(ctx, rightMinLink)
         .          .    153:		if err != nil {
         .          .    154:			return nil, nil, fmt.Errorf("load rightMin: %w", err)
         .          .    155:		}
         .          .    156:		var tooSmallLink interface{}
         .     9.54MB    157:		tooSmallLink, rightMinLink, err = split(ctx, rightMin, key, mast)
         .          .    158:		if err != nil {
         .          .    159:			return nil, nil, fmt.Errorf("split rightMin: %w", err)
         .          .    160:		}
         .          .    161:		if mast.debug {
         .          .    162:			fmt.Printf("  splitting rightMin, node with keys %v, is done: tooSmallLink=%v, rightMinLink=%v",
(pprof)
Now we could clearly see what those objects were: arrays with preallocated capacity. These store the []interface{} type, which is 2 words in memory or 16 bytes on our machine (64-bit system). It must be a large number, at least on average (4.75kB / 16 bytes ~= 300). The mystery is half-solved. We weren't sure if that capacity was being used or not. So we used delve, which is a debugger for Go.
Debugging
A simple code inspection showed that those objects are part of tree nodes. To find out what they actually looked like, we used VS Code debug mode to attach to the running process and inspect these objects:
- Use the configuration to attach to the running process with the following launch.json:
{
    // Use IntelliSense to learn about possible attributes.
    // Hover to view descriptions of existing attributes.
    // For more information, visit: https://go.microsoft.com/fwlink/?linkid=830387
    "version": "0.2.0",
    "configurations": [

        {
            "name": "Attach to Process",
            "type": "go",
            "request": "attach",
            "mode": "local",
            "processId": <PID of the running process>
        }
    ]
}
2. Add a breakpoint in our verification loop where the tree objects are accessed.
This immediately let us see that the array length was often much less than the preallocated size (cap) that was set:
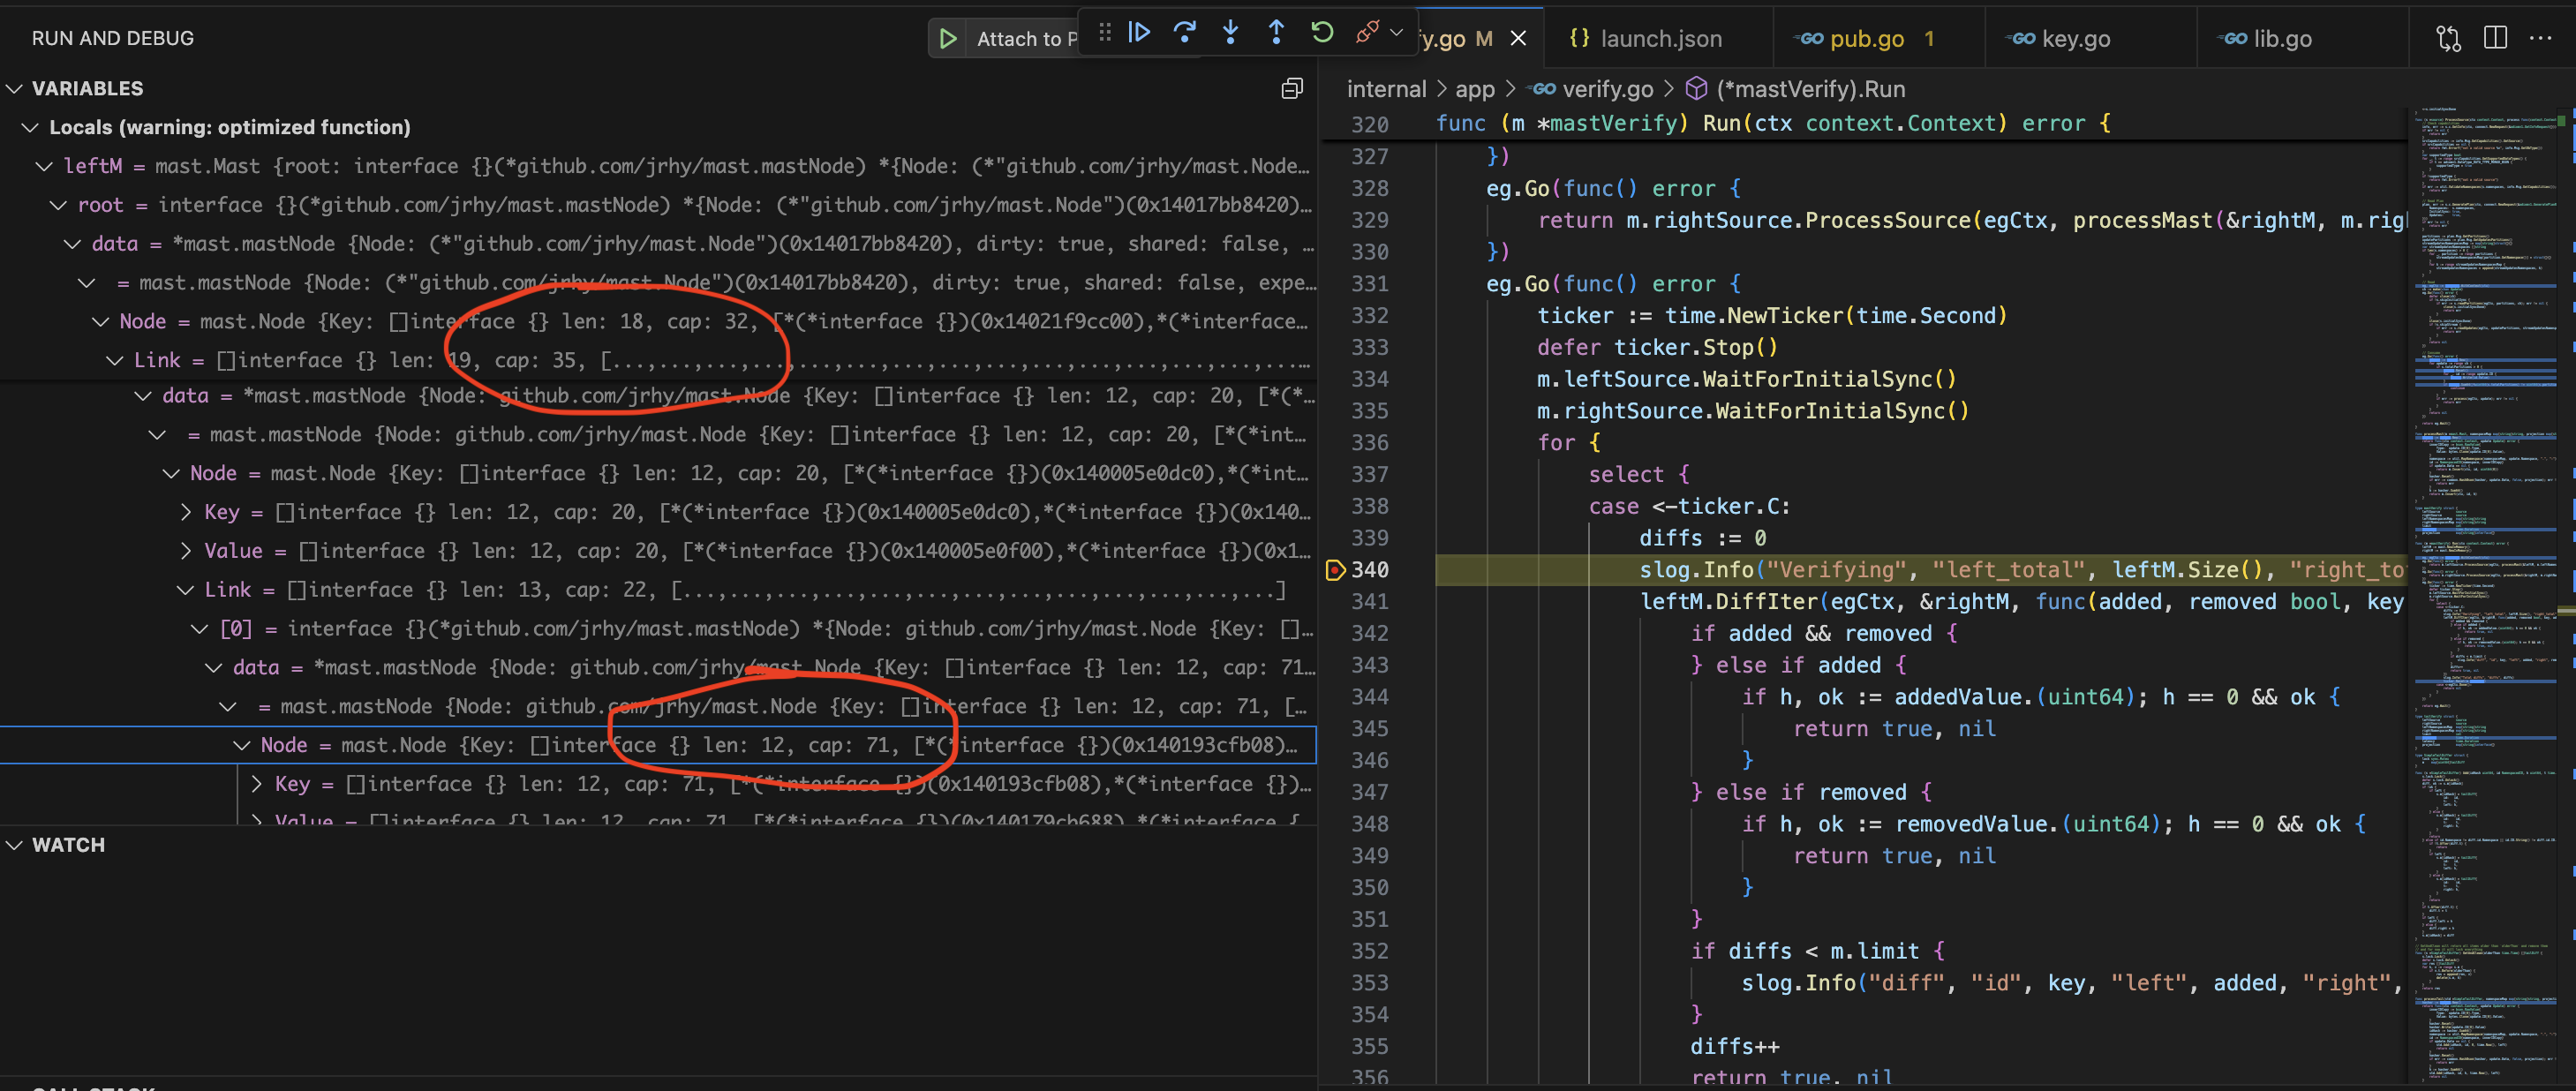
As a probe, I created a forked implementation that had no caps set in node allocation and the memory usage immediately dropped to 600MB, which is a 6x win.
Mystery solved!
Opinions expressed by DZone contributors are their own.
Comments