Prometheus and Grafana Integration With Java Applications
In this article, we will learn how to monitor Java-based applications and solutions with Prometheus and Grafana.
Join the DZone community and get the full member experience.
Join For FreeIn this article, we will learn how to monitor Java-based applications and solutions with Prometheus and Grafana.
Prometheus is an open-source monitoring and alerting tool. Prometheus can aggregate or gather data from different sources. However, Prometheus has limited visualization capability.
Grafana is also an open-source project mainly used for reporting. Grafana has strong visualization capability but it can't gather data.
Hence Prometheus and Grafana are mostly used together. Prometheus for gathering data and Grafana for visualization.
Prerequisite:
- Download Prometheus, you can download the latest version. Extract it.
- Within the Prometheus installation folder, create a monitor.yml file with the following content.
- scrape_interval is set to 10 sec, which means Prometheus will scrape/refresh data/metrics in every 10 seconds.
- targets are set to localhost:8180, which means that Prometheus will gather data/metrics from localhost:8180 which we have defined later in java agent JVM property for our Red Hat Fuse which is Java-based Enterprise solution.
global:
scrape_interval: 10s
external_labels:
monitor: 'fuse-karaf'
scrape_configs:
- job_name: 'fuse-karaf'
scrape_interval: 10s
static_configs:
- targets: [localhost:8180]
- Download Grafana, you can download the latest version. Extract it.
- Download jmx_prometheus_javaagent jar. Version 0.13.0 of jmx_prometheus_javaagent can be download quickly from here.
- Create a config.YAML file with the following content.
xxxxxxxxxx
startDelaySeconds: 0
ssl: false
lowercaseOutputName: false
lowercaseOutputLabelNames: false
Let Us First Setup Red Hat Fuse 7.6 in Karaf Mode
1. Download Red Hat Fuse 7.6 Karaf Installer. It can be downloaded quickly from Red Hat Developer Forum.
2. Unzip fuse-karaf-7.6.0.zip. Once extracted modify fuse-karaf-7.6.0.fuse-760025-redhat-00001/etc/user.properties with following content.
xxxxxxxxxx
admin = admin,_g_:admingroup
_g_\:admingroup = group,admin,manager,viewer,systembundles,ssh
3. Once extracted, modify fuse-karaf-7.6.0.fuse-760025-redhat-00001/bin/karaf script following way. Note we just need to add javaagent at line number 339 and 360. No need to modify existing configurations. I have set javaagent twice because of the if-else clause in karaf script, to make sure all conditions expose javaagent. Most of the time you need to set javaagent only once as JVM property.
xxxxxxxxxx
338 -Dkaraf.restart.jvm.supported=true \
339 -javaagent:/home/cpandey/Desktop/prometheus-grafana/jmx_prometheus_javaagent-0.13.0.jar=8180:/home/cpandey/Desktop/prometheus-grafana/config.yaml \
-----
347 else
348 ${KARAF_EXEC} "${JAVA}" ${JAVA_OPTS} \
349 -Djava.endorsed.dirs="${JAVA_ENDORSED_DIRS}" \
-----
360 -javaagent:/home/cpandey/Desktop/prometheus-grafana/jmx_prometheus_javaagent-0.13.0.jar=8180:/home/cpandey/Desktop/prometheus-grafana/config.yaml \
${KARAF_SYSTEM_OPTS} \
-----
4. Here we have provided an absolute disk path of jmx_prometheus_javaagent-0.13.0.jar and config.yaml as its option. More details of javaagent can be found in Java Documentation.
5. Start Red Hat Fuse with fuse-karaf-7.6.0.fuse-760025-redhat-00001/bin/start script.
6. After the start script waits for a few seconds. With fuse-karaf-7.6.0.fuse-760025-redhat-00001/bin/client we can access Karaf terminal. This will ensure Red Hat Fuse is up and running.
xxxxxxxxxx
[cpandey@cpandey bin]$ ./start
[cpandey@cpandey bin]$ ./client -u admin -p admin
client: JAVA_HOME not set; results may vary
Logging in as admin
____ _ _ _ _ _____
| _ \ ___ __| | | | | | __ _| |_ | ___| _ ___ ___
| |_) / _ \/ _` | | |_| |/ _` | __| | |_ | | | / __|/ _ \
| _ < __/ (_| | | _ | (_| | |_ | _|| |_| \__ \ __/
|_| \_\___|\__,_| |_| |_|\__,_|\__| |_| \__,_|___/___|
Red Hat Fuse (7.6.0.fuse-760025-redhat-00001)
http://www.redhat.com/products/jbossenterprisemiddleware/fuse/
Hit '<tab>' for a list of available commands
and '[cmd] --help' for help on a specific command.
Open a browser to http://localhost:8181/hawtio to access the management console
Hit '<ctrl-d>' or 'shutdown' to shutdown Red Hat Fuse.
Now Start and Setup Prometheus Tool
1. Start Prometheus with Prometheus-2.19.2.linux-amd64/prometheus script.
xxxxxxxxxx
[cpandey@cpandey prometheus-2.19.2.linux-amd64]$ ./prometheus --config.file=monitor.yml
level=info ts=2020-07-24T20:24:57.368Z caller=main.go:302 msg="No time or size retention was set so using the default time retention" duration=15d
level=info ts=2020-07-24T20:24:57.368Z caller=main.go:337 msg="Starting Prometheus" version="(version=2.19.2, branch=HEAD, revision=c448ada63d83002e9c1d2c9f84e09f55a61f0ff7)"
level=info ts=2020-07-24T20:24:57.368Z caller=main.go:338 build_context="(go=go1.14.4, user=root@dd72efe1549d, date=20200626-09:02:20)"
level=info ts=2020-07-24T20:24:57.368Z caller=main.go:339 host_details="(Linux 3.10.0-514.16.1.el7.x86_64 #1 SMP Fri Mar 10 13:12:32 EST 2017 x86_64 cpandey.pnq.csb (none))"
level=info ts=2020-07-24T20:24:57.368Z caller=main.go:340 fd_limits="(soft=50000, hard=50000)"
level=info ts=2020-07-24T20:24:57.368Z caller=main.go:341 vm_limits="(soft=unlimited, hard=unlimited)"
level=info ts=2020-07-24T20:24:57.370Z caller=main.go:678 msg="Starting TSDB ..."
level=info ts=2020-07-24T20:24:57.370Z caller=web.go:524 component=web msg="Start listening for connections" address=0.0.0.0:9090
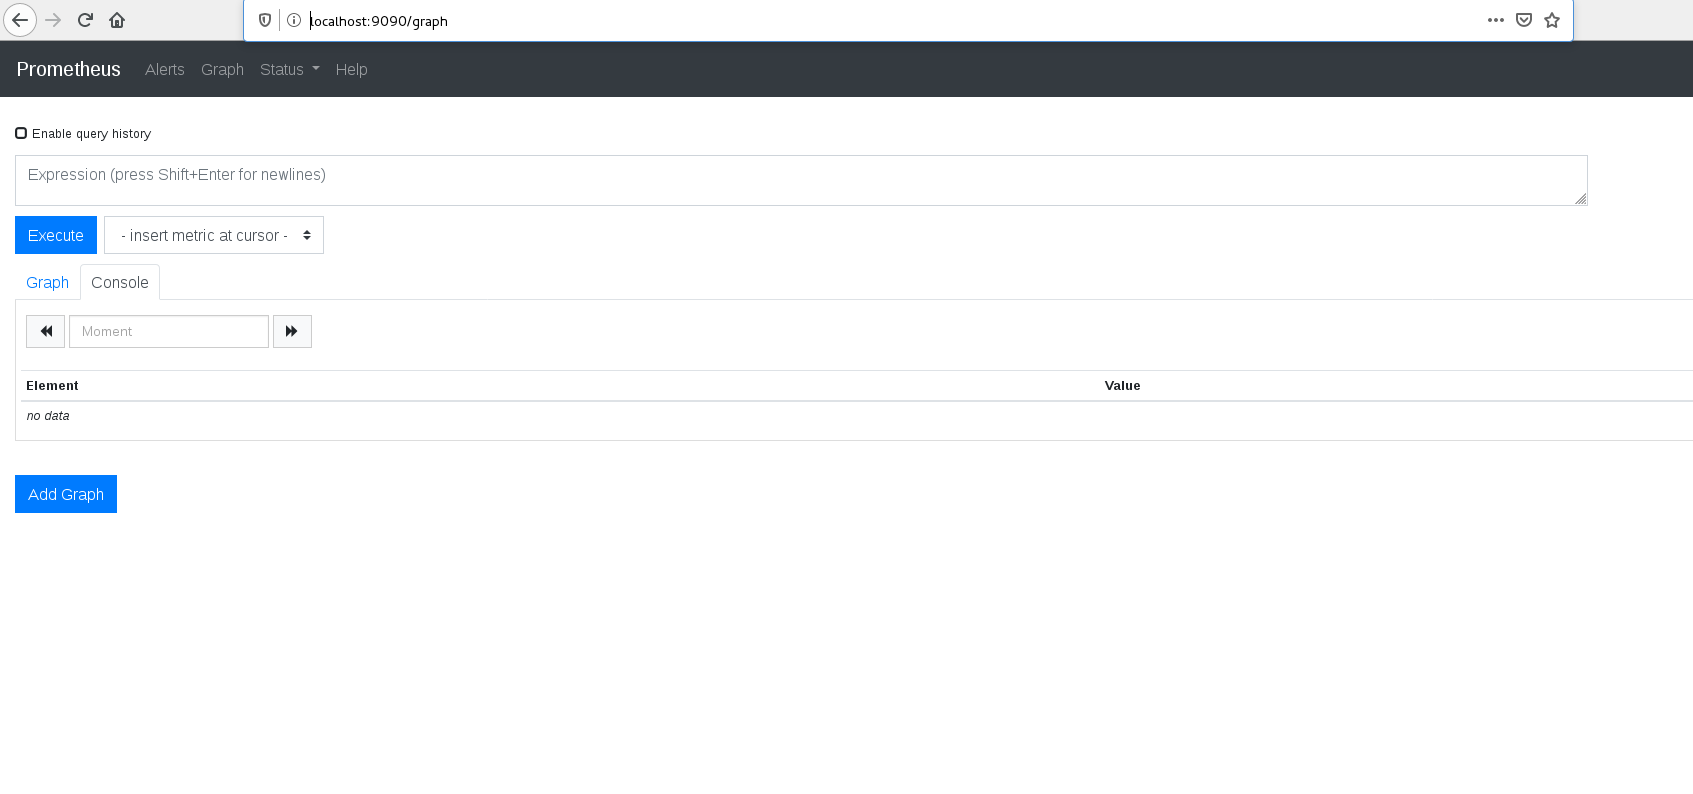
2. Access http://localhost:9090/graph from browser. We should get the following Prometheus page.
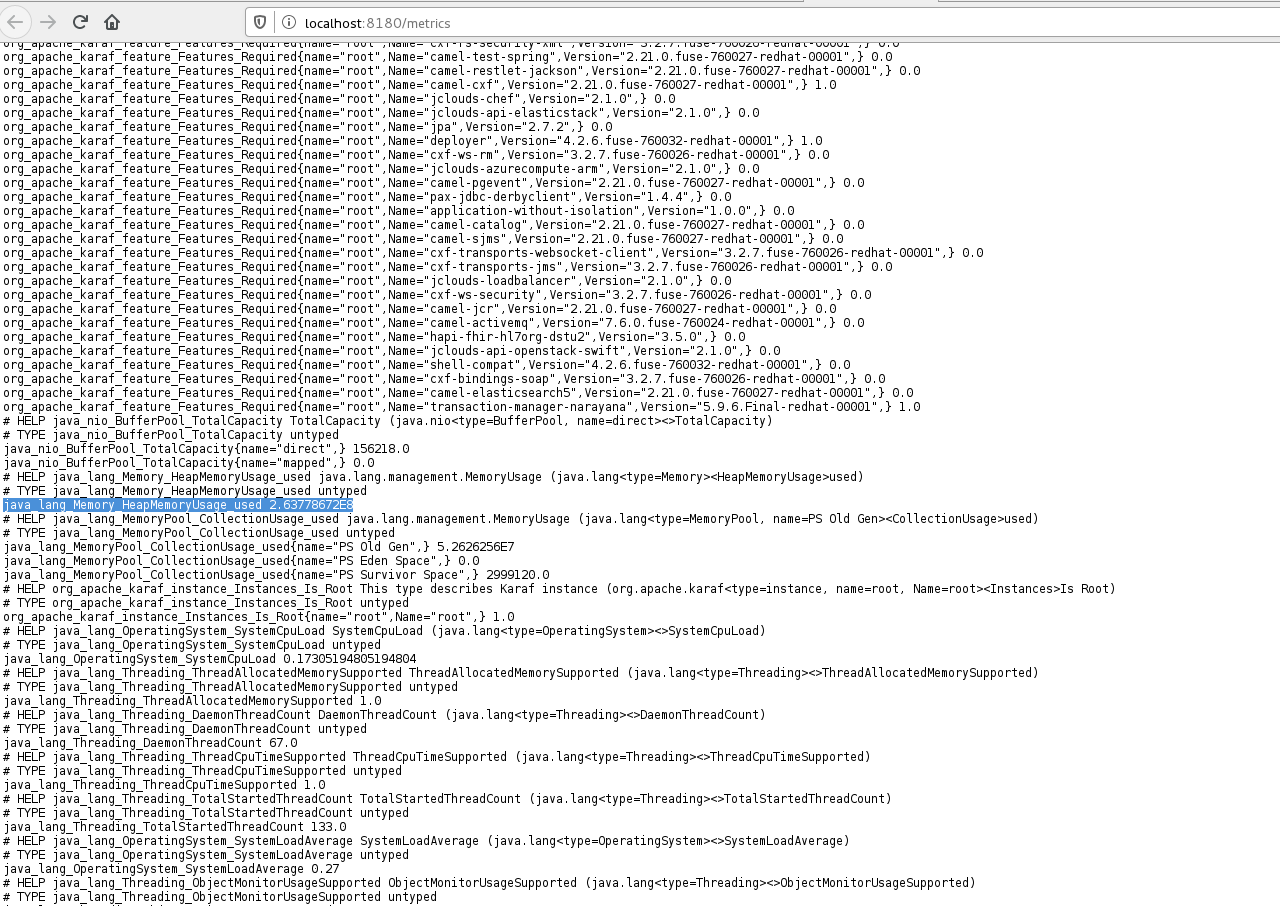
3. In Prometheus Query page(here we can search/query metrics), select Status -> Targets. We should find here that State of service is UP and Endpoint listed is http://localhost:8180/metrics. This is the URL from where Prometheus will scrape for Red Hat Fuse metrics.

5. Prometheus data store and Retention can be configured following Prometheus Doc. Important properties are:
--storage.tsdb.path: This determines where Prometheus writes its database. Defaults to data/.
--storage.tsdb.retention.time: This determines when to remove old data. Defaults to 15d.
We can run Prometheus with these configurations as:
./prometheus --config.file=mbean-monitor.yml --storage.tsdb.path=/path/to/data-store
Now Start and Setup Grafana
1. Start Grafana from script grafana-7.1.0/bin/grafana-server.
xxxxxxxxxx
[cpandey@cpandey bin]$ ./grafana-server
INFO[07-25|02:20:36] Starting Grafana logger=server version=7.1.0 commit=8101355285 branch=HEAD compiled=2020-07-16T16:34:17+0530
INFO[07-25|02:20:36] Config loaded from logger=settings file=/home/cpandey/Desktop/prometheus-grafana/grafana-7.1.0/conf/defaults.ini
INFO[07-25|02:20:36] Path Home logger=settings path=/home/cpandey/Desktop/prometheus-grafana/grafana-7.1.0
INFO[07-25|02:20:36] Path Data logger=settings path=/home/cpandey/Desktop/prometheus-grafana/grafana-7.1.0/data
INFO[07-25|02:20:36] Path Logs logger=settings path=/home/cpandey/Desktop/prometheus-grafana/grafana-7.1.0/data/log
INFO[07-25|02:20:36] Path Plugins logger=settings path=/home/cpandey/Desktop/prometheus-grafana/grafana-7.1.0/data/plugins
INFO[07-25|02:20:36] Path Provisioning logger=settings path=/home/cpandey/Desktop/prometheus-grafana/grafana-7.1.0/conf/provisioning
INFO[07-25|02:20:36] App mode production logger=settings
INFO[07-25|02:20:36] Connecting to DB logger=sqlstore dbtype=sqlite3
INFO[07-25|02:20:36] Starting DB migration logger=migrator
INFO[07-25|02:20:36] Starting plugin search logger=plugins
INFO[07-25|02:20:36] Registering plugin logger=plugins name="Direct Input"
INFO[07-25|02:20:36] HTTP Server Listen logger=http.server address=[::]:3000 protocol=http subUrl= socket=
2. Access Grafana GUI from browser with URL http://localhost:3000/. The default username/password would be admin/admin.
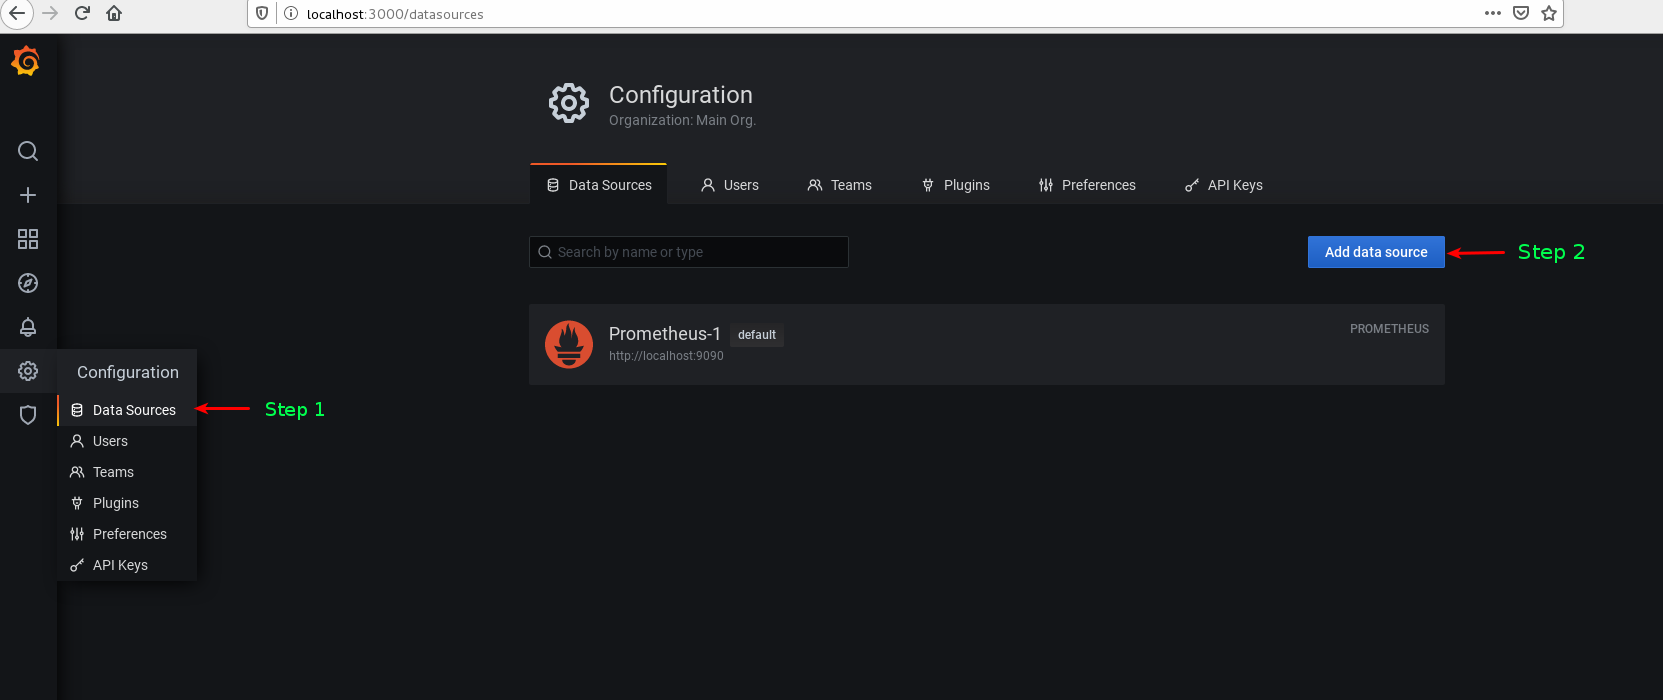
3. We will now add datasource to Grafana. So that Grafana can start getting data from Prometheus. Follow Step1 and Step 2 as mentioned in the screen-shot.
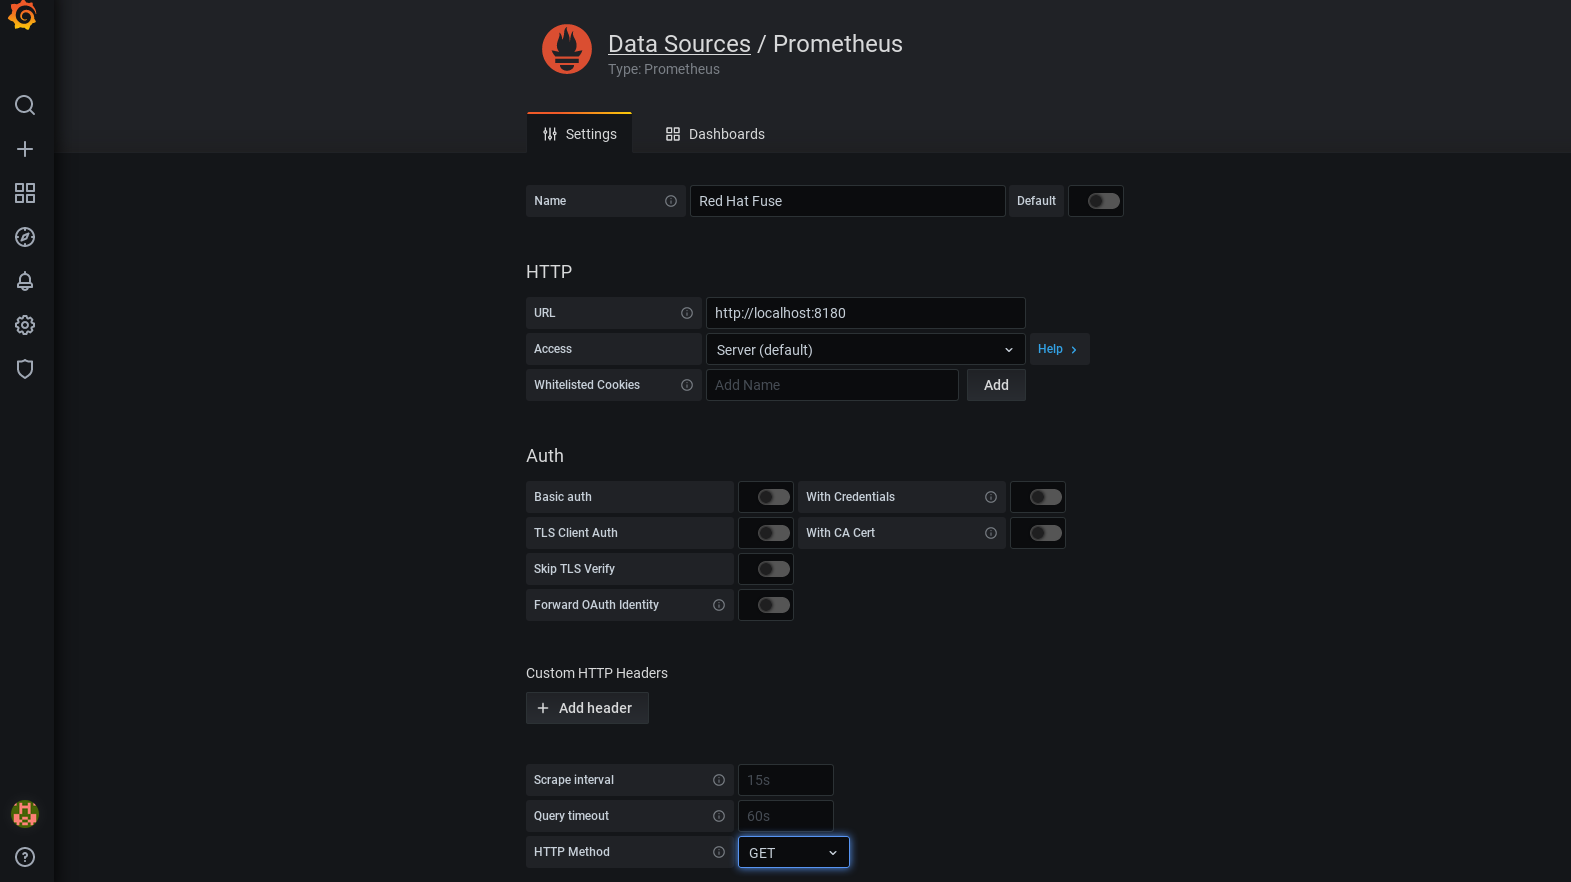
5. Now record details as mentioned in the following screen-shot. Finally, click on "Save & Test".
6. Now we will add a new Dashboard and create a panel in it. Check scree-shot.
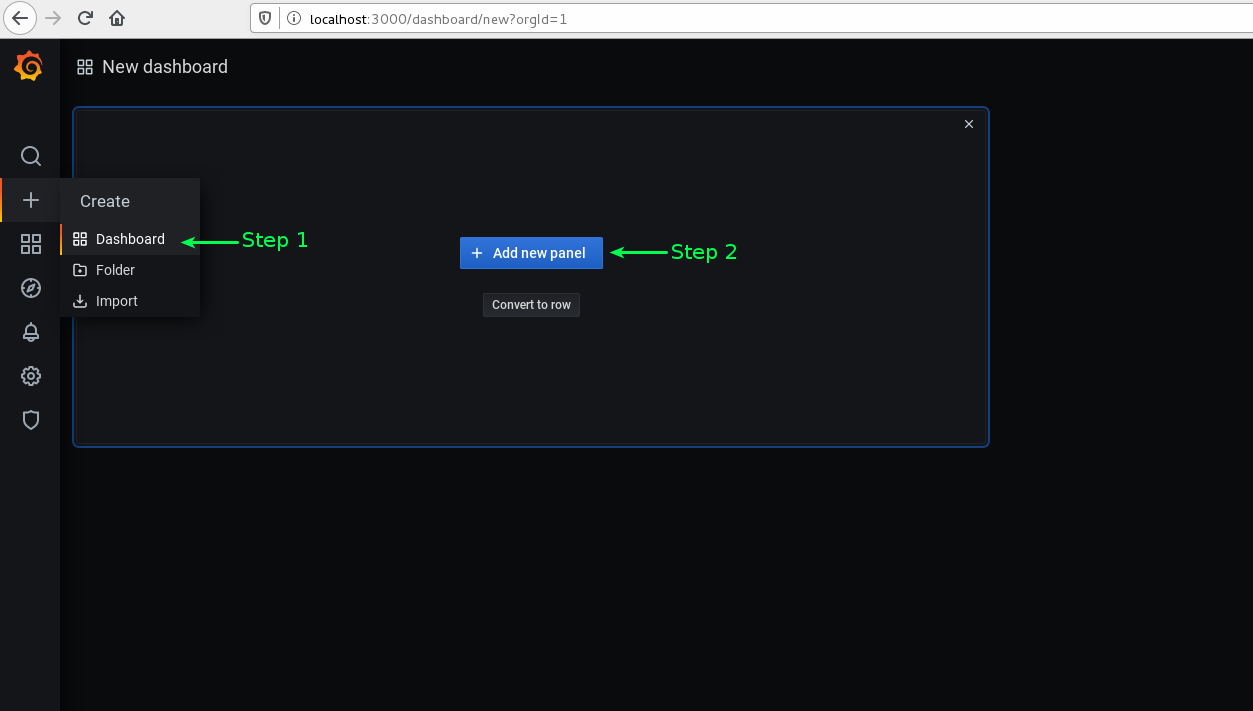
7. Create a visualization in a recently added Panel.
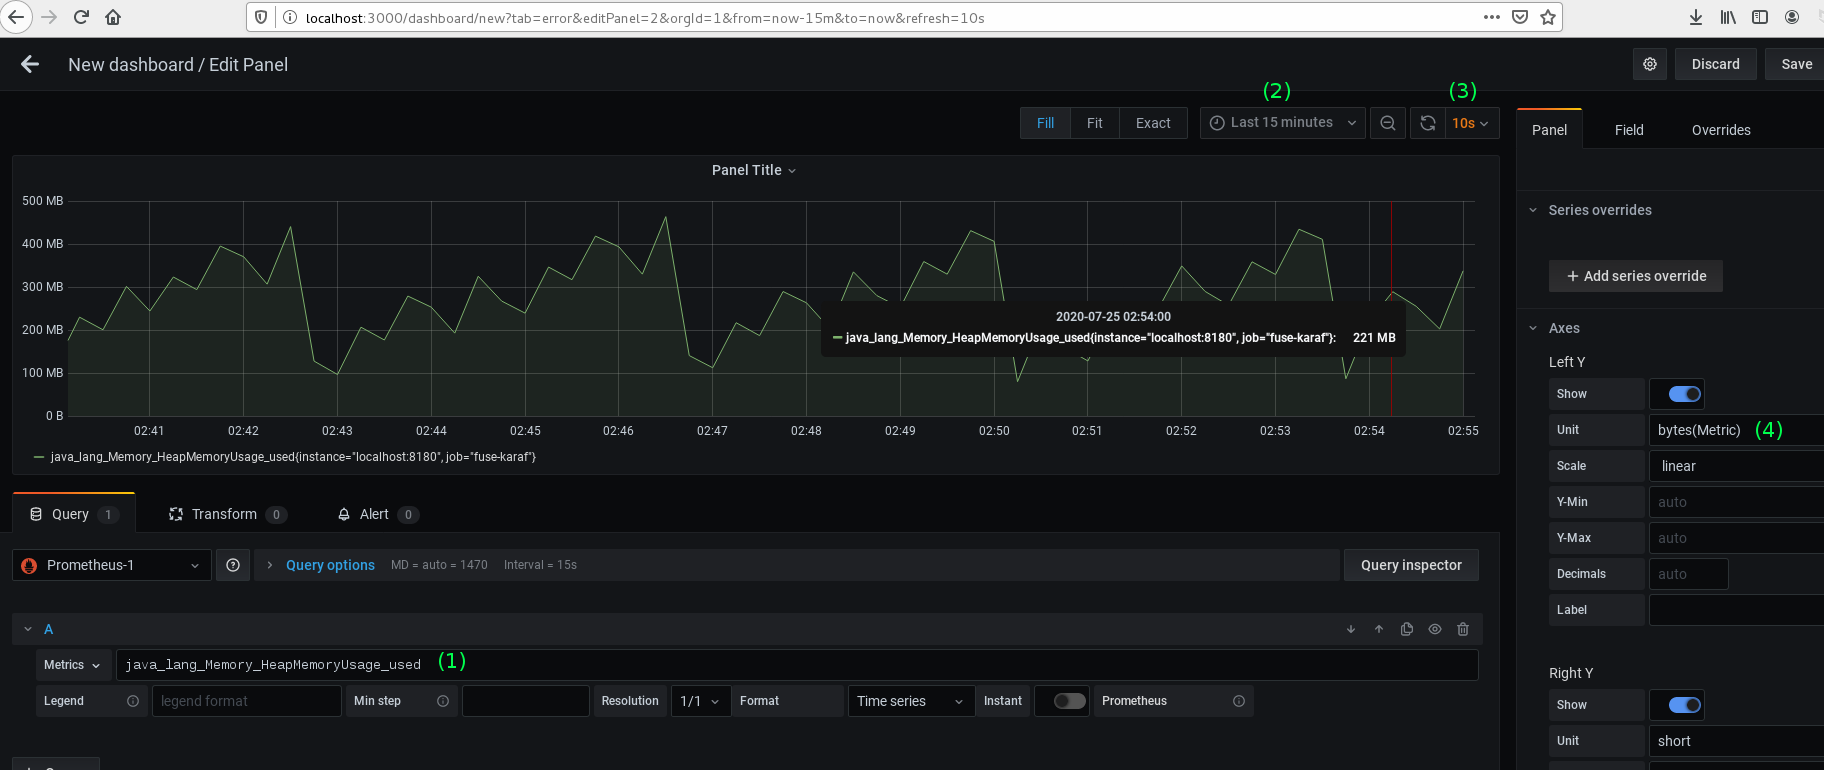
8. If we note in screen-shot "Grafana Visualization", we have set the following. Once we set all these we will find dynamic visualization of heap memory utilization by the Red Hat Fuse process.
- (1) Metrics: java_lang_Memory_HeapMemoryUsage_used.
- (2) Last 15 minutes: Grafana will show data for the last 15 minutes.
- (3) 10s: Refresh every 10 seconds.
- (4) Unit: bytes.
9. Similarly, we can add different panels for different metrics exposed in Prometheus(http://localhost:8180/metrics). For example CPU utilization, thread-pool, Application-specific.
That's it guys, I have used Red Hat Fuse as an example here. Any Java application can be similarly configured with Prometheus, Grafana, and jmx_prometheus_javaagent. I believe it will help you to have a basic setup and then you can explore more with all the metrics available.
Opinions expressed by DZone contributors are their own.

Comments