A Hands-On Guide To OpenTelemetry: Intro to Observability
In this guide to OpenTelemetry, explore how to adopt OTel and instrument an application to collect tracing telemetry.
Join the DZone community and get the full member experience.
Join For FreeAre you ready to start your journey on the road to collecting telemetry data from your applications? Great observability begins with great instrumentation!
In this series, you'll explore how to adopt OpenTelemetry (OTel) and how to instrument an application to collect tracing telemetry. You'll learn how to leverage out-of-the-box automatic instrumentation tools and understand when it's necessary to explore more advanced manual instrumentation for your applications. By the end of this series, you'll have an understanding of how telemetry travels from your applications to the OpenTelemetry Collector, and be ready to bring OpenTelemetry to your future projects. Everything discussed here is supported by a hands-on, self-paced workshop authored by Paige Cruze.
This first article takes time to lay the foundation, defining common observability and monitoring terms that help us gain an understanding of the role of OpenTelemetry and its components.
This introduction needs to start with some really basic definitions so that we're all on the same page when we move on to more complex topics.
Defining Our Needs
First, there is the term observability. This is how effectively you can understand system behavior from the outside using the data that the system generates. Monitoring is a bit more subtle of a term, where we are continuously in the process of watching and tracking system health based on a pre-defined set of data. This often is done using dashboards that represent queries on that set of data.

When we talk about data, we are actually talking about telemetry, which is the process of recording and sending data from remote components to a backend. Examples of telemetry are data types that include metrics, logs, events, and traces.
Finally, we have to look at instrumentation. This is the actual code that records and measures the behavior of an application or infrastructure component. There are two types of instrumentation at which we'll be looking: auto-instrumentation and manual instrumentation. The first is provided out of the box by the provided instrumentation library, usually just by adding its usage and flipping the switch. The second is achieved by custom code added to applications, usually narrowing the scope or specific focus of your data needs.
What Is OpenTelemetry?
The project OTel has been part of the Cloud Native Computing Foundation (CNCF) since 2019 and was born from the merging of the projects OpenCensus and OpenTracing. OTel is a set of standardized vendor-agnostic Software Developer Kits (SDKs), Application Programming Interfaces (APIs), and other tools for ingesting, transforming, and sending telemetry to observability back-ends.
Below is a basic architecture of OTel showing a typical cloud-native environment with microservices, infrastructure components, and instrumented client applications pushing telemetry data through the OTel Collector to eventual observability backends.

Included in the OTel tooling are the OTel API and SDK, shown being used in the microservices for auto-instrumentation and manually instrumenting those services. The API defines the data types available to us and how to generate our telemetry data. When it becomes necessary to create a language-specific implementation of the API, configuration, data processing, and exporting.
As of this writing, the following is the status listing for specific language API/SDK support. See the OTel documentation for current details on specific language support:

We can also make use of the client instrumentation libraries. Check out the 770+ that are available in the OTel Registry for instrumenting our specific needs.
It's always important to include in the introduction section what a technology can't do. The first one is that OTel is NOT only a tracing tool, only being able to collect tracing data. The specifications have been expanded to include metrics and logs processing.
OTel does NOT provide for any telemetry backend or storage systems. It leaves this to other projects such as Jaeger and Prometheus. Finally, OTel does NOT provide any sort of observability UI. It focuses on the generation, collection, management, and export of telemetry. OTel leaves the storing, querying, and visualizing of telemetry data to other projects or vendors.
The Collector
The OpenTelemetry Collector is a proxy that can receive, process, and export telemetry data. It is a vendor-agnostic implementation that supports open-source observability data formats such as the CNCF projects Jaeger, Prometheus, Fluent Bit, and more.
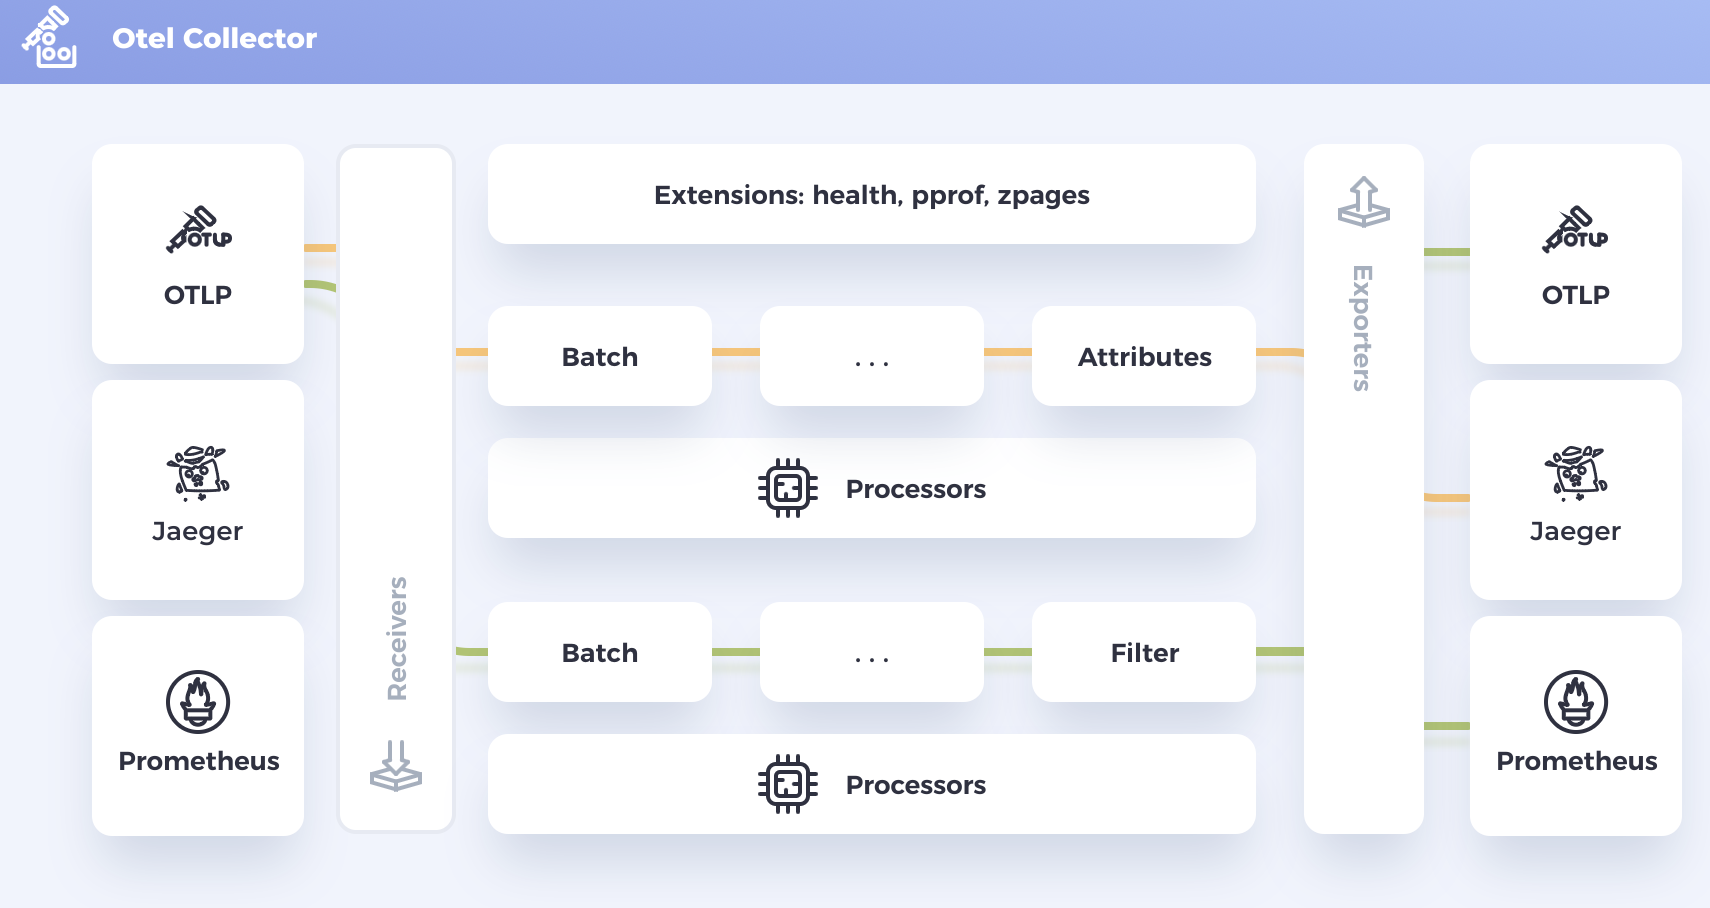
The collector does this using the OpenTelemetry Protocol (OTLP), a specification describing the encoding, transportation, and delivery mechanism of telemetry data between telemetry sources, intermediate nodes such as collectors, and telemetry backends. Simply stated, OTLP is a general-purpose telemetry data delivery protocol.
Within OTel there is the concept of an OTel Resource, which represents the entity producing telemetry as resource attributes. Imagine a service running in a container on Kubernetes and producing telemetry such as service.name, pod.name, namespace, etc. All of these attributes can be included in the resource. This resource information is used to investigate interesting behavior, such as latency in your system being narrowed down to a specific container, pod, or service.
Instrumentation Types
There are three types of instrumentation that you will be exploring listed here. They each include a code example from the previously mentioned hands-on workshop application.
An automatic agent runs alongside the application and adds instrumentation without code changes.
# Nothing to see here, no code changes to my application,
# agent injects instrumentation at runtime.
#
from flask import Flask, request

app = Flask(__name__)


@app.route("/server_request")
def server_request():
    print(request.args.get("param"))
    return "served"


if __name__ == "__main__":
    app.run(port=8082)
Programmatic is a mix of both, where you pull in pre-instrumented dependencies and manually add metadata (e.g., labels).
# Use framework specific instrumentation library to capture
# basic method calls, requiring configuration and code changes.
#
from flask import Flask, request

from opentelemetry.instrumentation.flask import FlaskInstrumentor
from opentelemetry.sdk.trace import TracerProvider
from opentelemetry.sdk.trace.export import (
	BatchSpanProcessor,
	ConsoleSpanExporter,
)
from opentelemetry.trace import get_tracer_provider, set_tracer_provider

set_tracer_provider(TracerProvider())
get_tracer_provider().add_span_processor(
	BatchSpanProcessor(ConsoleSpanExporter())
)

instrumentor = FlaskInstrumentor()
app = Flask(__name__)

instrumentor.instrument_app(app)

@app .route("/server_request")
def server_request():
	print(request.args.get("param"))
	return "served"


if __name__ == "__main__":
	app.run(port= 8082)
With manual, you set up an observability library and add instrumentation code.
# Requires configuring OpenTelemetry libraries and
# instrumenting every method call you care about.
#
from flask import Flask, request

from opentelemetry.instrumentation.wsgi import collect_request_attributes
from opentelemetry.propagate import extract
from opentelemetry.sdk.trace import TracerProvider
from opentelemetry.sdk.trace.export import (
	BatchSpanProcessor,
	ConsoleSpanExporter,
)
from opentelemetry.trace import (
	SpanKind,
	get_tracer_provider,
	set_tracer_provider,
)

app = Flask(__name__)

set_tracer_provider(TracerProvider())
tracer = get_tracer_provider().get_tracer(__name__)

get_tracer_provider().add_span_processor(
	BatchSpanProcessor(ConsoleSpanExporter())
)


@app .route("/server_request")
def server_request():
	with tracer.start_as_current_span(
		"server_request",
		context=extract(request.headers),
		kind=SpanKind.SERVER,
		attributes=collect_request_attributes(request.environ),
	):
		print(request.args.get("param"))
		return "served"


if __name__ == "__main__":
	app.run(port= 8082)
These three examples use code from a Python application that you can explore in the provided hands-on workshop.
What's Next?
This article defined some common observability and monitoring terms, helping you gain an understanding of the role OpenTelemetry and its components play in observability solutions.
Next up, installing OpenTelemetry on our local machine, configuring the SDK, running the demo application, and viewing trace data in the console.
Published at DZone with permission of Eric D. Schabell. See the original article here.
Opinions expressed by DZone contributors are their own.
Comments