How To Achieve High GC Throughput
In this post, explore a key performance metric studied during garbage collection analysis: garbage collection (GC) throughput.
Join the DZone community and get the full member experience.
Join For FreeIn this post, let’s explore a key performance metric studied during garbage collection analysis: "GC throughput." We’ll understand what it means, its significance in Java applications, and how it impacts overall performance. Additionally, we’ll delve into actionable strategies to improve GC throughput, unlocking its benefits for modern software development.
What Is Garbage Collection Throughput?
Whenever an automatic garbage collection event runs, it pauses the application to identify unreferenced objects from memory and evict them. During that pause period, no customer transactions will be processed. Garbage collection throughput indicates what percentage of the application’s time is spent in processing customer transactions and what percentage of time is spent in the garbage collection activities. For example, if someone says his application’s GC throughput is 98%, it means his application spends 98% of its time processing customer transactions and the remaining 2% of the time processing Garbage Collection activities.
A high GC throughput is desirable as it indicates that the application is efficiently utilizing system resources, leading to minimal interruptions and improved overall performance. Conversely, low GC throughput can lead to increased garbage collection pauses, impacting application responsiveness and high computing costs. Monitoring and optimizing GC throughput are vital to ensure smooth application execution and responsiveness.
Reasons for Poor Garbage Collection Throughput
Reasons for garbage collection throughput degradation can be categorized into 3 buckets:
- Performance problems
- Wrong GC tuning
- Lack of resources
Let’s review each of these categories in detail in this section.
1. Performance Problems
When there is a performance problem in the application, GC throughput will degrade. Below are the potential performance reasons that would cause degradation in the application’s performance.
Memory Leaks

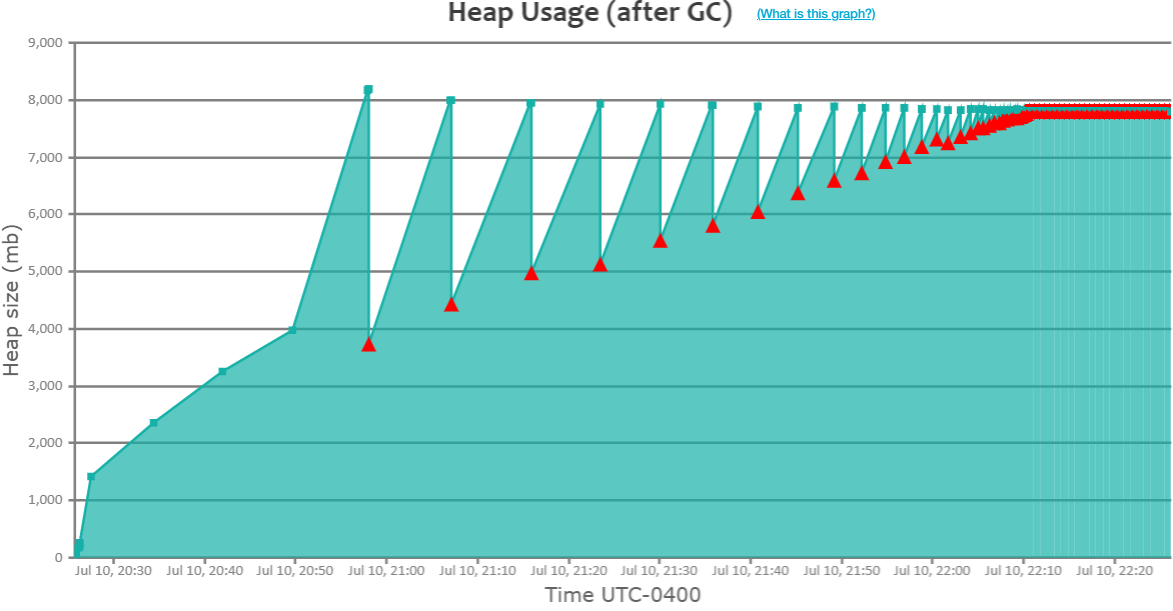
When an application suffers from a memory leak, Garbage Collection events keep running repeatedly without effectively reclaiming memory. In the figure above, you can notice the cluster of red triangles towards the right corner, indicating that GC events are repeatedly running. However, memory utilization does not decrease, which is a classic indication of a memory leak. In such cases, GC events consume most of the application’s time, resulting in a significant degradation of GC throughput and overall performance. To troubleshoot memory leaks, you may find this video clip helpful: Troubleshooting Memory Leaks.
Consecutive GC Pauses

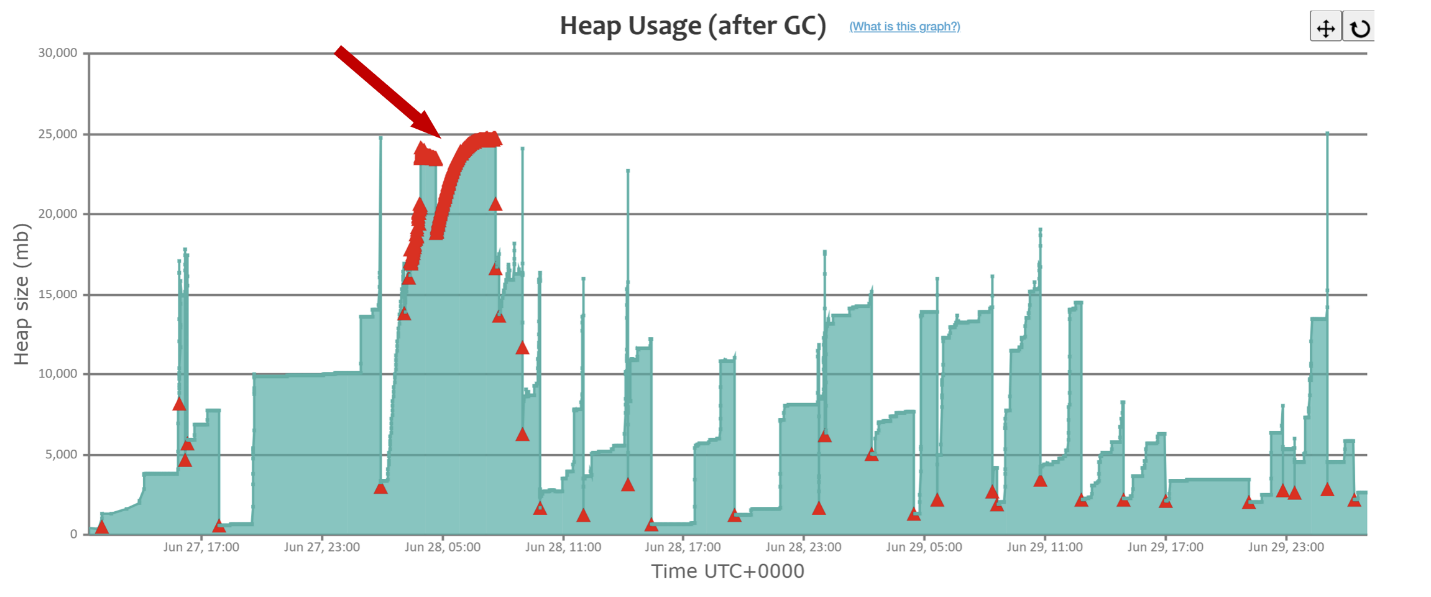
During peak hours of the day or when running batch processes, your application might experience a high traffic volume. As a result, GC events may run consecutively to clean up the objects created by the application. The figure above shows GC events running consecutively (note the red arrow in the above figure). This scenario leads to a dramatic degradation of GC throughput during that time period. To address this problem, you can refer to the blog post: Eliminate Consecutive Full GCs.
Heavy Object Creation Rate
There is a famous Chinese proverb in the "Art of War" book:
"The greatest victory is that which requires no battle."
Similarly, instead of trying to focus on tuning the GC events, it would be more efficient if you could prevent the GC events from running. The amount of time spent in garbage collection is directly proportional to the number of objects created by the application. If the application creates more objects, GC events are triggered more frequently. Conversely, if the application creates fewer objects, fewer GC events will be triggered.
By profiling your application’s memory using tools, you can identify the memory bottlenecks and fix them. Reducing memory consumption will, in turn, reduce the GC impact on your application. However, reducing the object creation rate is a tedious and time-consuming process as it involves studying your application, identifying the bottlenecks, refactoring the code, and thoroughly testing it. However, it’s well worth the effort in the long run, as it leads to significant improvements in application performance and more efficient resource usage.
2. Wrong GC Tuning
Another significant reason for degradation in an application’s GC throughput is incorrect garbage collection (GC) tuning. Various factors can contribute to this issue:
Wrong GC Algorithm Choice
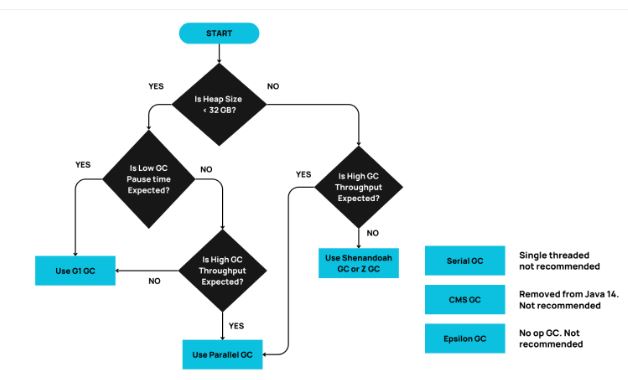
The garbage collection algorithm plays a pivotal role in influencing the GC pause times. Choosing the wrong GC algorithm can substantially decrease the application’s GC throughput. As of now, there are 7 GC algorithms in OpenJDK: Serial GC, Parallel GC, CMS GC, G1 GC, Shenandoah GC, ZGC, and Epsilon. This brings up the question: how do I choose the right GC algorithm for my application?

The above flow chart will help you to identify the right GC algorithm for your application. You may also refer to this detailed post which highlights the capabilities, advantages, and disadvantages of each GC algorithm.
Here is a real-world case study of an application, which was used in warehouses to control the robots for shipments. This application was running with the CMS GC algorithm and suffered from long GC pause times of up to 5 minutes. Yes, you read that correctly: it’s 5 minutes, not 5 seconds. During this 5-minute window, robots weren’t receiving instructions from the application and a lot of chaos was caused. When the GC algorithm was switched from CMS GC to G1 GC, the pause time instantly dropped from 5 minutes to 2 seconds. This GC algorithm change made a big difference in improving the warehouse’s delivery.
Lack (or Incorrect) GC Tuning
Incorrectly configuring GC arguments or failing to tune the application appropriately can also lead to a decline in GC throughput. Be advised there are 600+ JVM arguments related to JVM Memory and garbage collection. It’s a tedious task for anyone to choose the GC right arguments from a poorly documented arguments list. Thus, we have curated less than a handful of JVM arguments by each GC algorithm and given them below. Use the arguments pertaining to your GC algorithm and optimize the GC pause time.
- Serial GC Tuning Parameters
- Parallel GC Tuning Parameters
- CMS GC Tuning Parameters
- G1 GC Tuning Parameters
- Shenandoah Tuning Parameters
- ZGC Tuning Parameters
For a detailed overview of GC tuning, you can watch this insightful video talk.
Wrong Internal Memory Regions Size
JVM memory has the following internal memory regions:
- Young Generation
- Old Generation
- MetaSpace
- Others
You may visit this video post to learn about different JVM memory regions. Changing the internal memory region size can also result in positive GC pause time improvements. Here is a real case study of an application, which was suffering from 12.5 second average GC Pause time. This application’s Young Generation Size was configured at 14.65GB, and Old Gen size was also configured at the same 14.65 GB. Upon reducing the Young Gen size to 1GB, the average GC pause time remarkably reduced to 138 ms, which is a 98.9% improvement.
3. Lack of Resources
Insufficient system and application-level resources can contribute to the degradation of an application’s garbage collection (GC) throughput.
Insufficient Heap Size
In most applications, heap size is either under-allocated or over-allocated. When heap size is under-allocated, GCs will run more frequently, resulting in the degradation of the application’s performance.
Here is a real case study of an insurance application that was configured to run with an 8 GB heap size (-Xmx). This heap size wasn’t sufficient enough to handle the incoming traffic, due to which the garbage collector was running back-to-back. As we know, whenever a GC event runs, it pauses the application. Thus, when GC events run back-to-back, pause times were getting stretched and the application became unresponsive in the middle of the day. Upon observing this behavior, the heap size was increased from 8 GB to 12 GB. This change reduced the frequency of GC events and significantly improved the application’s overall availability.
Insufficient System Resources
A scarcity of CPU cycles or heavy I/O activity within the application can significantly degrade GC performance. Ensuring sufficient CPU availability on the server, virtual machine (VM), or container hosting your application is crucial. Additionally, minimizing I/O activity can help maintain optimal GC throughput.
Garbage Collection performance can sometimes suffer due to insufficient system-level resources such as threads, CPU, and I/O. GC log analysis tools like GCeasy identify these limitations by examining the following two patterns in your GC log files:
- Sys time > User Time: This pattern indicates that the GC event is spending more time on kernel-level operations (system time) compared to executing user-level code. This could be a sign that your application is facing high contention for system resources, which can hinder GC performance.
- Sys time + User Time > Real Time: This pattern suggests that the combined CPU time (system time plus user time) exceeds the actual elapsed wall clock time. This discrepancy indicates that the system is overburdened, possibly due to insufficient CPU resources or a lack of GC threads.
To address these system-level limitations, consider taking one of the following actions:
- Increase GC threads: Allocate more GC threads to your application by adjusting the relevant JVM parameters.
- Add CPU resources: If your application is running on a machine with limited CPU capacity, consider scaling up by adding more CPU cores. This can provide the additional processing power needed to handle GC operations more efficiently.
- I/O bandwidth: Ensure that your application’s I/O operations are optimized and not creating bottlenecks. Poor I/O performance can lead to increased system time, negatively impacting GC performance.
Old Version of JDK
Continual improvements are made to GC performance by JDK development teams. Operating on an outdated JDK version prevents you from benefiting from the latest enhancements. To maximize GC throughput, it’s recommended to keep your JDK up to date. You can access the latest JDK release information here.
Conclusion
Garbage Collection (GC) throughput is a critical metric in ensuring the efficient operation of Java applications. By understanding its significance and the factors that influence it, you can take actionable steps to optimize GC throughput and enhance overall performance.
To achieve high GC throughput:
- Address performance problems: Identify and resolve memory leaks, manage heavy object creation rates, and avoid consecutive GC pauses during high-traffic periods.
- Optimize GC tuning: Select the appropriate GC algorithm, correctly configure GC tuning parameters, and adjust internal memory region sizes to improve GC pause times.
- Ensure adequate resources: Allocate sufficient heap size, provide enough CPU resources, and minimize I/O activity to prevent system-level bottlenecks.
- Keep your JDK updated: Regularly update your JDK to benefit from the latest GC performance improvements.
By implementing these strategies, you can significantly reduce garbage collection pauses, leading to better application responsiveness and resource utilization.
Published at DZone with permission of Ram Lakshmanan, DZone MVB. See the original article here.
Opinions expressed by DZone contributors are their own.

Comments