How To Aim for High GC Throughput
Explore a key performance metric studied during garbage collection — what it means, its significance in Java applications, and how it impacts overall performance.
Join the DZone community and get the full member experience.
Join For FreeThree or four decades back, developers were responsible for evicting (i.e., deallocating) the objects they created in applications. Business applications are quite complex, with different workflows, use cases, and scenarios. Even if a developer missed releasing an object for one scenario, objects would accumulate in memory, causing memory leaks. When Java was introduced in 1995, it promised automatic garbage collection. It revolutionized memory management by shifting the responsibility of deallocating objects from developers to the Java Virtual Machine (JVM). The entire industry embraced this innovative idea, as developers no longer needed to worry about manual memory management. Since then, automatic garbage collection has become a default feature in all modern programming languages.
In this post, let’s explore a key performance metric studied during garbage collection: ‘GC Throughput.’ We’ll understand what it means, its significance in Java applications, and how it impacts overall performance. Additionally, we’ll delve into actionable strategies to improve GC Throughput, unlocking its benefits for modern software development.
What Is Garbage Collection Throughput?
Whenever an automatic garbage collection event runs, it pauses the application to identify unreferenced objects from memory and evict them. During that pause period, no customer transactions will be processed. Garbage Collection throughput indicates what percentage of the application’s time is spent in processing customer transactions and what percentage of time is spent in the garbage collection activities. For example, if someone says his application’s GC throughput is 98%, it means his application spends 98% of its time processing customer transactions and the remaining 2% of time processing Garbage Collection activities.
A high GC throughput is desirable as it indicates that the application is efficiently utilizing system resources, leading to minimal interruptions and improved overall performance. Conversely, low GC throughput can lead to increased garbage collection pauses, impacting application responsiveness and causing performance bottlenecks. Monitoring and optimizing GC throughput are vital to ensure smooth application execution and responsiveness. In the next section, we will explore methods to find your application’s GC throughput and understand how to interpret the results to optimize Java application performance. Let’s dive in!
How To Find Your Application’s GC Throughput
Garbage Collection logs are the best source to study GC performance. If your application is running in JVM, you can enable GC logging, bypassing the JVM arguments mentioned in this post. Once GC logging is enabled, let your application handle traffic for at least one day to observe both high and low traffic periods. After that, you can upload the generated GC log file to a GC log analysis tool to gain valuable insights. Some popular GC log analysis tools are GCeasy, IBM GC & Memory Visualizer, HP Jmeter, and Garbage Cat. These tools will report GC throughput along with other essential GC metrics. Below is an excerpt from the GCeasy tool, showcasing a report of various GC Key Performance Indicators (KPIs), including GC throughput.
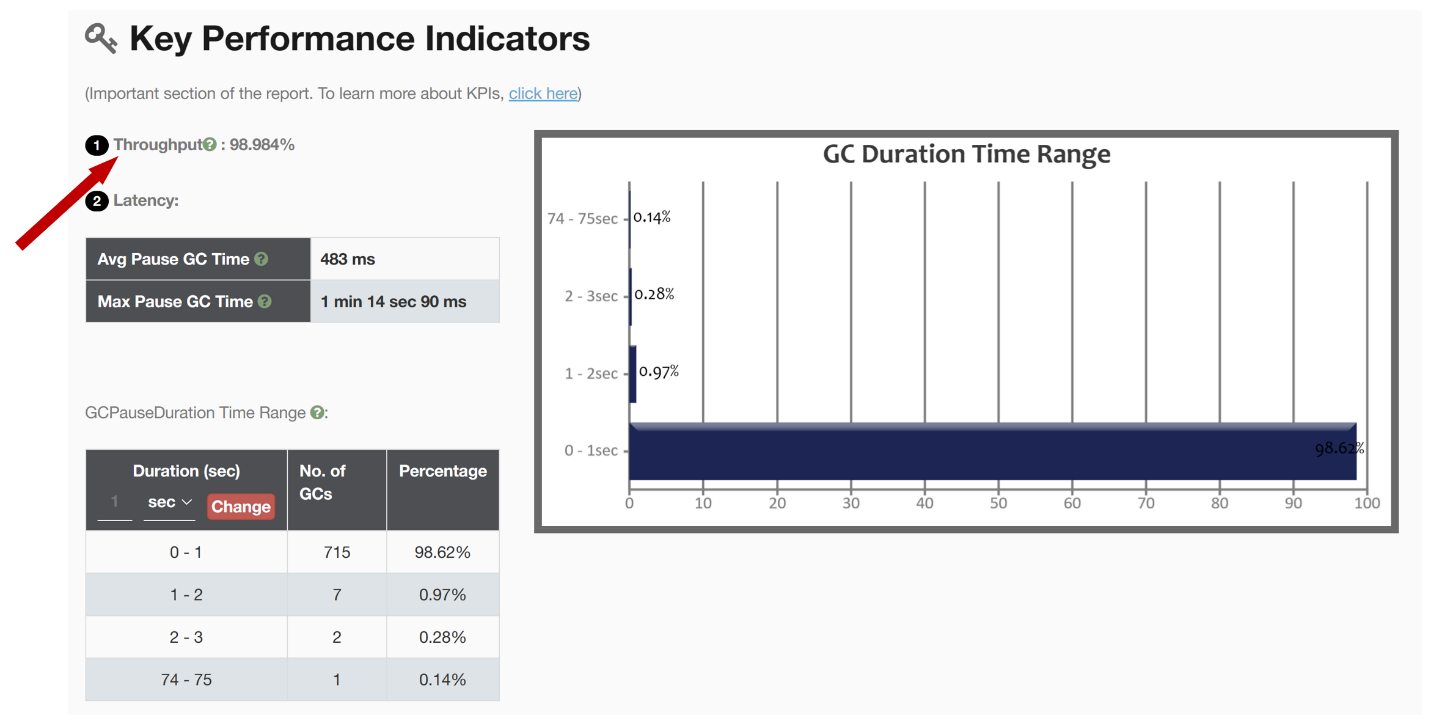
Fig: GC throughput reported by GCeasy tool
Reasons for Poor Garbage Collection Throughput
Reasons for Garbage Collection throughput degradation can be categorized into three buckets:
- Performance problems
- Wrong GC tuning
- Lack of Resources
Let’s review each of these categories in detail in this section.
a. Performance Problems
When there is a performance problem in the application, GC throughput will degrade. Below are the potential performance reasons that would cause degradation in the application’s performance.
1. Memory Leaks
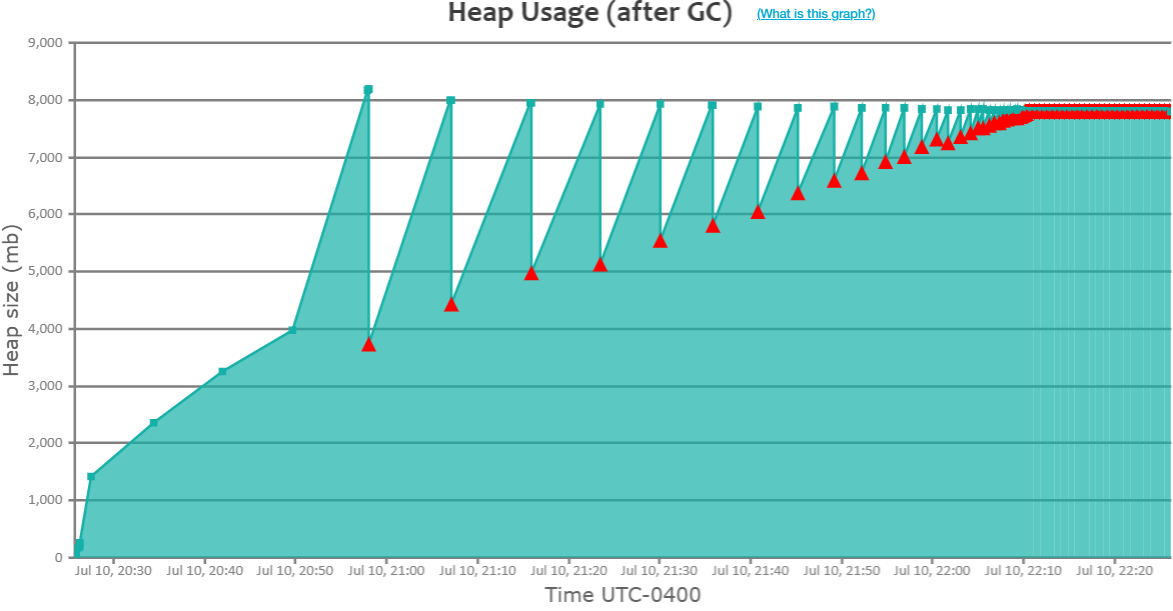
Fig: GC events running repeatedly because of memory leak
When an application suffers from a memory leak, Garbage Collection events keep running repeatedly without effectively reclaiming memory. In the figure above, you can notice the cluster of red triangles towards the right corner, indicating that GC events are repeatedly running. However, memory utilization does not decrease, which is a classic indication of a memory leak. In such cases, GC events consume most of the application’s time, resulting in a significant degradation of GC throughput and overall performance. To troubleshoot memory leaks, you may find this video clip helpful: Troubleshooting Memory Leaks.
2. Consecutive GC Pauses
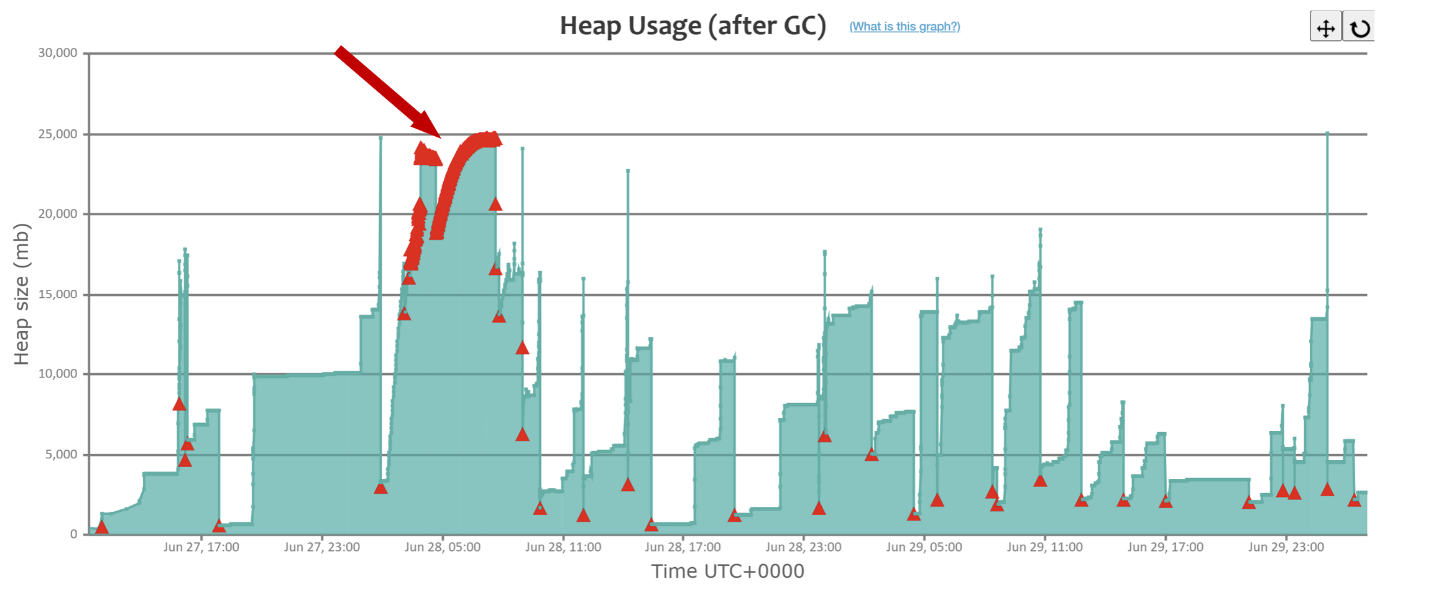
Fig: GC events running repeatedly because of high traffic volume
During peak hours of the day or when running batch processes, your application might experience a high traffic volume. As a result, GC events may run consecutively to clean up the objects created by the application. The figure above shows GC events running consecutively (note the red arrow in the above figure). This scenario leads to a dramatic degradation of GC throughput during that time period. To address this problem, you can refer to the blog post: Eliminate Consecutive Full GCs.
3. Heavy Object Creation Rate
Inefficient programming practices can cause your application to create a large number of objects unnecessarily. This increase in object creation rate forces the garbage collector to run very frequently, negatively impacting GC throughput. To address this issue, you can profile your application using memory profilers like HeapHero, YourKit, or jProfiler to identify areas with excessive object creation and optimize or reduce object usage accordingly.
4. Large and Long-Lived Objects
Large and long-lived objects have a notable impact on Garbage Collection (GC) throughput and overall application performance. These objects consume substantial memory and persist in the heap for extended periods, leading to GC-related challenges. To mitigate this impact, consider:
- Object pooling: Reuse objects through pooling to minimize allocation and GC.
- Optimal sizing: Create appropriately sized objects to avoid unnecessary overhead.
- Weak references: Use weak references for objects that can be aggressively collected.
- Off-heap storage: Utilize off-heap memory for large or long-lived data.
b. Wrong GC Tuning
Another significant reason for degradation in an application’s GC throughput is incorrect Garbage Collection (GC) tuning. Various factors can contribute to this issue:
5. Wrong GC Algorithm Choice
As of 2023, OpenJDK platform offers a range of seven Garbage Collection algorithms, including Serial, Parallel, CMS, G1 GC, ZGC, Shenandoah, and Epsilon. The selection of an appropriate GC algorithm is critical and should be based on factors like application traffic volume, pattern, object creation rate, and performance objectives. Opting for the wrong GC algorithm can substantially decrease the application’s GC throughput.
6. Lack (or Incorrect) GC Tuning
Incorrectly configuring JVM arguments or failing to tune the application appropriately can also lead to a decline in GC throughput. Proper GC tuning is crucial to align the JVM’s behavior with the application’s requirements.
7. Wrong Generation Size
The JVM memory is divided into internal regions, including Young Generation, Old Generation, MetaSpace, and native memory. Improper configuration of these region sizes can result in diminished GC throughput.
c. Lack of Resources
Insufficient system and application-level resources can contribute to the degradation of an application’s Garbage Collection (GC) throughput.
8. Insufficient Heap Size
Allocating an inadequate heap size (controlled by the -Xmx parameter) combined with increased object creation can lead to more frequent GC events. This frequent GC activity results in a degradation of GC throughput. To address this, ensure an appropriately sized heap by increasing the heap size to accommodate the application’s memory needs.
9. Insufficient GC Threads
A shortage of Garbage Collection threads can lead to prolonged GC event durations. The number of GC threads is determined by the ‘ConcurrentGCThreads’ and ‘ParallelGCThreads’ JVM arguments. Allocating an adequate number of GC threads is essential to improve GC throughput and minimize pauses.
10. Insufficient System Resources
A scarcity of CPU cycles or heavy I/O activity within the application can significantly degrade GC performance. Ensuring sufficient CPU availability on the server, virtual machine (VM), or container hosting your application is crucial. Additionally, minimizing I/O activity can help maintain optimal GC throughput.
11. Old Version of JDK
Continual improvements are made to GC performance by JDK development teams. Operating on an outdated JDK version prevents you from benefiting from the latest enhancements. To maximize GC throughput, it’s recommended to keep your JDK up to date.
Conclusion
In the realm of Java application development, optimizing Garbage Collection (GC) throughput is paramount for peak performance. We’ve explored the nuances of GC throughput, from measurement to influencing factors. Armed with insights from tools like GCeasy, IBM GC and Memory Visualizer, and HP Jmeter… We’ve learned to identify and address issues impacting throughput, whether memory leaks or improper tuning. As you continue your coding journey, may these strategies empower you to unlock the full potential of your Java applications, delivering robust, responsive, and efficient software experiences.
Published at DZone with permission of Ram Lakshmanan. See the original article here.
Opinions expressed by DZone contributors are their own.
Comments