How To Analyze Node.js Garbage Collection Traces
Explore the process of enabling GC traces, interpreting the trace data, and the right tools and knowledge needed to study the Garbage Collection behavior.
Join the DZone community and get the full member experience.
Join For FreeIs your Node.js application experiencing unresponsiveness or performance bottlenecks? The problem could have originated because of long-running Garbage Collection pauses or memory leaks. In such circumstances, you might want to study your Node.js application’s Garbage Collection performance.
In this post, we’ll walk you through the process of enabling GC traces, interpreting the trace data, and the right tools and knowledge needed to study the Garbage Collection behavior.
How To Enable Node.js Garbage Collection Traces
There are a few approaches to enable the Node.js Garbage Collection traces. The easiest and most straightforward approach is to pass the –trace-gc flag along with your usual invocation command.
Example:
node --trace-gc my-script.mjsOnce the –trace-gc flag is enabled, your Node.js application will start generating Garbage Collection traces in the console output. These traces provide valuable insights into memory usage, GC events, and potential performance bottlenecks. Garbage Collection traces would look something like this:
[721159:0x61f0210] 1201125 ms: Scavenge 27.7 (28.8) -> 26.8 (29.8) MB, 0.5 / 0.2 ms (average mu =0.999, current mu = 0.970) allocation failure[721166:0x5889210] 1201338 ms: Scavenge 30.7 (32.1) -> 29.7 (33.1) MB, 0.6 / 0.3 ms (average mu =0.998, current mu = 0.972) allocation failure[721173:0x54fc210] 1202608 ms: Scavenge 26.8 (28.3) -> 25.8 (29.3) MB, 0.7 / 0.4 ms (average mu =0.999, current mu = 0.972) allocation failure[721152:0x54ca210] 1202879 ms: Scavenge 30.5 (31.8) -> 29.6 (32.8) MB, 0.6 / 0.2 ms (average mu =0.999, current mu = 0.978) allocation failure[721166:0x5889210] 1202925 ms: Scavenge 30.6 (32.1) -> 29.7 (33.1) MB, 0.7 / 0.3 ms (average mu =0.998, current mu = 0.972) task[721159:0x61f0210] 1203105 ms: Scavenge 27.7 (28.8) -> 26.7 (29.8) MB, 0.4 / 0.2 ms (average mu =0.999, current mu = 0.970) allocation failure[721173:0x54fc210] 1204660 ms: Scavenge 26.8 (28.3) -> 25.8 (29.3) MB, 0.5 / 0.2 ms (average mu =0.999, current mu = 0.972) allocation failure
How To Analyze Node.js GC Log
Garbage Collection traces contain a rich set of information such as how many objects were created, how many objects were garbage collected, how long each Garbage Collection event took to complete, how much memory was reclaimed after every GC event, whether there were any memory leaks, etc. However, it’s quite a tedious and time-consuming process to interpret the GC traces manually.
You may consider using the GCeasy online tool to analyze the Node.js GC traces. You can go to the GCeasy tool, sign up for a free account, and upload the GC trace. The tool will instantly parse the GC traces and generate a report that contains vital Garbage Collection analysis metrics and graphs. For your reference, here is the live report generated by the tool.
Node.js GC Trace Analysis Report
The report provides a rich set of graphs, metrics, and statistics around Garbage Collection overhead added to the Node.js application. Below are some of the excerpts from the GCeasy report.
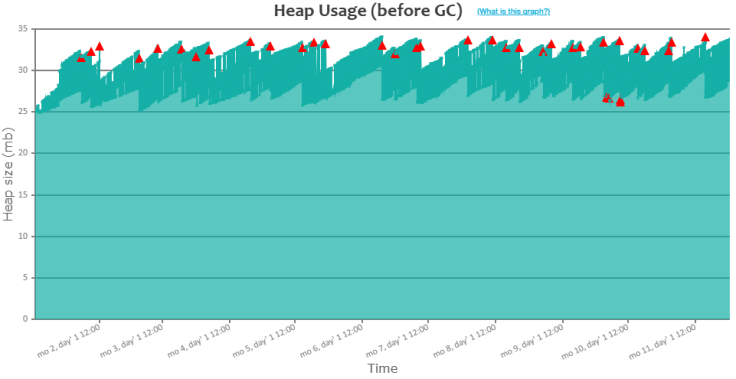
The "Heap usage" graph reports the memory trend after every GC event. You can notice that after GC events, memory usage drops.
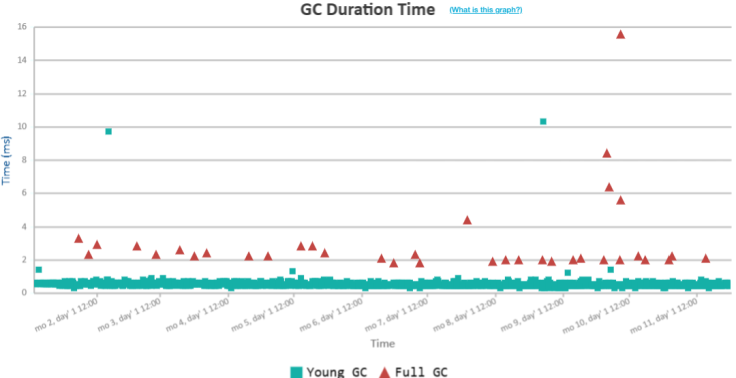
The "GC Duration Time" Graph indicates the time taken by each GC event to run. The red triangle indicates it’s a full GC event and the green square icon indicates it’s a young (or minor) GC event. You can notice that in general, full GC events (i.e., red triangle) are running less frequently, but take more time. On the other hand, Young GC events (i.e., green square) are running more often but take less time. Full GC runs on all the regions in the Node.js memory, whereas minor GC runs only on the young region of the memory.
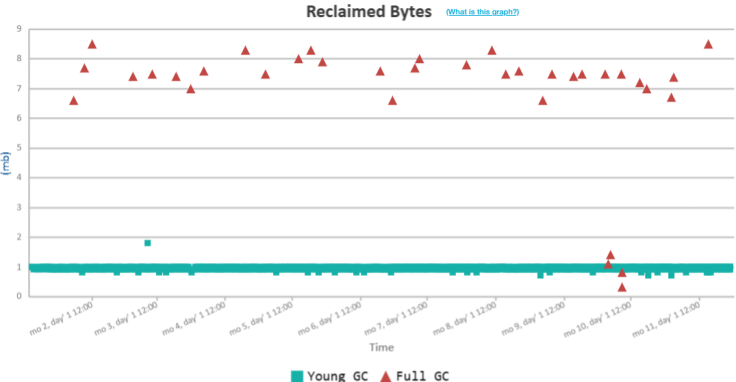
The "Reclaimed Bytes" graph shows the amount of memory reclaimed after each GC event. You can notice that full GC events are reclaiming more memory than young GC events.
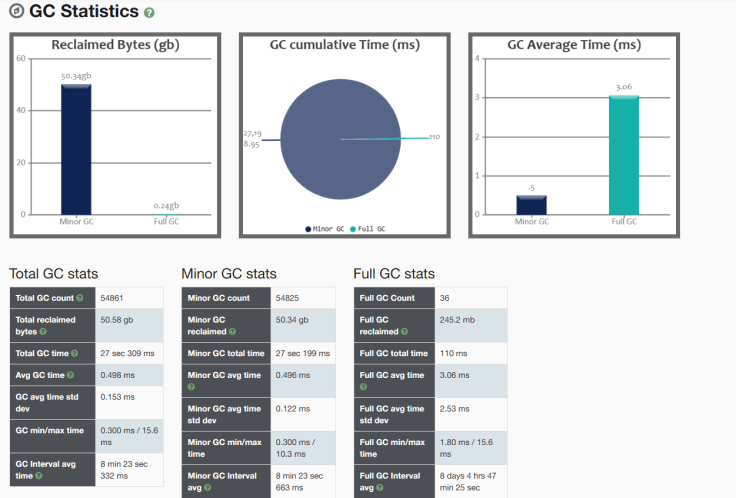
Besides giving a graphical visualization of the Garbage Collection behavior, the tool also gives a lot of statistical metrics. The "GC statistics" section above reports the total number of GC events, their average time, min/max time, standard deviation, etc. These metrics are vital to studying the overhead added by the automatic garbage collection to the Node.js application.
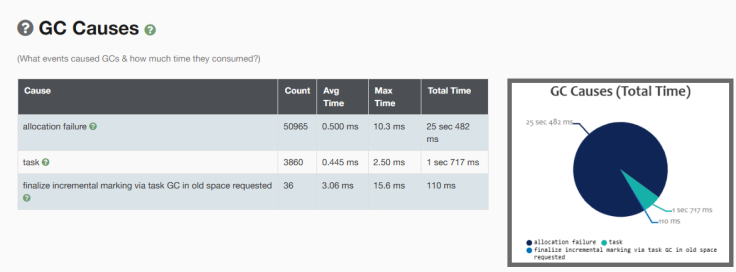
Another interesting section in the report is the "GC Causes" section. This section reveals the reasons why the Garbage Collection got triggered in the application. For example, in this application, 50,965 GC events were triggered because of "Allocation Failure." This happens when there is a lack of memory in the young generation.
Conclusion
Node.js garbage collection analysis provides insights into your application’s memory management, performance, and stability. By understanding and interpreting GC traces, you can uncover hidden performance bottlenecks, identify memory leaks, and optimize memory usage for optimal application performance. Armed with this knowledge, you can make informed decisions to optimize your code, fine-tune garbage collection parameters, and address any underlying issues affecting performance.
Published at DZone with permission of Ram Lakshmanan. See the original article here.
Opinions expressed by DZone contributors are their own.
Comments