How to Build and Execute Performance Tests Before Black Friday and Cyber Monday
Have you already started load testing for Black Friday? If not, don’t worry. There is still enough time to discover bottlenecks and fix them.
Join the DZone community and get the full member experience.
Join For FreeHave you already started load testing for Black Friday? If not, don’t worry. There is still enough time to discover bottlenecks and fix them.
But don’t wait any longer - testing your site or app is important to make sure you don’t lose money, send customers to competitors or create a bad customer experience. If your site performs well on the big day, you may also gain customers from your competitors, if their own sites fail.
Here we’ve outlined how to prepare your website or app for Black Friday - by building and executing performance tests. This blog post is based on the special Black Friday webinar we held, which you can check out here.
1. Create and record user scripts according to your application’s business process
Identify the user flow your customers perform during the event. Use Google Analytics, APM tools such as New Relic, server and database logs such as logentries and logz.io, and last year’s data. We recommend you also use your team: Customer Success for determining flows for your most valuable customers, Product Managers for testing new features, and Marketeers for learning what kind of new traffic is expected to come.
After you determine the user script, start recording.
Let’s look at this example.
- Open the BlazeMeter Chrome Extension, available at the Chrome store
- Change the name of the recording and press record
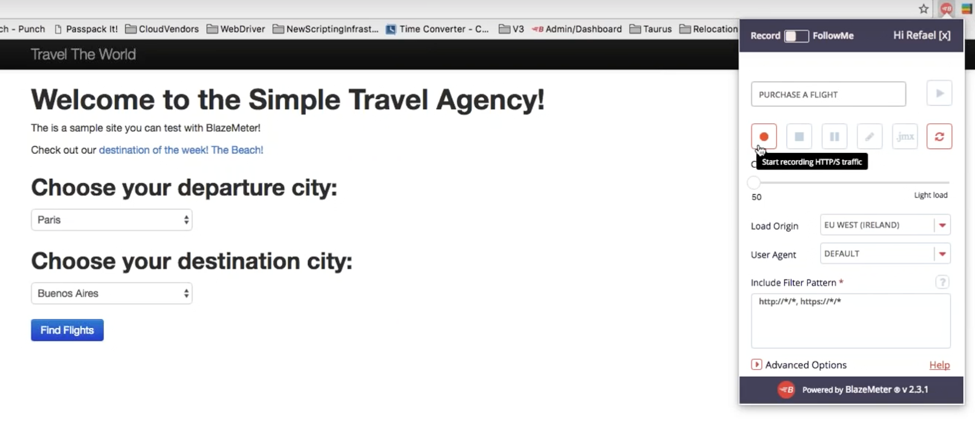
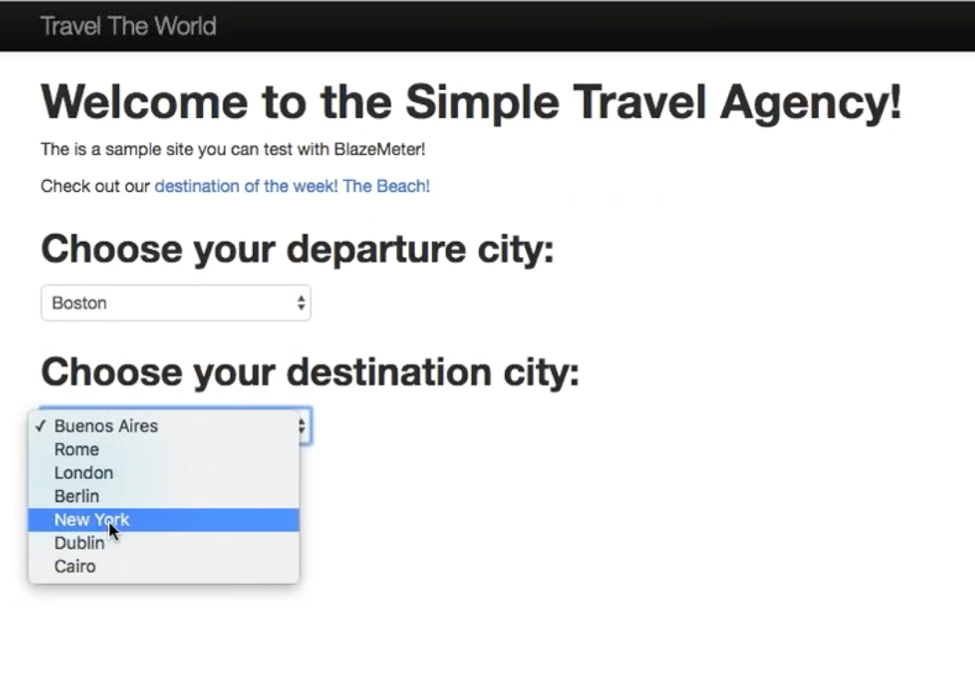
- Execute your user script
- When you’re done, open the BlazeMeter Chrome Recorder again and end the recording
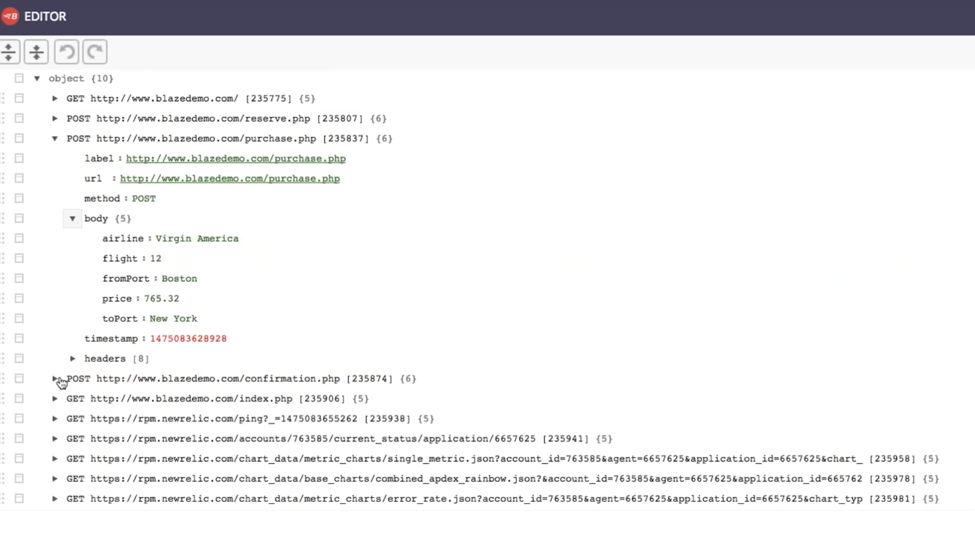
- By clicking on the pencil icon on the recorder, the editor opens up. In the editor, you can see the different values from your recording. These can be edited.
- Export the recording to JMX (the button is on the top right)

2. Configure your performance tests and run them
You can open the test in JMeter and in BlazeMeter.
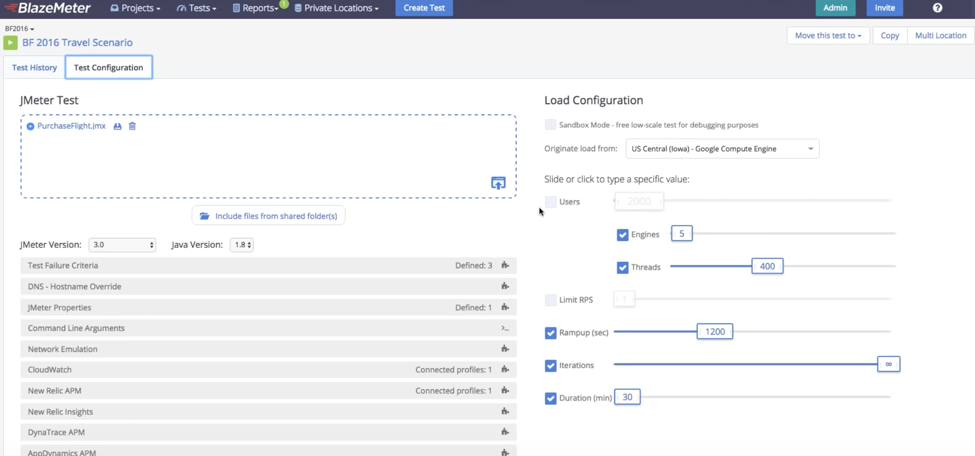
This dashboard, in BlazeMeter, demonstrates a test run for:
- 2,000 virtual users (VU)
- 5 engines
- 400 threads
- 1,200 seconds ramp-up duration (we recommend the ramp-up for your first performance test is 30 minutes - this ensures you reach your maximum value and can accurately identify issues)
- 30 minutes duration
- and from Iowa
In addition, CloudWatch is used for monitoring and New Relic is for APM.
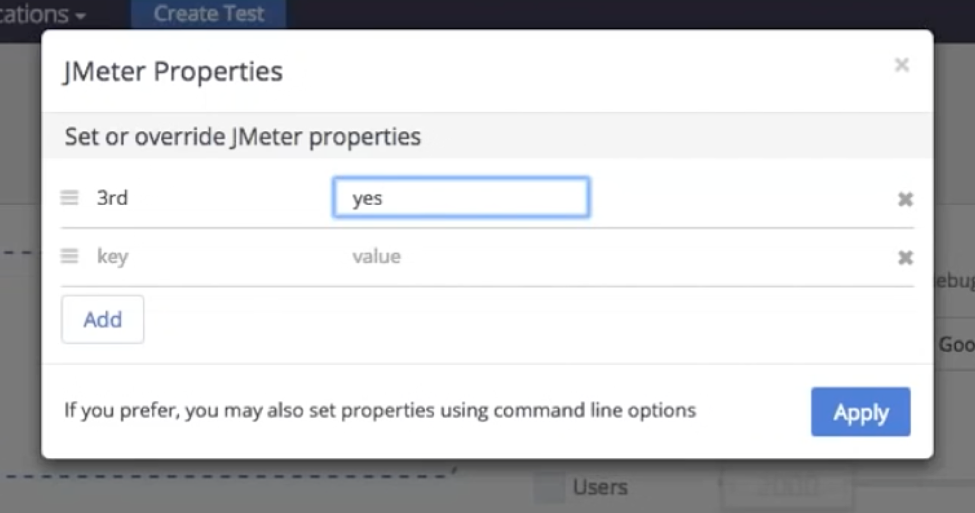
Additional configurations include:
- Executing 3rd party branches (to shut the branch down, go to the Remote Control and change the value to “no”. This takes less than a minute).
By setting Test Failure Criteria, you can easily receive feedback from the product into the performance test.
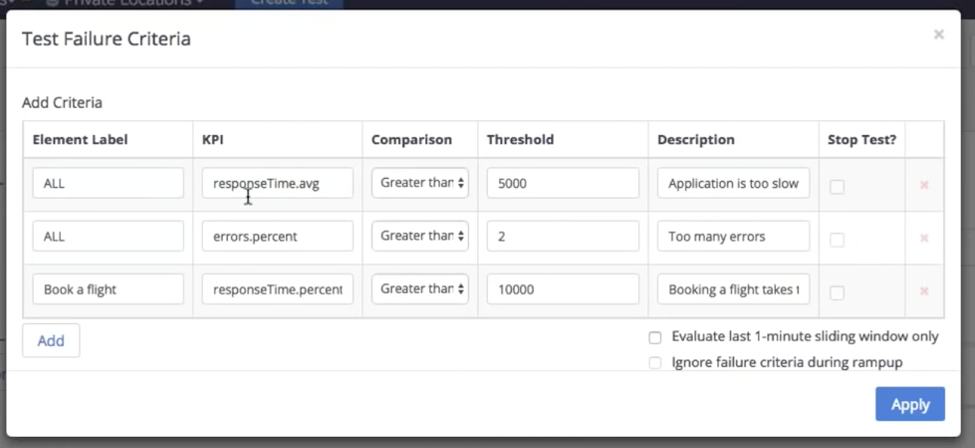
Here:
- If the overall Average Response Time is more than 5 seconds - the application is too slow
- If the overall Error Percentage is more than 2 - there are too many errors
- If the Response Time specifically for booking a flight is more than 10 seconds - booking a flight takes too much time
- After you finish configuring the test, click save, and start the test
3. View and analyze your results and identify your bottlenecks
The BlazeMeter dashboard presents multiple reports that let us identify the issues.
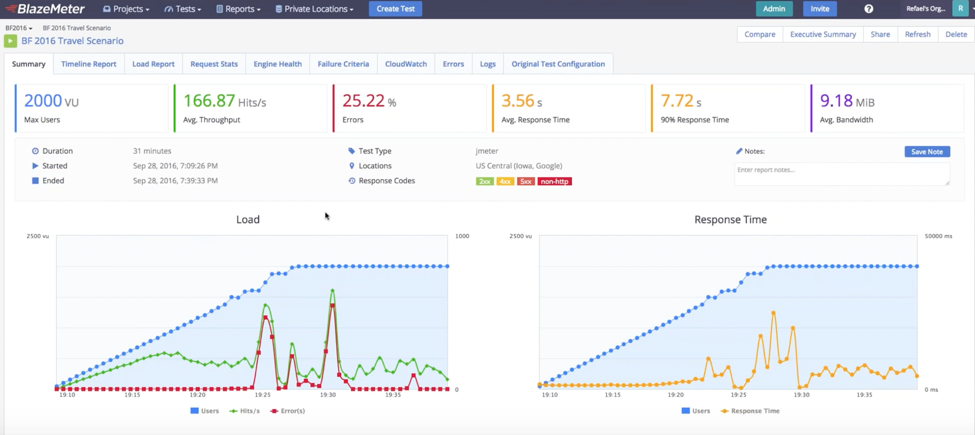
This Summary Report displays a summary of the test. It is clear the application failed, as the Error Percentage is more than 25%.

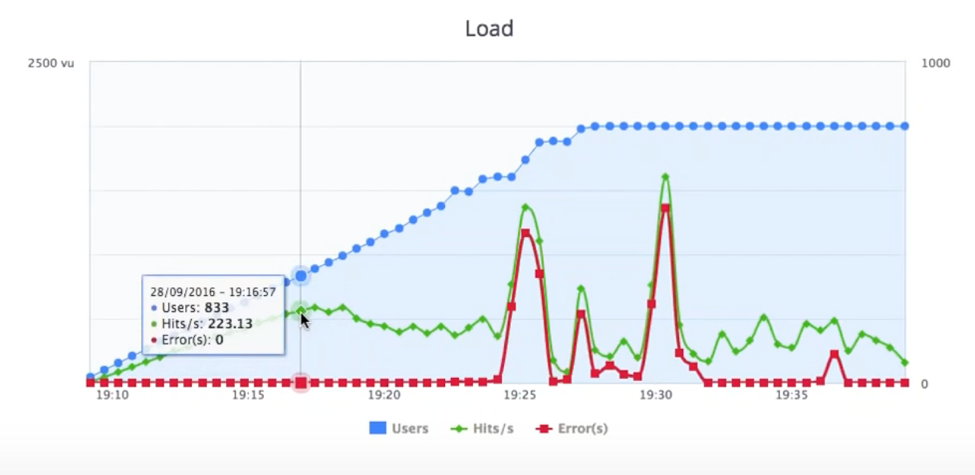
We can also see the test is saturated somewhere between 700 and 800 users, since the hits per second (Hits/s) stopped increasing even though the number of VU kept increasing.
By looking at the 2 graphs side by side, we can see how the Response Time bottleneck turned into errors.
For a more in-depth view, go to the Timeline Report. You can play around with the parameters you want to see. Here, we added the Average Call Time and the Throughput through the New Relic APM.
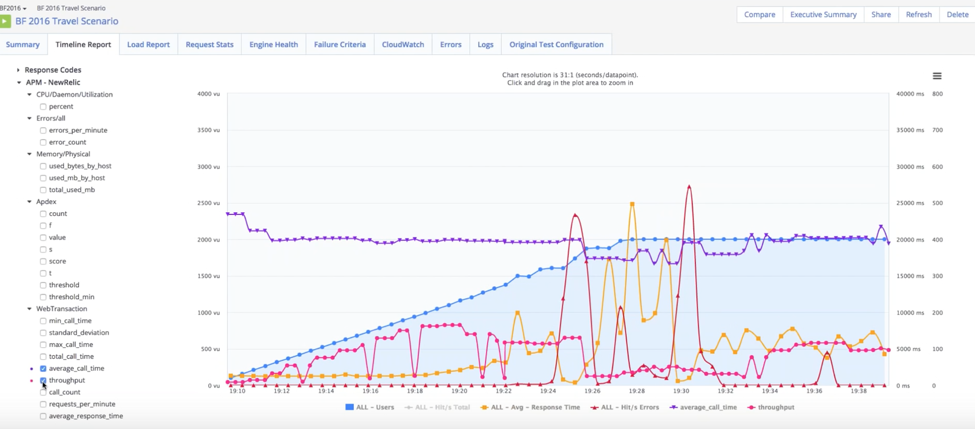
When the errors started increasing, the throughput decreased significantly. This means that some requests didn’t reach the application since the Firewall or Load Balancer failed.
If you go to CloudWatch, you can see that the surge queue length fluctuates. This means that the Load Balancer can’t fill the requests from the load test.
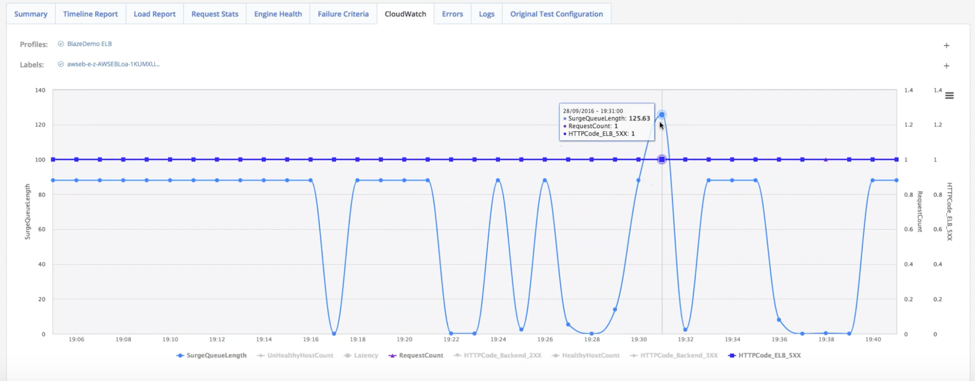
What should you do? Either call Amazon support to ensure they keep the Load Balancer warmed up on your big day, warm it up yourself, or change your load balancer.
Now let’s look at the Failure Criteria we configured before:
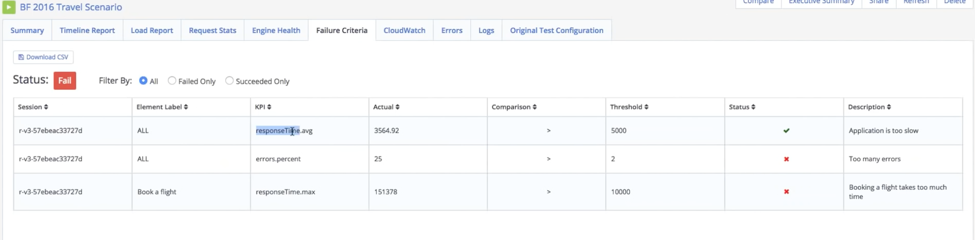
While the Response Time was satisfactory, the Errors Percentage was too high and the RT for “Book a Flight” was too high.
Test Configuration Tips
- Stress Test - Black Friday traffic peaks at 10:00 AM. Make sure your app can reach the maximum value you determined in a short period.
- Soak Test - The US has different time zones and customers can still be scattered throughout the day. Test the maximum value for a longer period - preferably 6-12 hours.
- Reach your limit - Even if you can handle the load you set for yourself, discover your bottlenecks. Add VUs and test for longer durations. You might be surprised during Black Friday.
After Black Friday
We recommend you run load test every 2-4 weeks. As you can see, the process is easy. By adopting a Continuous Delivery (CD) method, you can discover bottlenecks more efficiently and ensure you are always on point with your business plan.
Multiple tests over time also enable you to compare trends and changes, and analyze how you perform in real-time events.
Taurus, an open-source test-automation tool, integrates load testing tools into Continuous Integration tools like Jenkins.
Published at DZone with permission of Noga Cohen. See the original article here.
Opinions expressed by DZone contributors are their own.
Comments