How to Create Clear Project Roles and Responsibilities
Using a Circle Dot chart creates a clear visualization for assigning responsibilities for parts of a project on a team.
Join the DZone community and get the full member experience.
Join For FreeSorting out who does what on a project would appear to be pretty basic. Clear tasks, with clear responsibilities and deadlines, is Project Management 101. But in too many projects, it remains unclear who is responsible for a deliverable until it’s too late.
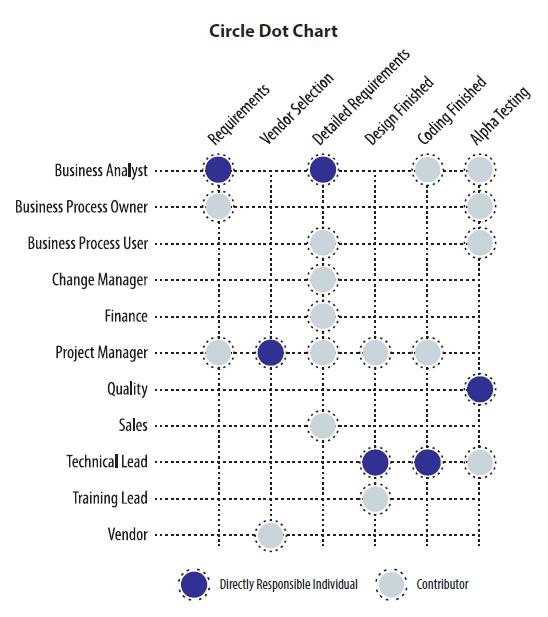
The Circle Dot Chart addresses this issue. It’s a tool for getting clear on what deliverables are due, when, and who is responsible for them. The chart consists of lines that represent tasks, and circles at the intersection of tasks and functional responsibilities. It identifies key deliverables on the horizontal axis and key roles or key individuals on the vertical axis. Open circles indicate that an individual function is involved, while solid circles represent the directly responsible individual (DRI) for a given deliverable. It is essential that there be one and only one DRI.
Here’s how to create a Circle Dot Chart for your project:
- The team identifies key tasks (approximately 5-15) from the project plan and puts them in time sequence across the top of the chart.
- The team lists the key functions responsible for delivering the program. It is important that participation in a task is discerned from responsibility for delivering the task.
- Indicate any functional group involved in a particular task with an open circle. Represent the one function that is ultimately responsible for fulfilling the task with a solid circle.
- The project manager may also fill out a rough draft of the chart and then hold a review session with the team.
- At the end of the review session, the functional representatives sign off on their various assignments.
Store this document in the project team repository for easy access and review. When key tasks are coming due, you can quickly review who is responsible for delivering them. Most importantly, this is a living document. If responsibilities change, you must update the chart to reflect these changes.
In very large or very small programs, modify the tool to match the scope of the tasks at hand. For large projects, you can do this by having two levels of Circle Dot Charts – one overall and several others at sub-system levels. For example, in platform programs, there might be a total of four Circle Dot Charts: three second-level charts to cover the web, the client, and the device, and one for the project as a whole.
Sometimes there is also a need for even greater clarity on tasks and roles. In this case, the three levels of uninvolved, involved, and responsible are not sufficient, and you may need to add other roles such as approves and consults. There is a related technique called “CAIRO” (Consults, Approves, Involved, Responsible, and Off (not involved)) that you can apply in this instance.
This chart’s greatest value is in the review session where the team discusses and agrees on the deliverables and who is responsible for them. The Circle Dot Chart is useful for any team, but it is especially helpful for globally dispersed groups, separated by time, distance, language, and culture. The chart prevents wasted effort resulting from having two people working on the same task. It also helps the team share a common understanding of roles at the beginning of the project.
Don’t miss another key deliverable! Make sure that you have a written agreement on roles and responsibilities before you receive an unwelcome project setback.
Opinions expressed by DZone contributors are their own.
Comments