Creating a Web Project: Key Steps to Identify Issues
Learn how to identify web project issues through performance analysis, effective debugging, and product metrics tracking.
Join the DZone community and get the full member experience.
Join For FreeWhen developing a product, issues inevitably arise that can impact both its performance and stability. Slow system response times, error rate increases, bugs, and failed updates can all damage the reputation and efficiency of your project.
However, before addressing these problems, it is essential to gather and analyze statistics on their occurrence. This data will help you make informed decisions regarding refactoring, optimization, and error-fixing strategies.
Step 1: Performance Analysis
Performance is a crucial metric that directly affects user experience. To improve it, the first step is to regularly track its key indicators:
- Monitor server response time. Measure and track response time variations based on time of day, server load, or system changes.
- Track memory and resource consumption. Regular monitoring helps identify issues early. By analyzing this data, you can assess the quality of releases and patches, detect memory leaks, and plan for hardware upgrades or refactoring.
- Analyze SQL queries. Gather statistics on the slowest queries and their frequency.
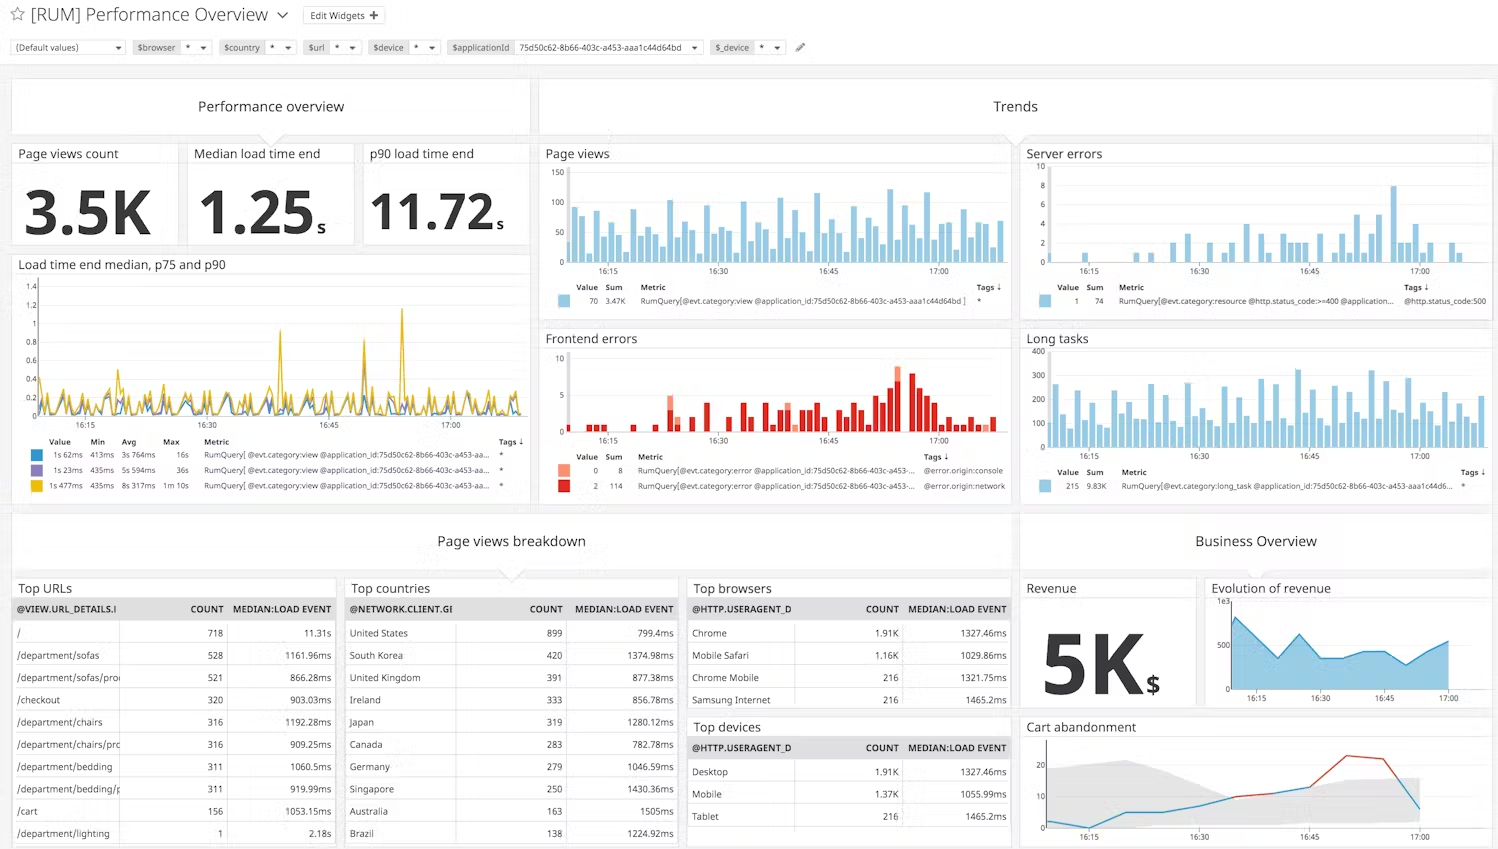
There are numerous ways to collect these data points. Various comprehensive Application Performance Monitoring (APM) systems, such as New Relic, Datadog, Dynatrace, AppSignal, and Elastic APM, provide deep insights into your applications.
These tools help identify performance bottlenecks, troubleshoot issues, and optimize services by profiling applications and tracking performance at specific code segments. However, these solutions are often paid services; they can be complex to configure or just overkill, especially for smaller teams.
slow_query_log = 1  # Enables logging

long_query_time = 20  # Defines slow query threshold (seconds)

slow_query_log_file = /var/log/mysql/slow-query.log  # Log file location

log-queries-not-using-indexes = 1  # Log queries without indexes
You can then view the log using:
tail -f /var/log/mysql/slow-query.logOr:
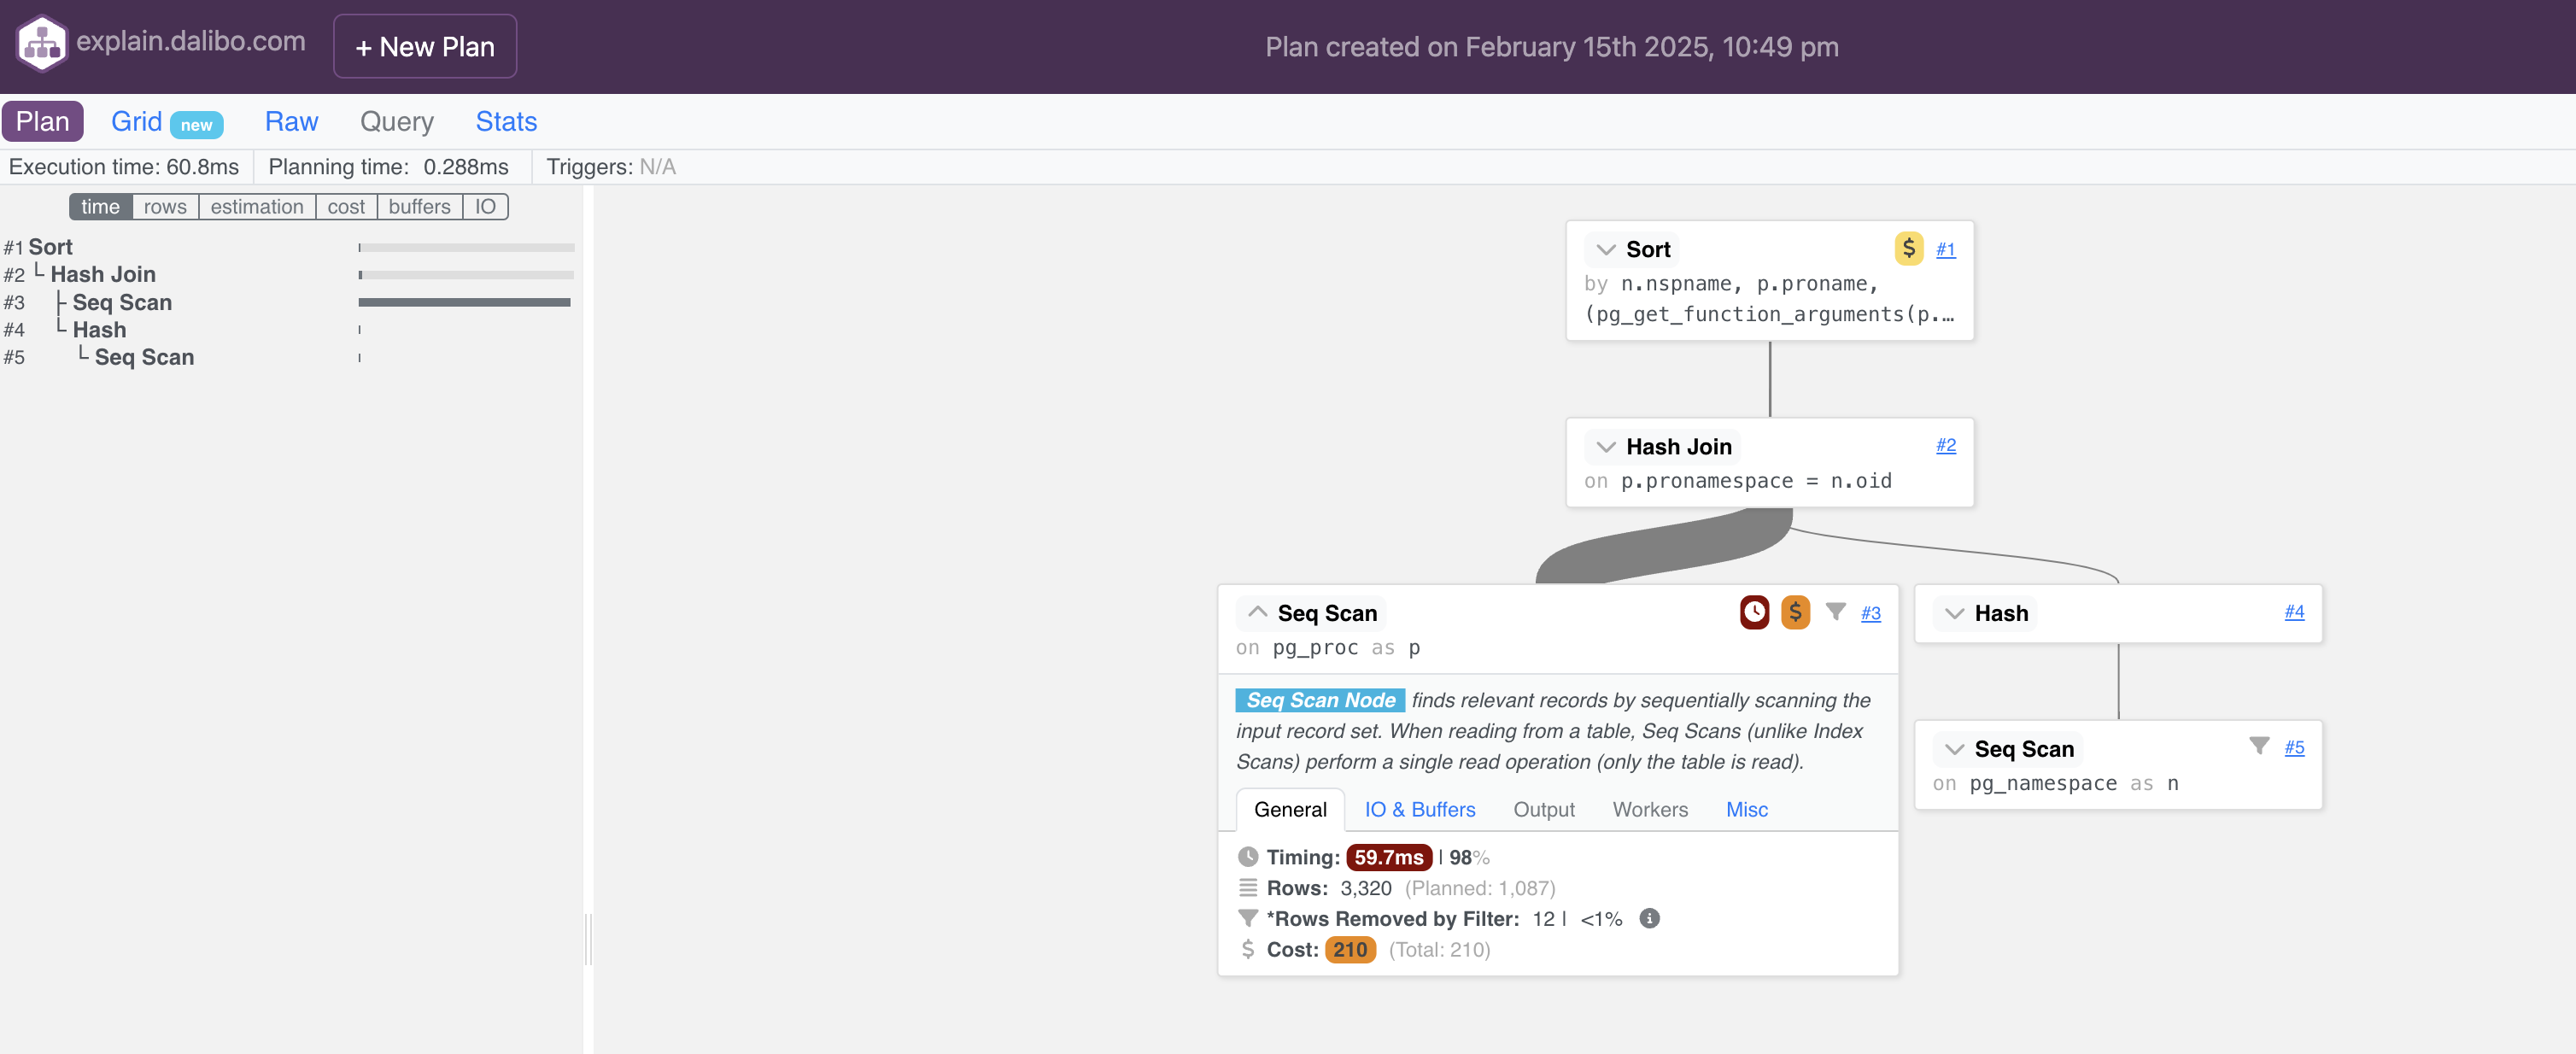
mysqldumpslow /var/log/mysql/slow-query.logThen, you can analyze the query plan in a conventional way using tools like EXPLAIN (EXPLAIN ANALYZE), etc. By the way, for a better understanding of EXPLAIN results, you can use services to visualize problem areas, such as https://explain.dalibo.com or https://explain.depesz.com.
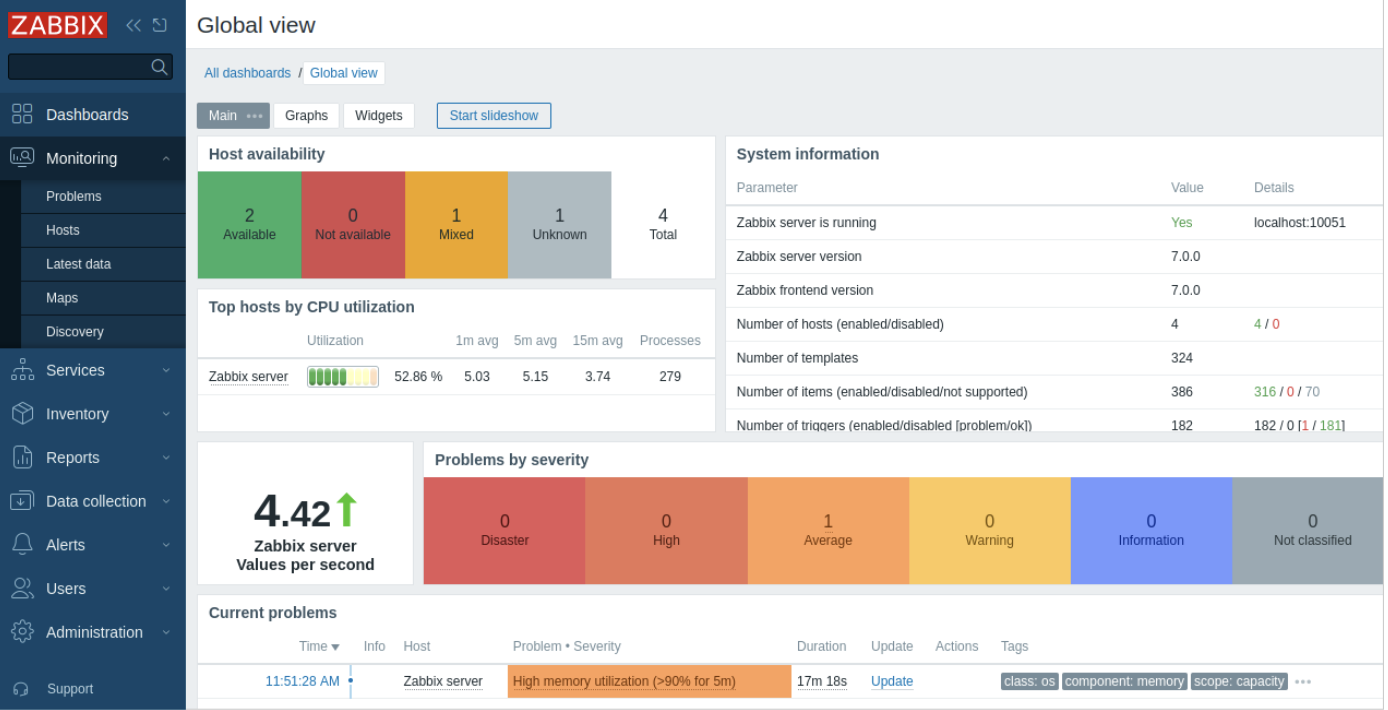
For real-time server monitoring, Zabbix collects data on memory, CPU, disk usage, network activity, and other critical resources. It can be easily deployed on any operating system and supports push data collection models, auto-registration of agents, custom alerts, and data visualization.
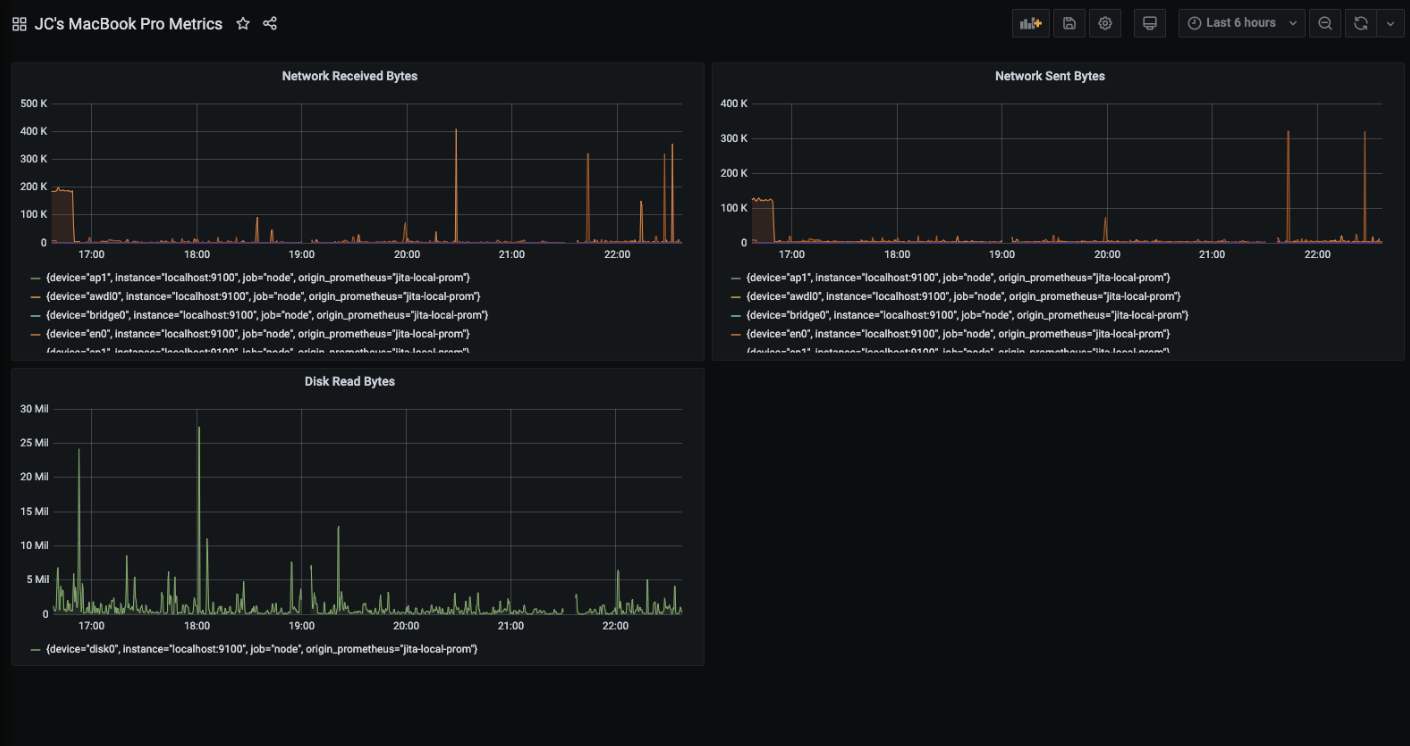
Another powerful alternative is the Grafana + Prometheus combination.
Prometheus collects metrics from servers, applications, databases, and other sources using exporters, stores these metrics in the database, and provides access via the powerful PromQL query language. Grafana connects to Prometheus (and other data sources), allowing the creation of graphs, dashboards, alerts, and reports with an intuitive interface for visualization and filtering. Notably, there are already hundreds of pre-built Prometheus exporters for metric collection, such as: node_exporter, mysql_exporter, nginx_exporter.
Step 2: Debugging Project Issues
Bugs are inevitable, so it is essential not just to fix them, but also to properly track and analyze their reasons and their fixing time. Every new bug or defect should be logged in a task management system, with a corresponding ticket for resolution. This allows for:
- Correlating bug frequency with product version releases.
- Measuring bug resolution time.
- Evaluating debugging efficiency for future planning.
If you use Jira, the Jira Dashboards feature provides filtered statistics using JQL (Jira Query Language). The Created vs Resolved Chart offers a clear visualization of bug trends.
But before you can analyze fixing times, you should first set up tools for error aggregation and prioritization. ELK Stack (Elasticsearch, Logstash, Kibana) is a popular standard, allowing log collection from multiple sources and storing them in Elasticsearch for deep analysis with Kibana.
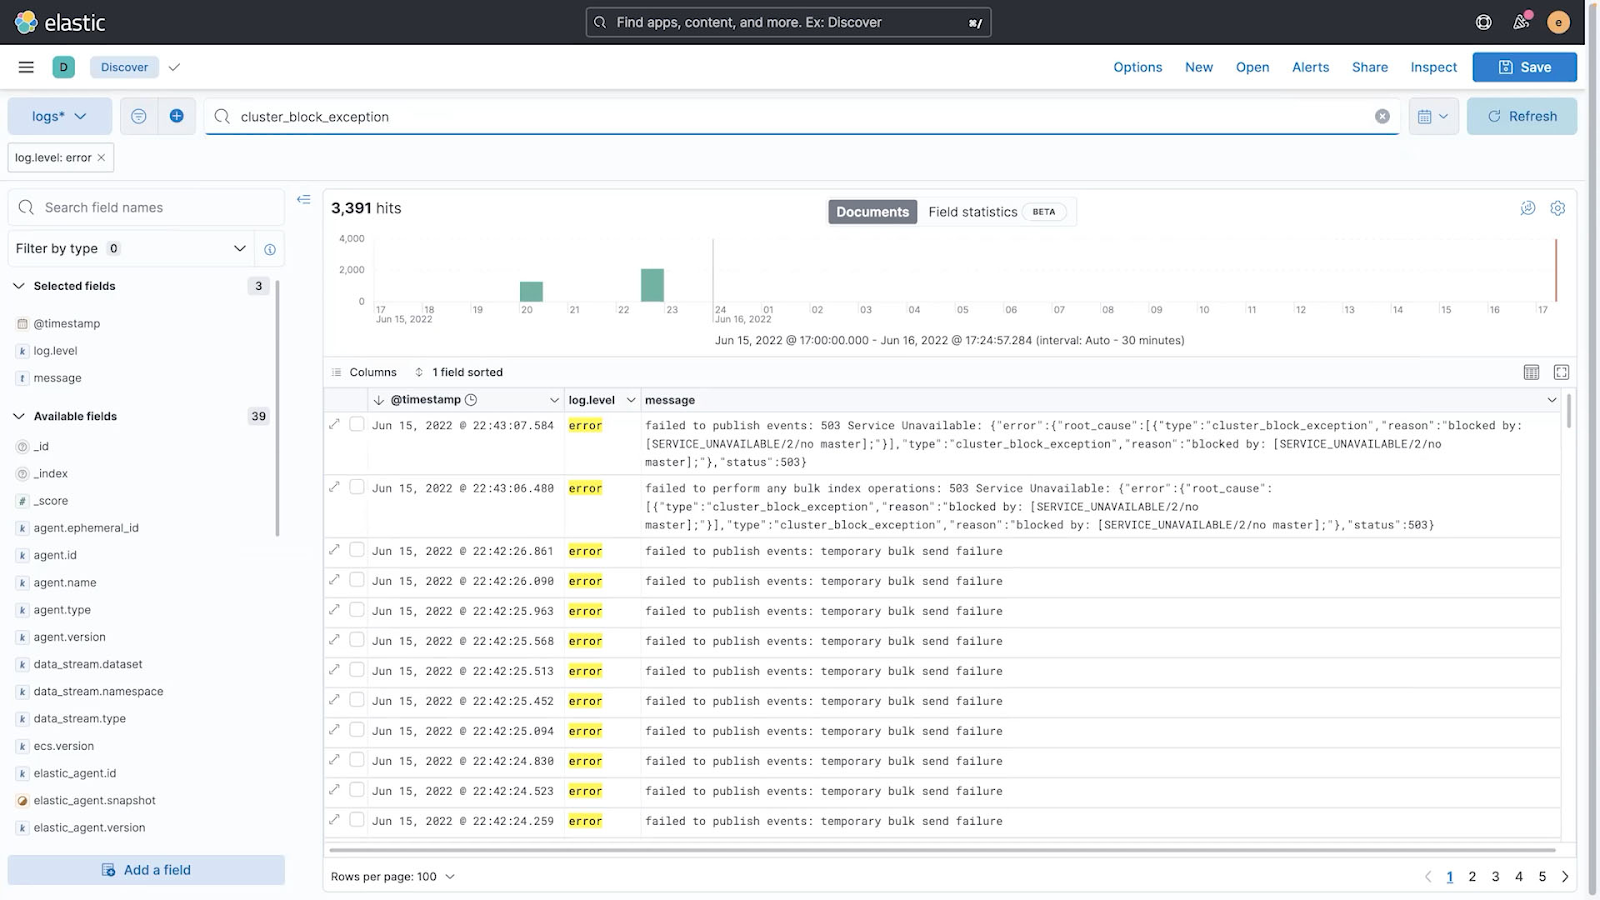
However, the ELK Stack is not the only solution. You can also use Grafana Loki. Loki is easier to configure, integrates seamlessly with Grafana for visualization, and is ideal for projects that require a lightweight and user-friendly log management solution.
A great approach is to set up error notifications. For example, if a previously unseen error occurs or the number of such errors exceeds a set threshold, the system can notify developers. In some teams, a ticket is automatically created in a task tracker for further investigation and resolution. This helps reduce response time for critical bugs and ensures project stability, especially during frequent releases and updates.
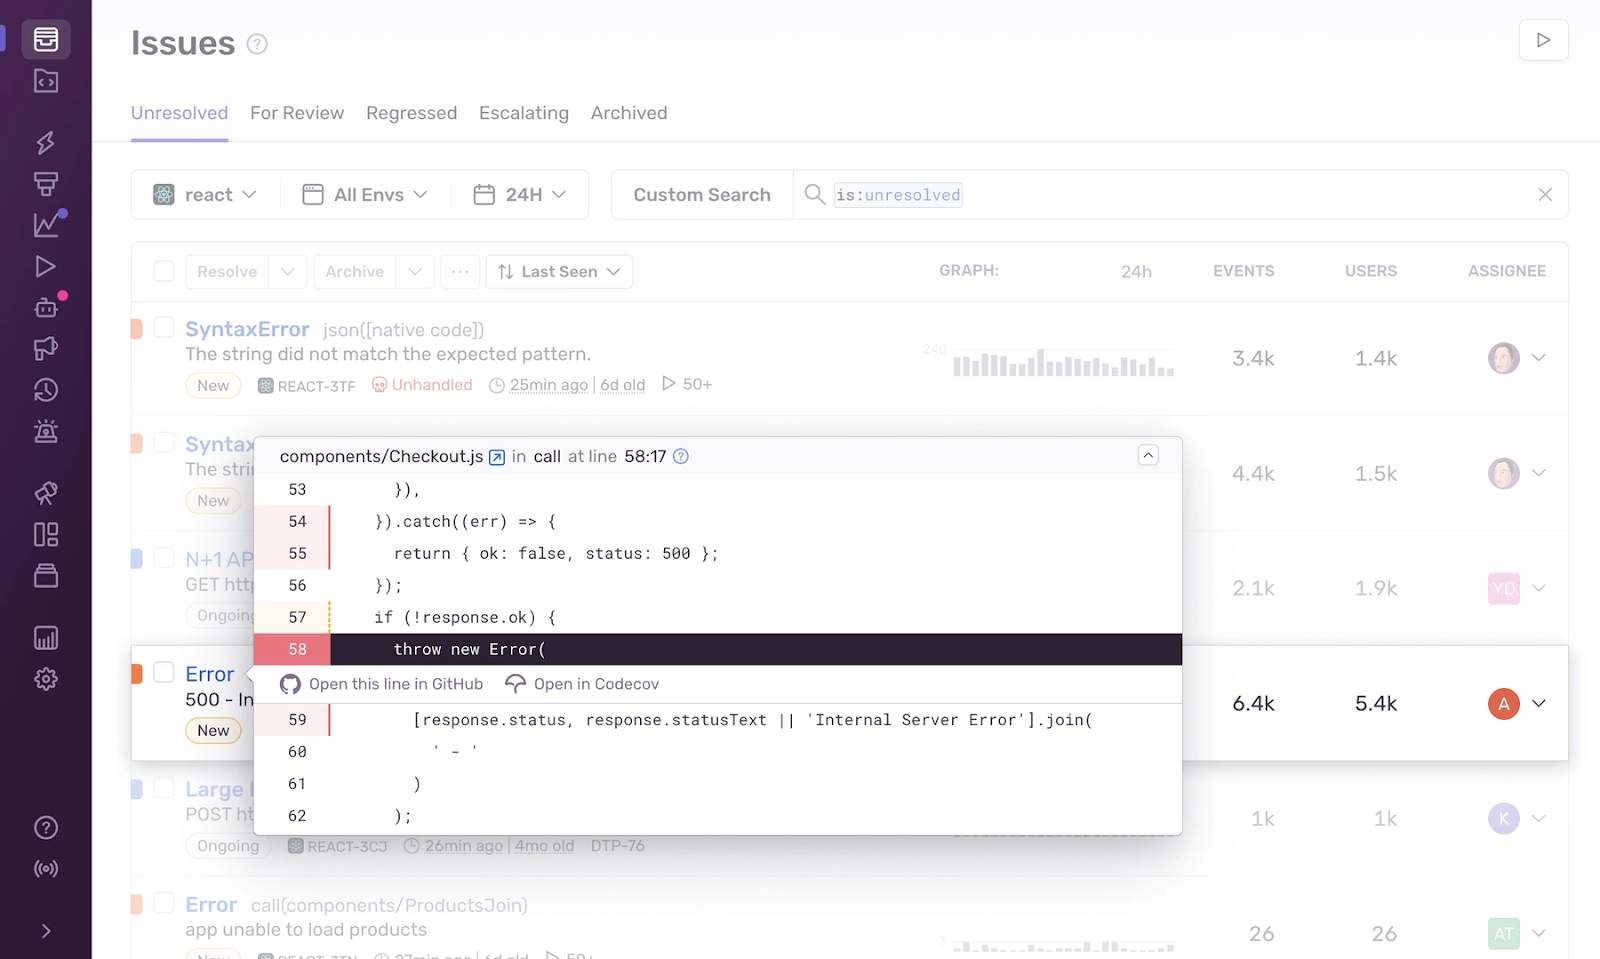
Another popular error-tracking tool worth mentioning is Sentry. It easily integrates with any application or web server, allowing log collection from various sources for in-depth analysis. Key features include:
- Tracking error occurrences and their frequency.
- Configurable alerts based on specific rules (e.g., sending notifications to a messenger or email).
- Flexible integrations with task management systems (e.g., automatic bug task creation in Jira).
APM systems such as Datadog or New Relic (mentioned earlier) also provide tools for error analysis. If you're already using an APM solution, it might be a suitable choice for your needs.
Finally, user feedback should not be overlooked. Users may report issues that automated systems fail to detect but significantly impact their experience. Since most systems are developed for users, collecting and analyzing their feedback is an invaluable data source that should never be ignored.
Step 3: Collecting Product Metrics
During both the development and usage stages, issues don’t always manifest directly as bugs or errors. Sometimes, they appear through changes in product metrics. For example, a minor bug or hidden error might lead to a drop in sales, reduced user session duration, or an increase in bounce rates. Such changes can go unnoticed if product metrics are not actively monitored.
This is why collecting and tracking product metrics is a crucial part of any project. Metrics help detect problems before they result in significant financial losses and serve as an early warning system for necessary analysis, changes, or optimizations.
The specific product metrics to track will vary depending on the type of project, but some are common across industries. These are key examples:
User Engagement Metrics
- Average time spent on the website or in the app
- Number of active users (DAU – Daily Active Users, MAU – Monthly Active Users)
- Retention rate – how often users return
Financial Metrics
- Number of sales or subscriptions
- Average revenue per user (ARPU)
- Conversion rate – the percentage of users who complete a target action
User Acquisition Metrics
- Advertising campaign effectiveness
- Bounce rate – percentage of users who leave without interaction
- Conversion rates from different traffic sources (SEO, social media, email marketing)
Each metric should be aligned with business goals. For example, an e-commerce store prioritizes purchase conversion rates, while a media platform focuses on average content watch time.
Context Matters
When analyzing any metrics (whether technical or product-related), always take external factors into account. Weekends, holidays, marketing campaigns, and seasonal activity spikes all influence system performance and the statistics you collect. Compare data across different time frames: year-over-year, week-over-week, or day-to-day. If your project operates internationally, consider regional differences – local holidays, cultural variations, and user habits can significantly impact results. The effectiveness of changes can vary greatly depending on the audience. For example, performance improvements in one region may have little impact on metrics in another.
Conclusion
Almost no serious issue can be identified without collecting large amounts of data. Regular monitoring, careful analysis, and consideration of context will help your product grow and evolve under any circumstances. However, keep in mind that collecting excessive data can hinder your analysis rather than help. Focus on gathering only the most relevant metrics and indicators for your specific project.
Opinions expressed by DZone contributors are their own.
Comments