DZone
Thanks for visiting DZone today,
Edit Profile
  • Manage Email Subscriptions
  • How to Post to DZone
  • Article Submission Guidelines
Sign Out View Profile
  • Post an Article
  • Manage My Drafts
Over 2 million developers have joined DZone.
Log In / Join
Please enter at least three characters to search
Refcards Trend Reports
Events Video Library
Refcards
Trend Reports

Events

View Events Video Library

Zones

Culture and Methodologies Agile Career Development Methodologies Team Management
Data Engineering AI/ML Big Data Data Databases IoT
Software Design and Architecture Cloud Architecture Containers Integration Microservices Performance Security
Coding Frameworks Java JavaScript Languages Tools
Testing, Deployment, and Maintenance Deployment DevOps and CI/CD Maintenance Monitoring and Observability Testing, Tools, and Frameworks
Culture and Methodologies
Agile Career Development Methodologies Team Management
Data Engineering
AI/ML Big Data Data Databases IoT
Software Design and Architecture
Cloud Architecture Containers Integration Microservices Performance Security
Coding
Frameworks Java JavaScript Languages Tools
Testing, Deployment, and Maintenance
Deployment DevOps and CI/CD Maintenance Monitoring and Observability Testing, Tools, and Frameworks

Modernize your data layer. Learn how to design cloud-native database architectures to meet the evolving demands of AI and GenAI workkloads.

Secure your stack and shape the future! Help dev teams across the globe navigate their software supply chain security challenges.

Releasing software shouldn't be stressful or risky. Learn how to leverage progressive delivery techniques to ensure safer deployments.

Avoid machine learning mistakes and boost model performance! Discover key ML patterns, anti-patterns, data strategies, and more.

Related

  • Grafana Analysis and Visualization with CA APM
  • Power BI Embedded Analytics — Part 1: Introduction and Power BI Authoring Overview
  • Grafana Loki Fundamentals and Architecture
  • Creating a Web Project: Key Steps to Identify Issues

Trending

  • A Modern Stack for Building Scalable Systems
  • Streamlining Event Data in Event-Driven Ansible
  • GDPR Compliance With .NET: Securing Data the Right Way
  • Cookies Revisited: A Networking Solution for Third-Party Cookies
  1. DZone
  2. Data Engineering
  3. Data
  4. Creating Visualizations in Grafana

Creating Visualizations in Grafana

For those getting started with Grafana for monitoring, this tutorial will help you create a visualization using your Prometheus metrics.

By 
Satish Sharma user avatar
Satish Sharma
·
Aug. 23, 18 · Tutorial
Likes (6)
Comment
Save
Tweet
Share
46.0K Views

Join the DZone community and get the full member experience.

Join For Free

In this article, we will learn how to create visualizations in Grafana for monitoring. Our aim is to create a visualization that shows the hit count of an endpoint.

Assumptions

  1. You have a REST application which exposes Prometheus metrics as an endpoint (in our case, http://localhost:9000/actuator/prometheus). Follow this article for a step by step guide to expose metrics. You can get the application I used from this GitHub repository.
  2. You have a working instance of Prometheus and Grafana running. If not, follow the steps in this article to set things up and running.

Let's create our visualization following the steps below:

  1. Add your metrics endpoint as a datasource in Grafana. You can follow this article for a step-by-step guide.
  2. Create a visualization
    1. Click in the "+" icon on right sidebar.
    2. From the Create menu, select "Dashboard."dashboard
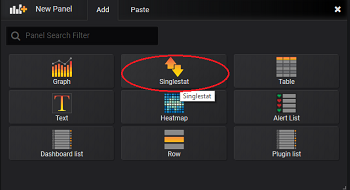
    3. Select "Singlestat" in the "add" tab in a new panel (as we only have a single count gauge).Image title
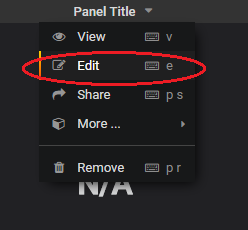
    4. A blank panel will be added to the screen. Click on the drop-down icon on the panel title. Select "Edit" from the options.Image title
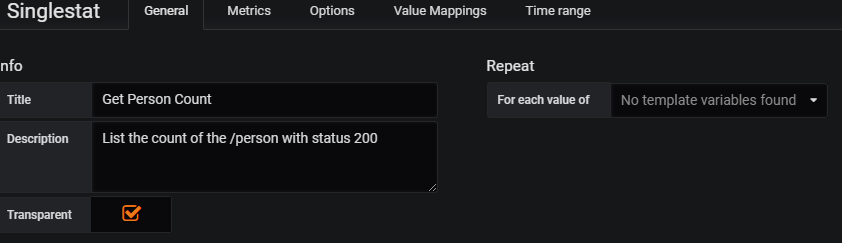
    5. Select "General" from the tabs. You can edit basic information from this screen. In the title section, you can rename the title for the panel — let's say "Get Person Count."Image title
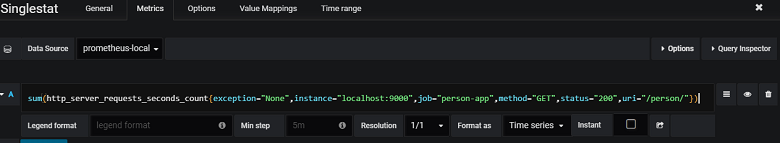
    6. Select the "Metrics" tab and from the "Data Source" drop-down, select "prometheus-local" (remember that we added this as our datasource in an earlier step). Add the below query in the query section provided: http_server_requests_seconds_count{exception="None",instance="localhost:9000",job="person-app",method="GET",status="200",uri="/person"}Image title
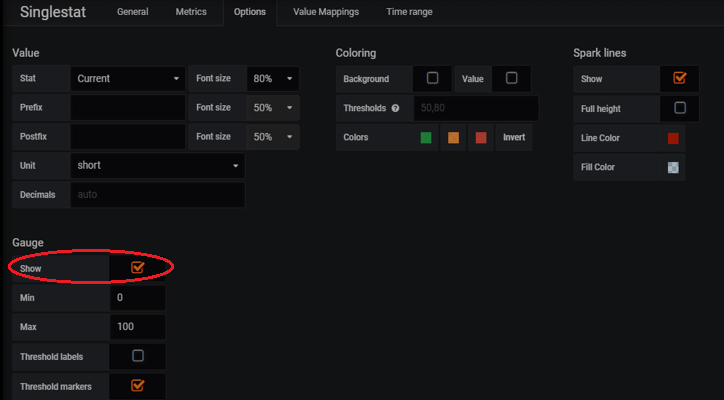
    7. In the "Options" tab, click on to the checkbox for "show" in the Gauge section. You can change the colors and other options if you want to.Image title
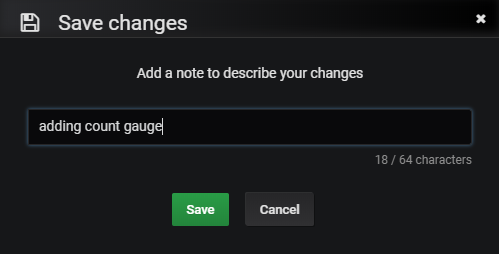
    8. Save the changes by pressing "CTRL + S". Enter comments and click "save."Image title
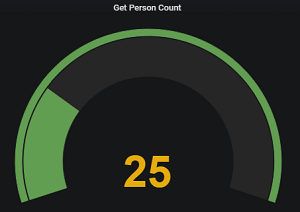
    9. You should be able to see the total hit count for the "/person" api in a guage.Image title
    10. Congratulations! We got our gauge showing the total hit count. Below is a sample dashboard created for JVM monitoring.Image title

In our next article, we shall be monitoring a MySQL database using Grafana.

Visualization (graphics) Grafana

Opinions expressed by DZone contributors are their own.

Related

  • Grafana Analysis and Visualization with CA APM
  • Power BI Embedded Analytics — Part 1: Introduction and Power BI Authoring Overview
  • Grafana Loki Fundamentals and Architecture
  • Creating a Web Project: Key Steps to Identify Issues

Partner Resources

×

Comments
Oops! Something Went Wrong

The likes didn't load as expected. Please refresh the page and try again.

ABOUT US

  • About DZone
  • Support and feedback
  • Community research
  • Sitemap

ADVERTISE

  • Advertise with DZone

CONTRIBUTE ON DZONE

  • Article Submission Guidelines
  • Become a Contributor
  • Core Program
  • Visit the Writers' Zone

LEGAL

  • Terms of Service
  • Privacy Policy

CONTACT US

  • 3343 Perimeter Hill Drive
  • Suite 100
  • Nashville, TN 37211
  • support@dzone.com

Let's be friends:

Likes
There are no likes...yet! 👀
Be the first to like this post!
It looks like you're not logged in.
Sign in to see who liked this post!