Monitoring MySQL Server Using Prometheus, Grafana, and mysqld_exporter
Learn how to use Grafana and Prometheus to monitor your database server and get visual insights so you can take action as soon as possible.
Join the DZone community and get the full member experience.
Join For FreeDuring the course of our careers, we deal with database servers handling thousands and sometimes millions of transactions. We also face different issues like table locks, slow queries, and max connections reached, to name a few.
In order to solve these issues, most of the time, we get the information from logs and inspect variables or performance schema. What if we could get visual insights of what is happening inside our database server so that we could take any preventive or corrective actions?
There are multiple options available in both the commercial and open source world to provide visual insights, but Prometheus and Grafana are among the leaders in the open source space.
In this article, we shall be using Prometheus, Grafana, and mysqld_exporter for Prometheus to monitor our MySQL server. So let us get started by first understanding why we need mysqld_exporter.
Grafana is one of the leading open-source metrics monitoring and visualization tools. It allows you to query, visualize, and make alerts from your metrics from about 30+ open-source and commercial data sources. Grafana is distributed with a built-in MySQL data source plugin that allows you to query and visualize data from a MySQL-compatible database.
If you are good with SQL queries, then, of course, you can build monitoring using queries only, as the MySQL plugin allows you to run queries directly, but that is going to be a hectic and lengthy task.
Also, Prometheus is a "Pull" based system, which means the Prometheus server fetches (called "scraping" in the Prometheus world) the metrics from the running application periodically.
But the MySQL server does not provide any endpoint from which Prometheus can scrape the metrics directly. To solve this issue, the Prometheus community has developed exporters. The job of an exporter is to extract metrics from a target application using the language the underlying application understands and then expose them over REST. From there, the Prometheus server can scrape the metrics. For MySQL, we are going to use "mysqld_exporter," which is the official exporter for MySQL from the Prometheus community.
Note: Though mysqld_exporter supports MySQL version 5.1 and above, Not all the collection methods are suported for MySQL version < 5.6.
Environment:
Windows: for other operating systems, steps may vary.
Prometheus: prometheus-2.2.1.windows-amd64
Grafana: grafana-5.1.0
MySQL: 5.7.20
mysqld_exporter: version 0.10.0.windows-amd64
I assume that you have already set up Prometheus with Grafana. If not, then you can follow this article where we have seen how to setup and add Prometheus as a datasource in Grafana.
Step 1. Configure Exporter for MySQL
Download mysqld_exporter for your operating system.
Extract the distribution in your file system.
The exporter needs some grants on the target MySQL instance so that it can query the server for metrics. It is better to create a separate user for the exporter and add grants for them. I am creating a user called "prom_exporter" and adding grants by running the below query on the MySQL server. It is always good to set a max connection limit for the user to avoid overloading the MySQL server.
CREATE USER 'prom_exporter'@'localhost' IDENTIFIED BY 'XXXXXXXX' WITH MAX_USER_CONNECTIONS 3;
GRANT PROCESS, REPLICATION CLIENT, SELECT ON *.* TO 'prom_exporter'@'localhost';- mysqld_exporter needs the username and password it can use to connect to database server. There are two ways you can supply this information to the exporter:
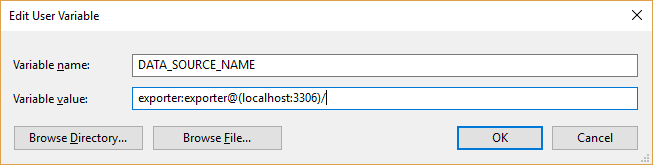
- Using the Environment Variable: create an environment variable by the name "DATA_SOURCE_NAME" and the value shall be in the format "user:password@(hostname:3306)/."
![Image title]()
- Using the configuration file: You can create a file ".my.cnf" and put the username and password in that file.
- Using the Environment Variable: create an environment variable by the name "DATA_SOURCE_NAME" and the value shall be in the format "user:password@(hostname:3306)/."
user=USER_CREATED_FOR_EXPORTER
password=YOUR_PASSWORD
That is all the configuration which is required for the exporter.
Step 2. Configure Prometheus Server to Scrape Metrics From Our Exporter
Create a new file, or if you have any existing configuration files for Prometheus, then update the "scrape_configs" section of that file. In my case, I am only monitoring MySQL so my configuration file is as below.
global:
  scrape_interval:     5s # Set the scrape interval to every 15 seconds. Default is every 1 minute.
  evaluation_interval: 5s # Evaluate rules every 15 seconds. The default is every 1 minute.


scrape_configs:
  - job_name: 'mysql-monitor'# Job name
    static_configs:
      - targets: ['localhost:9104']#mysqld_exporter address and port
        labels:
            alias: db1# alias name given to this instance
Step 3. Run Exporter and Prometheus Server
If you have been using ".my.cnf" file to supply the username and password, then you can supply the location of the file using the flag "--config.my-cnf= CNF_FILE_PATH." If you are using environment variables, then there is no need to use this flag. Start the exporter using the command mysqld_exporter.exe <flags> . As I am using environment variables, I am not supplying the flag. 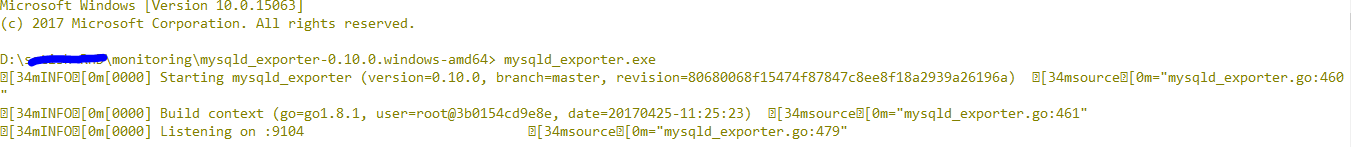 By default, the exporter exposes metrics at port 9104. If you browse the URL "http://localhost:9104/metrics," you will be able to see the exported metrics as something like below.
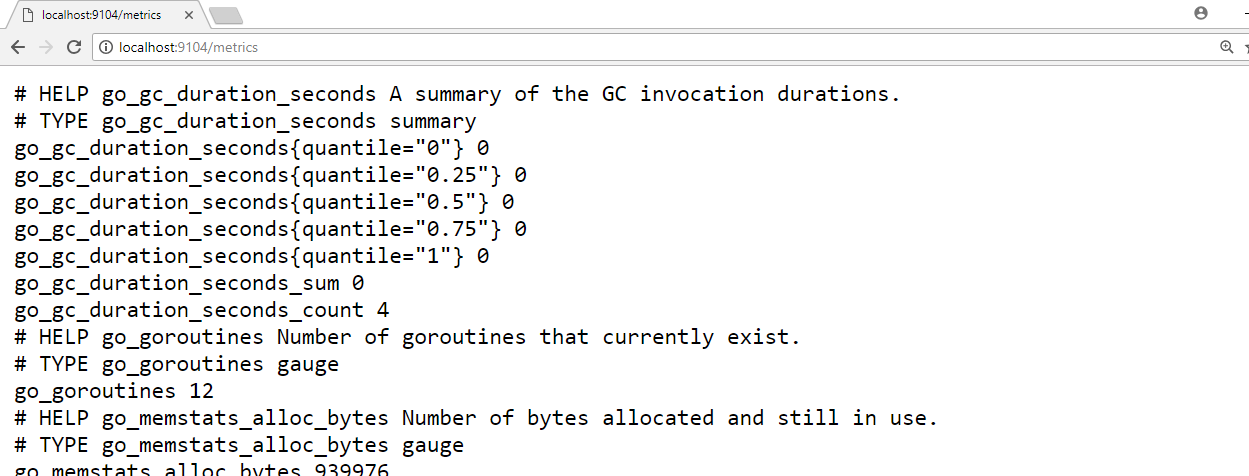
Run/Restart Prometheus: As we have configured Prometheus to scrape metrics in Step 2, we can now start the Prometheus server using the command prometheus.exe --config.file=CONFIG_FILE_PATH 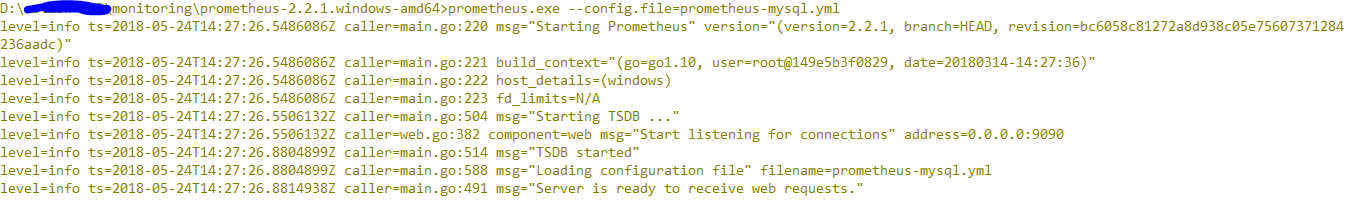
Step 4. Create Visualization
I assume that you already have a running Grafan instance and have added Prometheus as a data source in Grafana. If not, then please follow the steps in this article. In this article, we are going to monitor the number of "Current Active Connections" and "Maximum number of connection used" since the server started.
Click on the "+" icon in the left sidebar menu.
Select "Dashboard." It will provide an option to select panel type.
Select "Graph" from the options.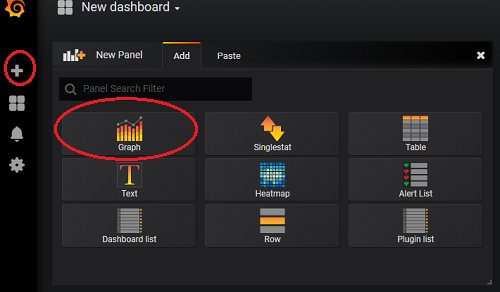
This will open a blank graph panel. Select the dropdown using the dropdown icon next to "Panel Title" and select "Edit."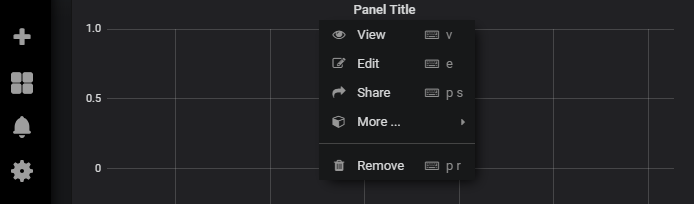
From the tabs below, click on the "General" tab. In this tab, you can provide the generic information about the graph, such as name and description. Let us add "Connections" in the "Title" field. I am using "Connection Monitor."
 Select the "Metrics" tab.
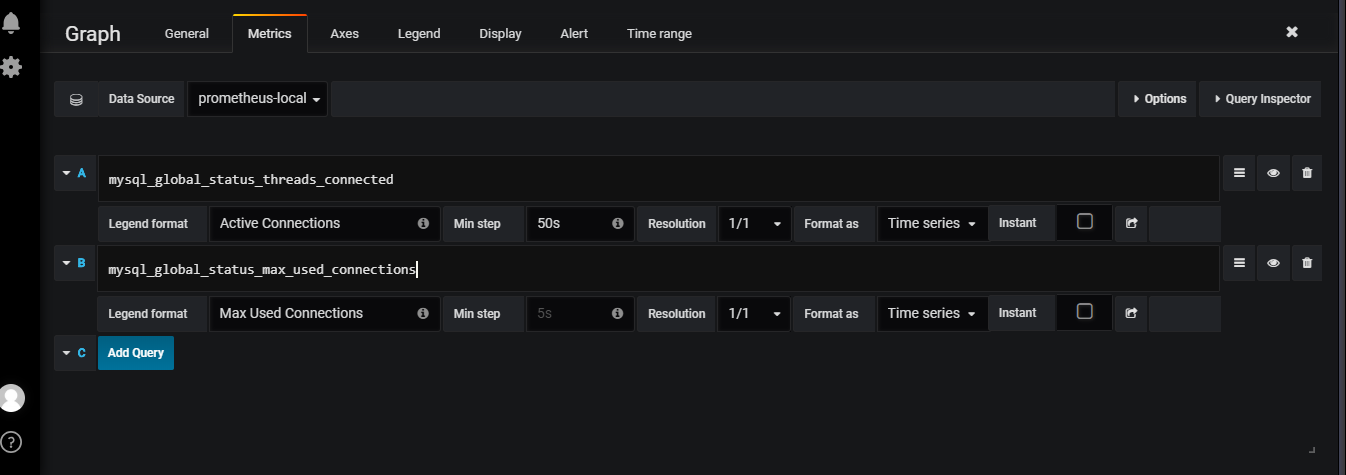
- Select "prometheus-local" from the Data Source drop-down. Remember we used this name while adding our Prometheus instance as a data source in Grafana.
- For active connections
- Legend Format: Active Connections
- Query:
mysql_global_status_threads_connected
- For Max used connections
- Legend Format: Max Used Connections
- Query:
mysql_global_status_max_used_connections
Adjust options for axes from the Axes tab. I am only changing the minimum value to "0" (zero), and the rest I am leaving to defaults. 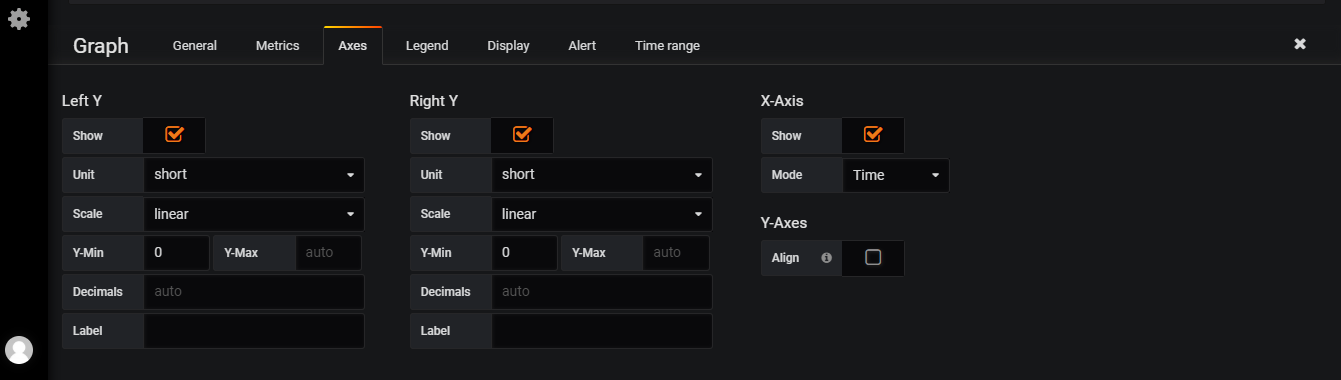
Configure your legend related settings from the "Legend" tab. This will affect how the legends are shown on the panel with what options and at what place they are displayed.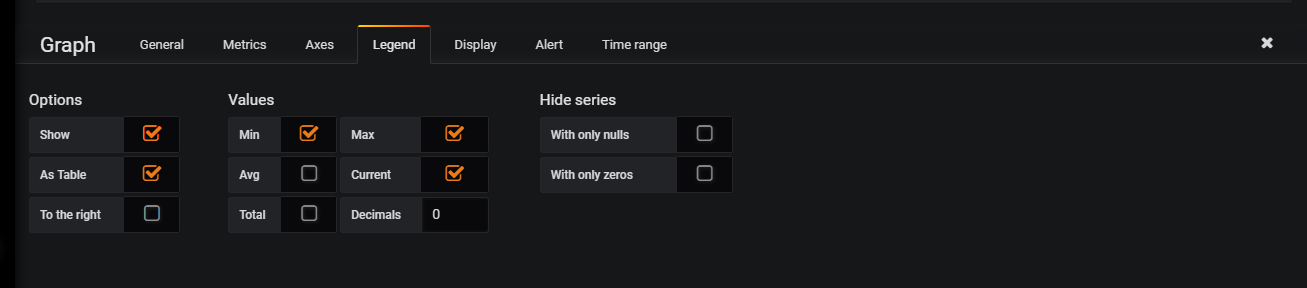
The graph should be presented as lines, bars, or points and can be configured from the "Display" tab. You can also control the width and staircase options from here.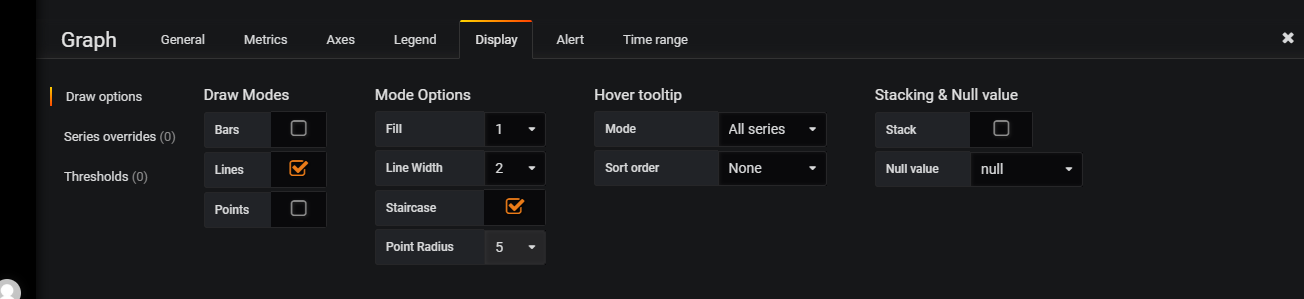
The Alerts Tab needs separate attention. For the sake of simplicity, we are leaving this tab with default values.
Save your Graph by pressing "CTRL+S." The Grafana server will ask for the name of the dashboard when you save your panels (graphs) for the first time. I am using "MySQL Server Dash Board" as the name of our dashboard. Also, whenever you close the edit tabs, it will ask you to save or discard changes. Provide comments on the change if asked.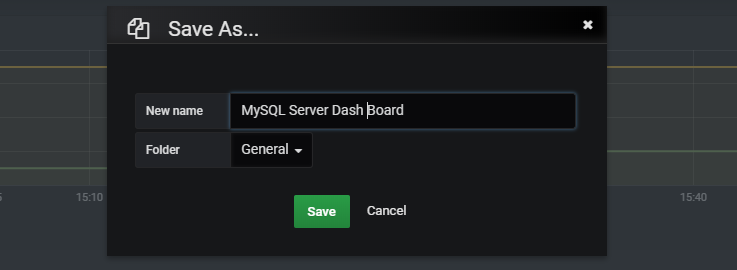
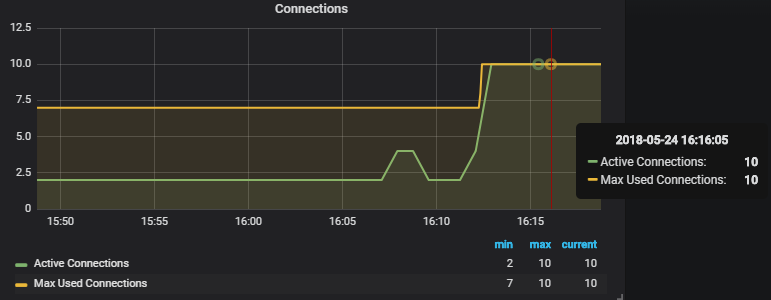
Once you save the changes and close the edit tabs, you shall be able to see the graph displaying the Active and Max connections. This will change with respect to time and the number of connections on the target MySQL server instance. 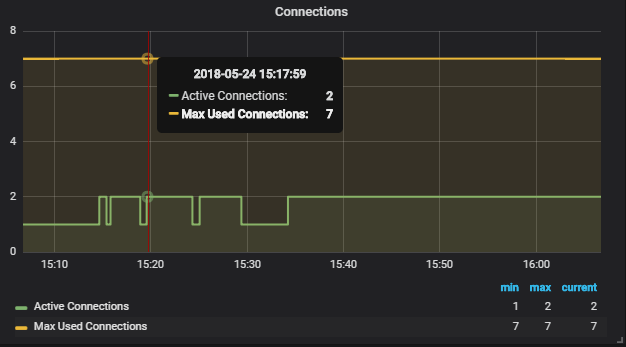
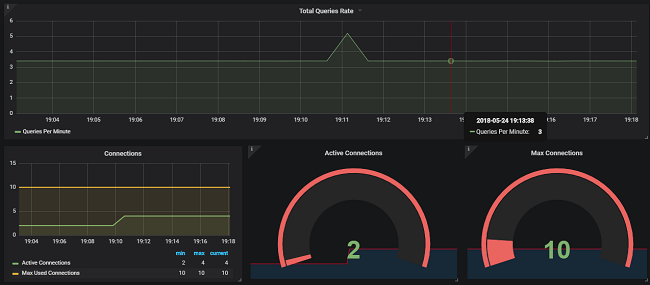
You can add multiple panels in a dashboard displaying different information. I have created a sample dashboard and have exported that panel as JSON, which you can get from this GitHub repository and can directly import by clicking on "+" on the left bar and then selecting import; this will open a pop-up where you can paste this JSON to get this panel in your setup. Or, you can get dashboards from the Grafana Dashboard Repository. Below is the screenshot of one of the dashboards I created for this tutorial.
Opinions expressed by DZone contributors are their own.
Comments