Set Up and Integrate Prometheus With Grafana for Monitoring
In this tutorial, we'll learn how to set up and configure Prometheus and Grafana to enable application performance monitoring for REST applications.
Join the DZone community and get the full member experience.
Join For FreeAs we know, Prometheus and Grafana can be used to monitor a vast range of applications. In this article, we will learn how to set up Prometheus and Grafana. We will also see how to integrate Prometheus as a data source in Grafana.
For collecting metrics, we shall be targeting the REST application we created in our previous article. This application has exposed a metrics endpoint at "http://localhost:9000/actuator/prometheus" using Spring Boot Actuator.
Note: The steps mentioned in this article are for Windows operating systems. For other environments, the steps may vary.
1. Set Up Prometheus
Download Prometheus distributions for your environment.
Extract the distribution in your selected directory in the file system.
In Prometheus, all configurations are done using configuration files, which are written in YAML format. Prometheus is distributed with a sample configuration file with the name prometheus.yml. You can use this file to configure applications to be monitored or you can create new files. I have created a new file named person-app.yml with the below content:
#Global configurations
global:
  scrape_interval:     5s # Set the scrape interval to every 5 seconds.
  evaluation_interval: 5s # Evaluate rules every 5 seconds.

scrape_configs:
  - job_name: 'person-app'
    metrics_path: '/actuator/prometheus'
    static_configs:
      - targets: ['localhost:9000']
Start the Prometheus server by using the command perometheus.exe --config.file=YAML_FILE_PATH. 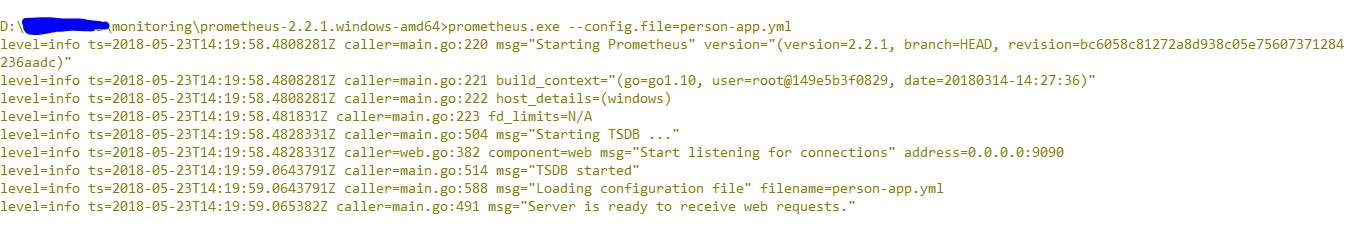
Test the server by browsing to the URL http://localhost:9090/. If you are able to see the page below, then you have the Prometheus server running and scraping the metrics for you, which is based on the configuration you made using person-app.yml while starting the server.
2. Set Up Grafana
Download the Grafana distribution for your environment.
Extract the distribution to your file system.
In Grafana, all the configurations are made using ".ini" files, which are placed in the "conf" directory. Grafana is distributed with "defaults.ini" and "sample.ini." You can change/override the configurations (port, security, etc) using this file. For the sake of simplicity, let us proceed with the default settings, which will configure "admin/admin" as the username and password.
Caution: Do not rename the existing or new configuration file as "defaults.ini" unless you are very sure of what properties you are changing and what effects it may have on the server.
The executable to start the server is placed in the "bin" directory of the Grafana distribution. Start the server by executing grafana-server.exe from the bin directory of the distribution.
Log in to Grafana by browsing to http://localhost:3000. The username and password are "admin/admin" (remember that we used the defaults). You can change this anytime using the .ini file we discussed in an earlier step.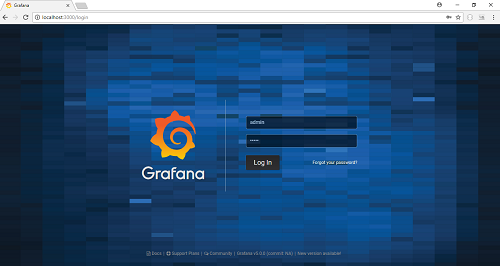
3. Add Prometheus as a Data Source in Grafana
Grafana allows you to query, visualize, and alert your metrics from about 30+ open source and commercial data sources. In the next steps, we shall be describing how to add Prometheus as a data source in Grafana.
- Log into Grafana with the username and password configured (the default is admin/admin).
- Click the gear icon in the left sidebar and from the menu select "Data Sources." This will list all the configured data sources (if you have configured any).
- Click on "Add Data Source." This will open a page to add a data source.
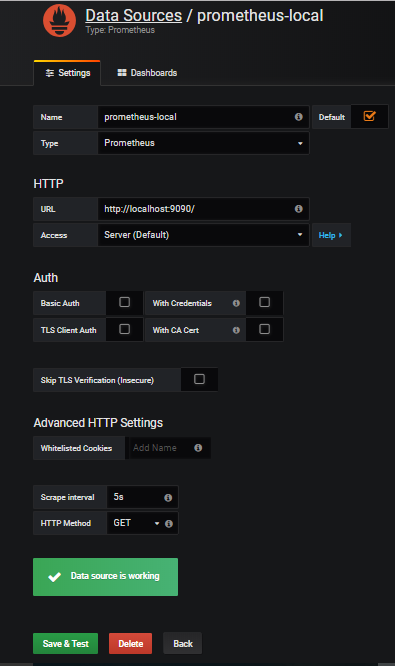
- Give a suitable name to this new data source, as this will be used while creating visualizations. I am using "prometheus-local."
- Select Prometheus in the "type" drop down.
- The URL shall be "http://localhost:9090" as we have Prometheus running on local host on port 9090.
- Fill other details if you have any security or HTTP related settings.
- Click "Save & Test."
- If Grafana is able to make connections to Prometheus instance with the details provided, then you will get a message saying "Data source is working." If you get any errors, review your values.
![Image title]()
In this article, we have seen how to set up and integrate Prometheus and Grafana. In the next article, we shall be creating a visualization in Grafana that will display the hit count of the API exposed in our REST application.
You can get the person-app.yml file and the application we used for the Prometheus setup from this GitHub repository.
Opinions expressed by DZone contributors are their own.
Comments