Grafana Loki Fundamentals and Architecture
Grafana Loki is a scalable, cost-efficient log system for cloud-native environments. It uses minimal indexing, compressed storage, and LogQL for fast queries.
Join the DZone community and get the full member experience.
Join For FreeGrafana Loki is a horizontally scalable, highly available log aggregation system. It is designed for simplicity and cost-efficiency. Created by Grafana Labs in 2018, Loki has rapidly emerged as a compelling alternative to traditional logging systems, particularly for cloud-native and Kubernetes environments.
Loki can provide a comprehensive log journey. We can select the right log streams and then filter to focus on the relevant logs. We can then parse structured log data to be formatted for our customized analysis needs. Logs can also be transformed appropriately for presentation, for example, or further pipeline processing.
Loki integrates seamlessly with the broader Grafana ecosystem. Users can query logs using LogQL — a query language intentionally designed to resemble Prometheus PromQL. This provides a familiar experience for users already working with Prometheus metrics and enables a powerful correlation between metrics and logs within Grafana dashboards.
This article starts with Loki fundamentals, followed by a basic architectural overview. LogQL basics follow, and we conclude with the trade-offs involved.
Loki Fundamentals
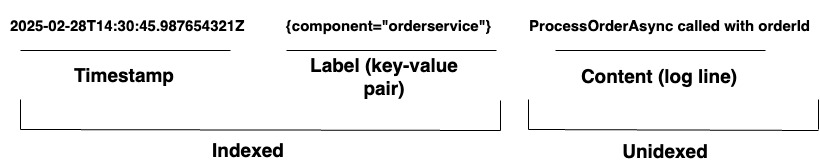
For organizations managing complex systems, Loki provides a unified logging solution. It supports log ingestion from any source through a wide array of agents or its API, ensuring comprehensive coverage of diverse hardware and software. Loki stores its logs as log streams, as shown in Diagram 1. Each entry has the following:
- A timestamp with nanosecond precision
- Key-value pairs called labels are used to search for logs. Labels provide the metadata for the log line. They are used for the identification and retrieval of data. They form the index for the log streams and structure the log storage. Each unique combination of labels and their values defines a distinct log stream. Log entries within a stream are grouped, compressed, and stored in segments.
- The actual log content. This is the raw log line. It is not indexed and is stored in compressed chunks.
Architecture
We will analyse Loki's architecture based on three basic features. Reading, writing, and storing logs. Loki can operate in monolithic (single-binary) or microservices mode, where components are separated for independent scaling. Read and write functionality can be scaled independently to suit specific use cases. Let's consider each path in more detail.
Writing
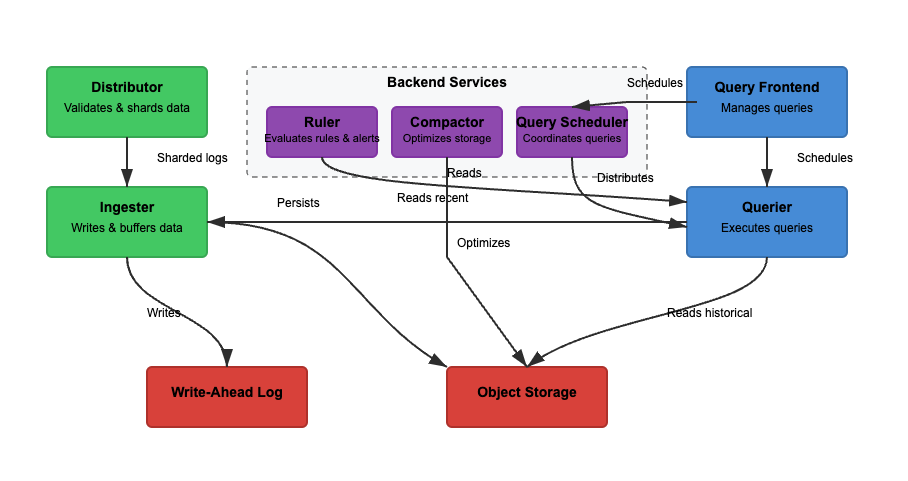
In Diagram 2, the write path is the green path. As logs enter Loki, the distributor shards logs based on labels. The ingester then stores logs in memory, and the compactor optimizes storage. The main steps involved are the following.
Step 1: Logs Enter Loki
Writes for the incoming logs arrive at the distributor. Logs are structured as streams, with labels (like {job="nginx", level="error"}). The distributor shards logs, partitions logs, and sends logs to the ingesters. It hashes each stream’s labels and assigns it to an ingester using consistent hashing. Distributors validate logs and prevent malformed data. Consistent hashing can ensure even log distribution across ingesters.
Step 2: Short-Term Storage
The ingester stores logs in memory for quick retrieval. Logs are batched and written to Write-Ahead Logs (WAL) to prevent data loss. WAL helps with durability but is not queryable directly — ingesters still need to stay online for querying recent logs.
Periodically, logs are flushed from ingesters to object storage. The querier and ruler read the ingester to access the most recent data. The querier can additionally access the object storage data.
Step 3: Logs Move to Long-Term Storage
The compactor periodically processes stored logs from long-term storage (object-storage). Object storage is cheap and scalable. It allows Loki to store massive amounts of logs without high costs. The compactor deduplicates redundant logs, compresses logs for storage efficiency, and deletes old logs based on retention settings. Logs are stored in chunked format (not full-text indexed).
Reading
In Diagram 2, the read path is the blue path. Queries go to the query frontend, and the querier retrieves logs. Logs are filtered, parsed, and analyzed using LogQL. The main steps involved are the following.
Step 1: Query Frontend Optimizes Requests
Users query logs using LogQL in Grafana. The query frontend breaks large queries into smaller chunks and distributes them across multiple queriers since parallel execution speeds up queries. It is responsible for accelerating query execution and ensuring retries in the event of failure. Query frontend helps avoid timeouts and overloads, while failed queries are retried automatically.
Step 2: Querier Fetches Logs
Queriers parse the LogQL and query ingesters and object storage. Recent logs are fetched from ingesters, and older logs are retrieved from object storage. Logs with the same timestamp, labels, and content are de-duplicated.
Bloom filters and index labels are used to find logs efficiently. Aggregation queries, like count_over_time() run faster because Loki doesn’t fully index logs. Unlike Elasticsearch, Loki does not index full log content.
Instead, it indexes metadata labels ({app="nginx", level="error"}), which helps find logs efficiently and cheaply. Full-text searches are performed only on relevant log chunks, reducing storage costs.
LogQL Basics
LogQL is the query language used in Grafana Loki to search, filter, and transform logs efficiently. It consists of two primary components:
- Stream selector – Selects log streams based on label matchers
- Filtering and transformation – Extracts relevant log lines, parses structured data, and formats query results
By combining these features, LogQL allows users to efficiently retrieve logs, extract insights, and generate useful metrics from log data.
Stream Selector
A stream selector is the first step in every LogQL query. It selects log streams based on label matchers. To refine query results to specific log streams, we can employ basic operators to filter by Loki labels. Enhancing the precision of our log stream selection minimizes the volume of streams scanned, thereby boosting query speed.
Examples
{app="nginx"}             # Selects logs where app="nginx"

{env=~"prod|staging"}     # Selects logs from prod or staging environments

{job!="backend"}          # Excludes logs from the backend job
Line Filters
Once logs are selected, line filters refine results by searching for specific text or applying logical conditions. Line filters work on the log content, not labels.
Examples
{app="nginx"} |= "error"       # Select logs from nginx that contain "error"

{app="db"} != "timeout"        # Exclude logs with "timeout"

{job="frontend"} |~ "5\d{2}"   # Match HTTP 500-series errors (500-599)
Parsers
Loki can accept unstructured, semi-structured, or structured logs. However, understanding the log formats that we are working with is crucial when designing and building observability solutions. This way, we can ingest, store, and parse log data to be used effectively. Loki supports JSON, logfmt, pattern, regexp, and unpack parsers.
Examples
{app="payments"} | json                     # Extracts JSON fields

{app="auth"} | logfmt                       # Extracts key-value pairs

{app="nginx"} | regexp "(?P<status>\d{3})"  # Extracts HTTP status codes
Label Filters
Once parsed, logs can be filtered by extracted fields. Labels can be extracted as part of the log pipeline using parser and formatter expressions. The label filter expression can then be used to filter our log line with either of these labels.
Examples
{app="web"} | json | status="500"   # Extract JSON, then filter by status=500

{app="db"} | logfmt | user="admin"  # Extract key-value logs, filter by user=admin
Line Format
Used to modify log output by extracting and formatting fields. This formats how logs are displayed in Grafana.
Example
{app="nginx"} | json | line_format "User {user} encountered {status} error"Label Format
Used to rename, modify, create, or drop labels. It accepts a comma-separated list of equality operations, allowing multiple operations to be carried out simultaneously.
Examples
1. {app="nginx"} | label_format new_label=old_label.    #If a log has {old_label="backend"}, it is renamed to {new_label="backend"}. The original old_label is removed.

2. {app="web"} | label_format status="HTTP {{.status}}" #If {status="500"}, it becomes {status="HTTP 500"}.

3. {app="db"} | label_format severity="critical".       #Adds {severity="critical"} to all logs.

4. {app="api"} | drop log_level                         # Drops log_level
Trade-Offs
Grafana Loki offers a cost-efficient, scalable logging solution that stores logs in compressed chunks with minimal indexing. This comes with trade-offs in query performance and retrieval speed. Unlike traditional log management systems that index full log content, Loki’s label-based indexing speeds up filtering.
However, it may slow down complex text searches. Additionally, while Loki excels at handling high-throughput, distributed environments, it relies on object storage for scalability. This can introduce latency and requires careful label selection to avoid high cardinality issues.
Scalability and Multi-tenancy
Loki is designed for scalability and multi-tenancy. However, scalability comes with architectural trade-offs. Scaling writes (ingesters) is straightforward due to the ability to shard logs based on label-based partitioning. Scaling reads (queriers) is trickier because querying large datasets from object storage can be slow. Multi-tenancy is supported, but managing tenant-specific quotas, label explosion, and security (per-tenant data isolation) requires careful configuration.
Simple Ingestion With No Pre-Parsing
Loki does not require pre-parsing because it doesn’t index full log content. It stores logs in raw format in compressed chunks. Since Loki lacks full-text indexing, querying structured logs (e.g., JSON) requires LogQL parsing. This means that querying performance depends on how well logs are structured before ingestion. Without structured logs, query efficiency suffers because filtering must happen at retrieval time, not ingestion.
Storing in Object Store
Loki flushes log chunks to object storage (e.g., S3, GCS, Azure Blob). This reduces dependency on expensive block storage like, for example, Elasticsearch requires.
However, reading logs from object storage can be slow compared to querying directly from a database. Loki compensates for this by keeping recent logs in ingesters for faster retrieval. Compaction reduces storage overhead, but log retrieval latency can still be an issue for large-scale queries.
Labels and Cardinality
Since labels are used to search for logs, they are critical for efficient queries. Poor labeling can lead to high cardinality issues. Using high-cardinality labels (e.g., user_id, session_id) increases memory usage and slows down queries. Loki hashes labels to distribute logs across ingesters, so bad label design can cause uneven log distribution.
Filtering Early
Since Loki stores compressed raw logs in object storage, it is important to filter early if we want our queries to be fast. Processing complex parsing on smaller datasets will increase the response time. According to this rule, a good query would be Query 1, and a bad query would be Query 2.
Query 1
{job="nginx", status_code=~"5.."} | jsonQuery 1 filters logs where job="nginx" and the status_code starts with 5 (500–599 errors). Then, it extracts structured JSON fields using | json. This minimizes the number of logs processed by the JSON parser, making it faster.
Query 2
{job="nginx"} | json | status_code=~"5.."Query 2 first retrieves all logs from nginx. This could be millions of entries. It then parses JSON for every single log entry before filtering by status_code. This is inefficient and significantly slower.
Wrapping Up
Grafana Loki is a powerful, cost-efficient log aggregation system designed for scalability and simplicity. By indexing only metadata, it keeps storage costs low while enabling fast queries using LogQL.
Its microservices architecture supports flexible deployments, making it ideal for cloud-native environments. This article addressed the basics of Loki and its query language. By navigating through the salient features of Loki's architecture, we can get a better understanding of the trade-offs involved.
Opinions expressed by DZone contributors are their own.
Comments