How to Install Grafana Loki Stack Using AWS S3 Bucket
Most organizations that utilize DevOps principles and tools require a logging system to cover the shortcomings of Prometheus.
Join the DZone community and get the full member experience.
Join For FreeFor any production environment, having a proper logging and monitoring system is vital. This is down to the fact that downtime can lead to unwanted bottlenecks in such an environment and even loss of business reputation and revenue. As a result, most organizations that utilize DevOps principles and tools require a logging system to cover the shortcomings of Prometheus, which is an efficient production system monitoring tool but lacks logging capabilities.
Grafana Loki is one of the tools that help companies maintain a centralized logging system. The importance of having a centralized logging system in a production environment is that it allows you to address issues such as downtime and identify potential issues that need resolution. Loki started at Grafana Labs in 2018 and was announced at the KubeCon in Seattle in December 2018. In June 2019, the first beta version 0.1.0 was released.
What Is Grafana Loki?
Loki is a multi-tenant log aggregation system inspired by Prometheus. It is designed to be very cost-effective and easy to operate. Log data is compressed and stored in chunks in object stores such as AWS S3 and GCS or can be even saved locally on a file system.
Is Grafana Loki Free?
Loki is an open-source project aimed at helping DevOps professionals install and run Grafana without much hassle. While Grafana has a pricing plan for hosting/storing your log data, Loki isn’t affected by this pricing plan. As such, it remains a free-to-use tool.
Advantages of Using Grafana Loki
Some key benefits of using Grafana Loki versus competitors such as Graylog and Datadog, to name a few, are:
- Lightweight: By storing compressed, unstructured logs and only indexing metadata, Loki is simpler to operate and cheaper to run.
- Object storage: Loki can be set up with Amazon S3 or GCS, which tends to be cheaper than block storage. The link below will show you the different ways to store the index and chunks:
https://grafana.com/docs/loki/latest/operations/storage/ - Multi-tenancy support: It's supported through a tenant ID so that the tenant's data is stored separately.
https://grafana.com/docs/loki/latest/overview/#multi-tenancy - Native Grafana support: from Grafana 6.0, you can review metrics and logs all in one place.
How to Install Grafana Loki Stack
Our focus in this article is Loki Stack, which consists of three main components:
- Grafana for querying and displaying the logs.
- Loki is the main server responsible for storing the logs and processing queries.
- Promtail is the agent responsible for gathering logs and pushing them to Loki.

We will be using minikube and Flux version 2 to deploy Loki Stack with a Helm chart. By default, Loki will store the chunks on the file system that shares the pod's lifetime. We will change that and use an AWS S3 Bucket to store this kind of data.
You can use Fluentbit instead of Promtail if you want to, but we have noticed that Promtail is well-set out of the box and can discover all labels on your Kubernetes Cluster.
Access to the repo used for this post can be found with the link below:
https://github.com/bluelightco/blog-loki
Launching Grafana Loki Stack
Deploy with a Helm chart.
More information about the Helm chart used can be found with the link below:
https://github.com/grafana/helm-charts/tree/main/charts/loki-stack
https://github.com/grafana/helm-charts/blob/main/charts/loki-stack/values.yaml
Below is the Helm values.yaml file that we will be using:
values:loki:env:- name: AWS_ACCESS_KEY_IDvalueFrom:secretKeyRef:name: iam-loki-s3key: AWS_ACCESS_KEY_ID- name: AWS_SECRET_ACCESS_KEYvalueFrom:secretKeyRef:name: iam-loki-s3key: AWS_SECRET_ACCESS_KEYconfig:schema_config:configs:- from: 2021-05-12store: boltdb-shipperobject_store: s3schema: v11index:prefix: loki_index_period: 24hstorage_config:aws:s3: s3://us-west-2/bluelightco-lokis3forcepathstyle: truebucketnames: bluelightco-lokiregion: us-west-2insecure: falsesse_encryption: falseboltdb_shipper:shared_store: s3cache_ttl: 24hgrafana:enabled: truesidecar:datasources:enabled: trueimage:tag: latestgrafana.ini:users:default_theme: light
Since we will be using an AWS S3 Bucket to store our compressed log data in chunks, we created an IAM user with write and read permission to our S3 Bucket. A secret will need to be created so Loki can use those credentials mentioned in the Helm values above.
Run the following command with your own IAM credentials:
kubectl create secret generic iam-loki-s3 --from-literal=AWS_ACCESS_KEY_ID='ABC123456' --from-literal=AWS_SECRET_ACCESS_KEY='ABC123456' -n default
How to Access the Grafana Web UI
To access Grafana web UI, you will have to run the following command:
kubectl port-forward svc/loki-grafana -n default 8080:80
Browse the following URL: http://localhost:8080/
Log in with the username admin.
To retrieve the password, run:
kubectl get secret --namespace default loki-grafana -o jsonpath="{.data.admin-password}" | base64 --decode ; echo
Handling Queries With Grafana Loki
Now that you are logged in to Grafana, Loki has been automatically added as a data source thanks to the Helm chart Loki-Stack, making it easy to use Loki right away.
On the Grafana web UI, select "Explore" from the side panel.

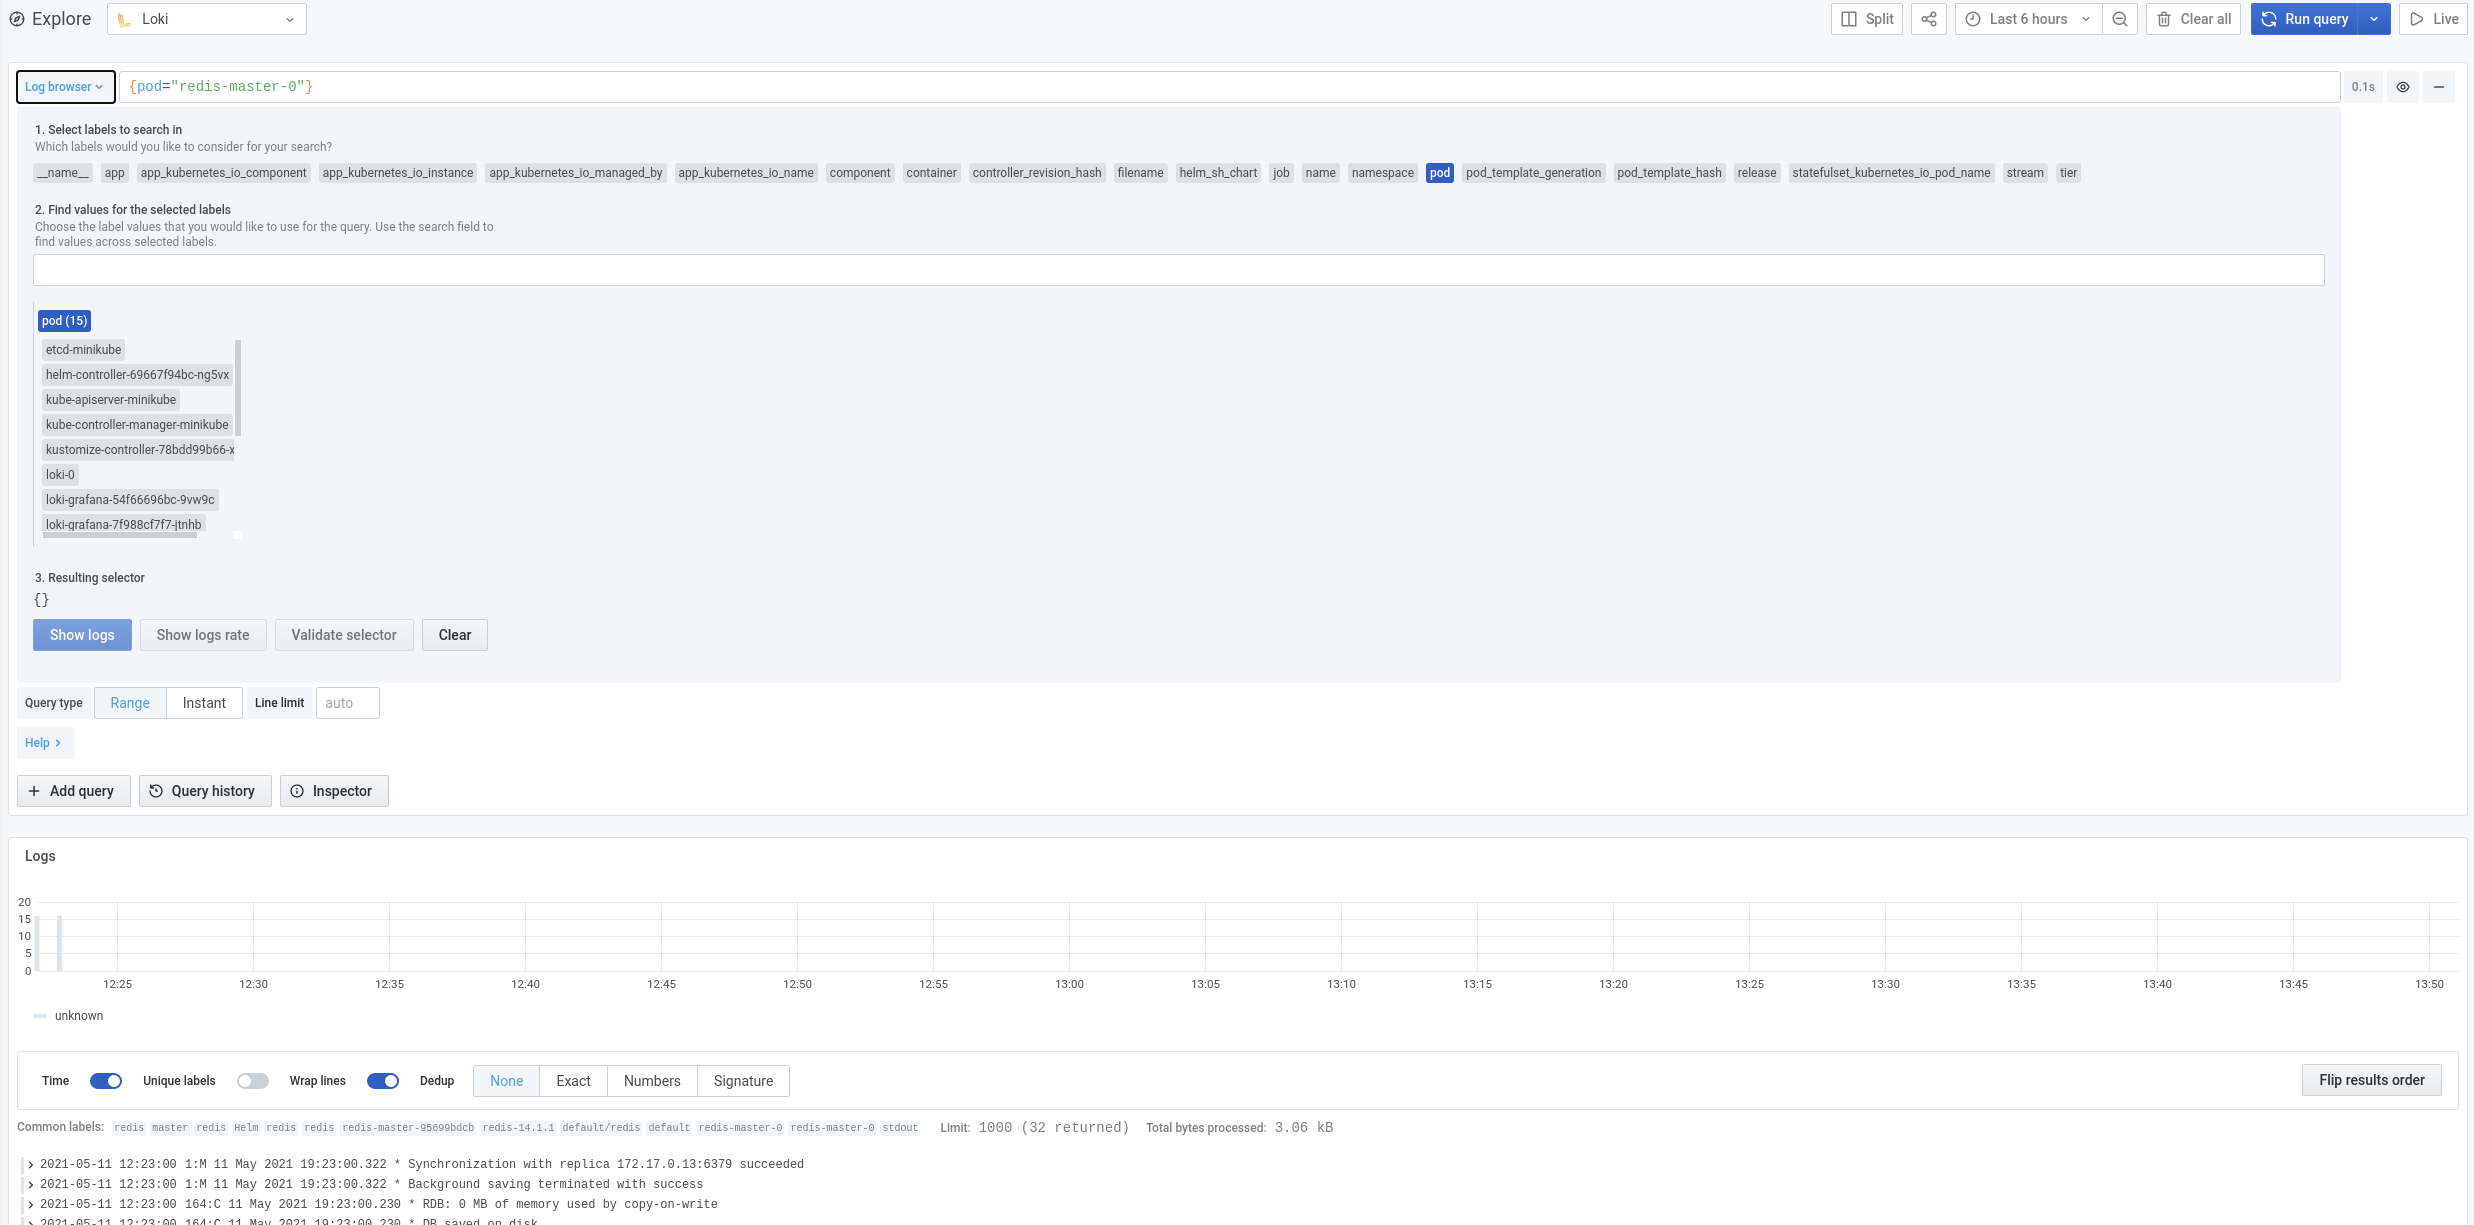
You will be welcomed with the following Log Browser. Instead of manually writing your own query, you can use this menu to help you to build it.

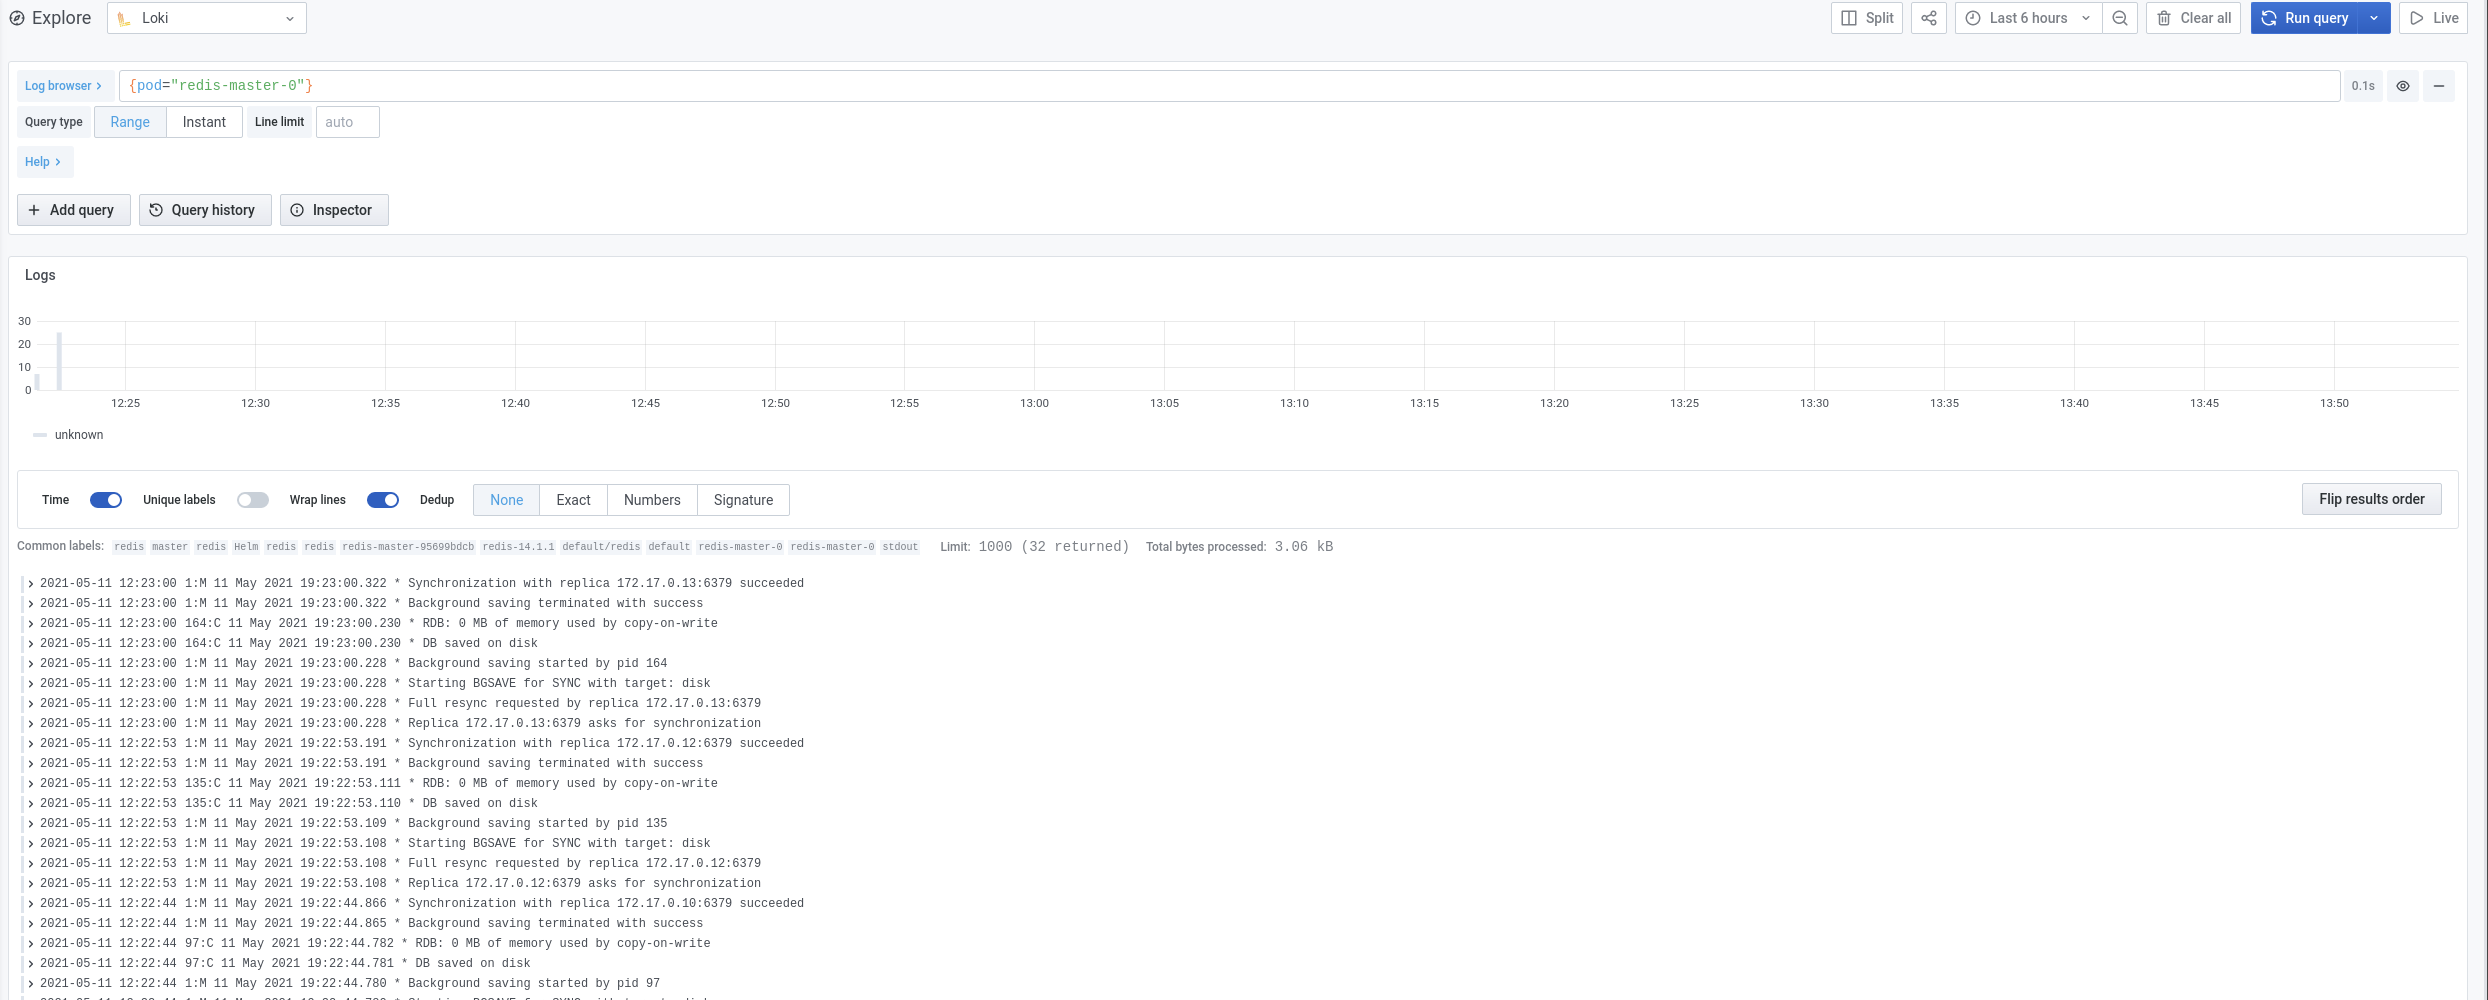
Let's take a look at the logs for the redis-master-0 pod, click on pod, and select redis-master-0:

 If you are hoping to run some advanced queries, we highly suggest looking at the Log Query Language (LogQL) documentation provided by Grafana here.
Conclusion
Most businesses want a simple and cost-effective solution, and Loki provides all of that into a solution that collects, stores, and analyzes log files from apps and services. It gives you a new approach to central log management. The simplicity of setting it up and integrating with Grafana allows you to monitor metrics and logs all in one place, making it a solid choice.
Published at DZone with permission of Chase Bolt. See the original article here.
Opinions expressed by DZone contributors are their own.
Comments