Prometheus AWS Exporter and Grafana
The main purpose of this article and use case is to scrape AWS cloud watch metrics into the Prometheus time series and to visualize the metrics data in Grafana.
Join the DZone community and get the full member experience.
Join For FreeThe main purpose of this article and use case is to scrape AWS CloudWatch metrics into the Prometheus time series and to visualize the metrics data in Grafana. Prometheus and Grafana are the most powerful, robust open-source tools for monitoring, collecting, visualizing, and performance metrics of the deployed applications in production. These tools give greater visibility other than collecting the metrics also, where we can set up critical alerts, live views, and custom dashboards. CloudWatch Exporter is an open-source tool to capture metrics as defined in yml configuration file.
Architecture
 The CloudWatch Exporter will collect the metrics from AWS Cloud watch every 15 seconds (default), and it will expose them as key/value pairs in /the metrics API response. Using that configuration, the exporter will collect those metrics from CloudWatch every 15 seconds (default) and expose them as key-value pairs in the '/metrics' API response. The CloudWatchExporter's /metrics endpoint should then be added to the Prometheus configuration as a scrape job. Prometheus allows us to define the scraping frequency, so we can adjust the frequency of calls to CloudWatch to eventually tune the cost.
Setup Instructions
AWS Access Setup
- Set up a new user under IamUser. Assign CloudWatchReadOnly permissions to that user.
- Generate a key and secret access key for that user. Guard the secret with your life as you cannot see it ever again! Save it safe, where you can find it.
Grafana Setup
- Install Grafana mac: brew install Grafana
- Start Grafana: brew services start Grafana
- Access Grafana
- Add Prometheus as a data source

AWS Cloud Watch Exporter
How to run a CloudWatch exporter locally:
Establish an AWS session for the exporter. Passing in the key and access can be done more elegantly.
$ aws configure AWS Access Key ID [********************]: enter_your_access_key_here AWS Secret Access Key [********************]: enter_your_secret_key_hereDefault region name [eu-west-1]:
Default output format [None]:
Running the Exporter:
Local Path to AWS Exporter:
cd /Users/jayam000/cw/prometheus-2.36.1.linux-amd64/cloudwatchexporters
Run the exporter: java -jar cloudwatch_exporter-0.6.0-jar-with-dependencies.jar 1234 cloudwatchmonconfig.yml
Sample yml file to capture the request counts on AWS. The original file used can be found as an attachment.
---
region: eu-west-1
metrics:
- aws_namespace: AWS/ELB
  aws_metric_name: HealthyHostCount
  aws_dimensions: [AvailabilityZone, LoadBalancerName]
  aws_statistics: [Average]

- aws_namespace: AWS/ELB
  aws_metric_name: UnHealthyHostCount
  aws_dimensions: [AvailabilityZone, LoadBalancerName]
  aws_statistics: [Average]

- aws_namespace: AWS/ELB
  aws_metric_name: RequestCount
  aws_dimensions: [AvailabilityZone, LoadBalancerName]
  aws_statistics: [Sum]

- aws_namespace: AWS/ELB
  aws_metric_name: Latency
  aws_dimensions: [AvailabilityZone, LoadBalancerName]
  aws_statistics: [Average]

- aws_namespace: AWS/ELB
  aws_metric_name: SurgeQueueLength
  aws_dimensions: [AvailabilityZone, LoadBalancerName]
  aws_statistics: [Maximum, Sum]

- aws_namespace: AWS/ElastiCache
  aws_metric_name: CPUUtilization
  aws_dimensions: [CacheClusterId]
  aws_statistics: [Average]

- aws_namespace: AWS/ElastiCache
  aws_metric_name: NetworkBytesIn
  aws_dimensions: [CacheClusterId]
  aws_statistics: [Average]

- aws_namespace: AWS/ElastiCache
  aws_metric_name: NetworkBytesOut
  aws_dimensions: [CacheClusterId]
  aws_statistics: [Average]

- aws_namespace: AWS/ElastiCache
  aws_metric_name: FreeableMemory
  aws_dimensions: [CacheClusterId]
  aws_statistics: [Average]
Success! You should now be able to access the CloudWatch metrics here.

Prometheus (Using Docker)
Command to run Prometheus via docker:
docker run -p 9090:9090 -v /Users/jayam000/cw/prometheus-2.36.1.linux-amd64/prometheus.yml:/etc/prometheus/prometheus.yml prom/prometheus
Setup instructions to add AWS cloud watch metrics scrape config into Prometheus:
Edit prometheus.yml to include the below configuration:
- job_name: "cloudwatch"
static_configs:
- targets: ["host.docker.internal:1234"]
Prometheus scrape configuration file.
# my global config
global:
  scrape_interval: 15s # Set the scrape interval to every 15 seconds. Default is every 1 minute.
  evaluation_interval: 15s # Evaluate rules every 15 seconds. The default is every 1 minute.
  # scrape_timeout is set to the global default (10s).

# Alertmanager configuration
alerting:
  alertmanagers:
    - static_configs:
        - targets:
          # - alertmanager:9093

# Load rules once and periodically evaluate them according to the global 'evaluation_interval'.
rule_files:
  # - "first_rules.yml"
  # - "second_rules.yml"

# A scrape configuration containing exactly one endpoint to scrape:
# Here it's Prometheus itself.
scrape_configs:
  # The job name is added as a label `job=<job_name>` to any timeseries scraped from this config.
  - job_name: "prometheus"
    # metrics_path defaults to '/metrics'
    # scheme defaults to 'http'.
    static_configs:
      - targets: ["localhost:9090"]
  - job_name: "cloudwatch"
    static_configs:
      - targets: ["host.docker.internal:1234"]
#    scrape_interval: 3m
#    #scrape_timeout: 30s
Note: Had to change from localhost:1234 to host.docker.internal:1234 due to a bizarre connectivity issue. After the change, started seeing Prometheus collect metrics.
Default scrape interval: 15 secs.
Access Prometheus here.
Click on Graph and select a specific parameter to view the time series corresponding to that attribute.
Click on Status/Targets to check the health of the data sources added.

Screenshot of Prometheus showing the configured targets, in this case, cloud watch exporter

Prometheus graph showing the number of cloud watch requests. This data is similar to the data displayed in the Grafana dashboard.
Grafana Dashboard
Grafana dashboard of cloud watch metrics from Prometheus.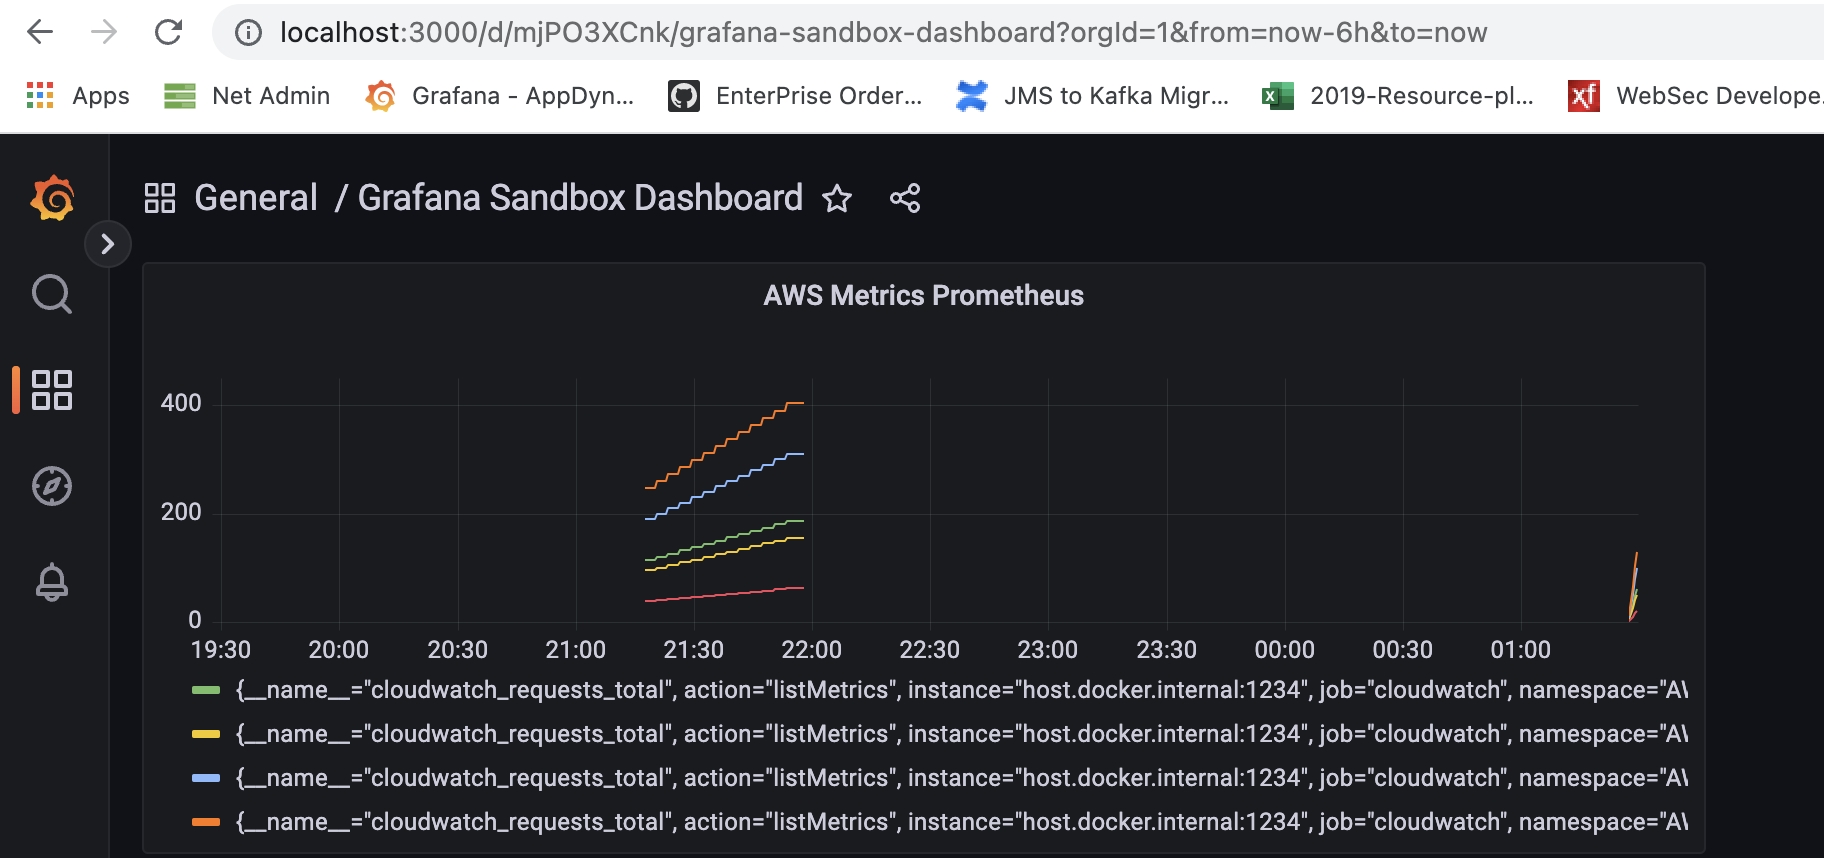
Conclusion
The given sample version extracts availability metrics from AWS. It does not extract application metrics or logs. This given sample did not require any custom code to be built. Adding new data source into Prometheus required yml config update and service restart. Incorporating new metrics into cloud watch.
Feel free to reach out should you have any questions around the setup, and we would be happy to assist you.
Opinions expressed by DZone contributors are their own.
Comments