What is Prometheus and Why Should You Use It?
Prometheus can collect metrics about your application and infrastructure. Learn about Prometheus and why you should use it!
Join the DZone community and get the full member experience.
Join For FreePrometheus is one of many open-source projects managed by the Cloud Native Computing Foundation (CNCF). It is monitoring software that integrates with a wide range of systems natively or through the use of plugins. It is considered the default monitoring solution for the popular Kubernetes container orchestration engine, another CNCF hosted project.
Prometheus can collect metrics about your application and infrastructure. Metrics are small concise descriptions of an event: date, time, and a descriptive value. While prometheus does store or ‘log’ metrics, metrics should not be confused with logs, which can include reams of data. Rather than gathering a great deal of data about one thing, Prometheus uses the approach of gathering a little bit of data about many things to help you understand the state and trajectory of your system. It has become very popular in the industry because it has many powerful features for monitoring metrics and providing alerts that can, with orchestration systems (e.g. Kubernetes), automate responses to changing conditions.
Prometheus Architecture
It is useful to have an understanding of the pieces that make up Prometheus prior to talking about how it works.
The Prometheus is a multi-component system. While the following integrate into a Prometheus deployment, there is flexibility in which of these pieces are actually implemented.
- Prometheus server (scrapes and stores metrics as time series data)
- client libraries for instrumenting application code
- push gateway (supports metrics collection from short-lived jobs)
- special-purpose exporters (Supports tools like HAProxy, StatsD, Graphite, etc.)
- alertmanager ( sends alerts based on triggers)
- additional support tools
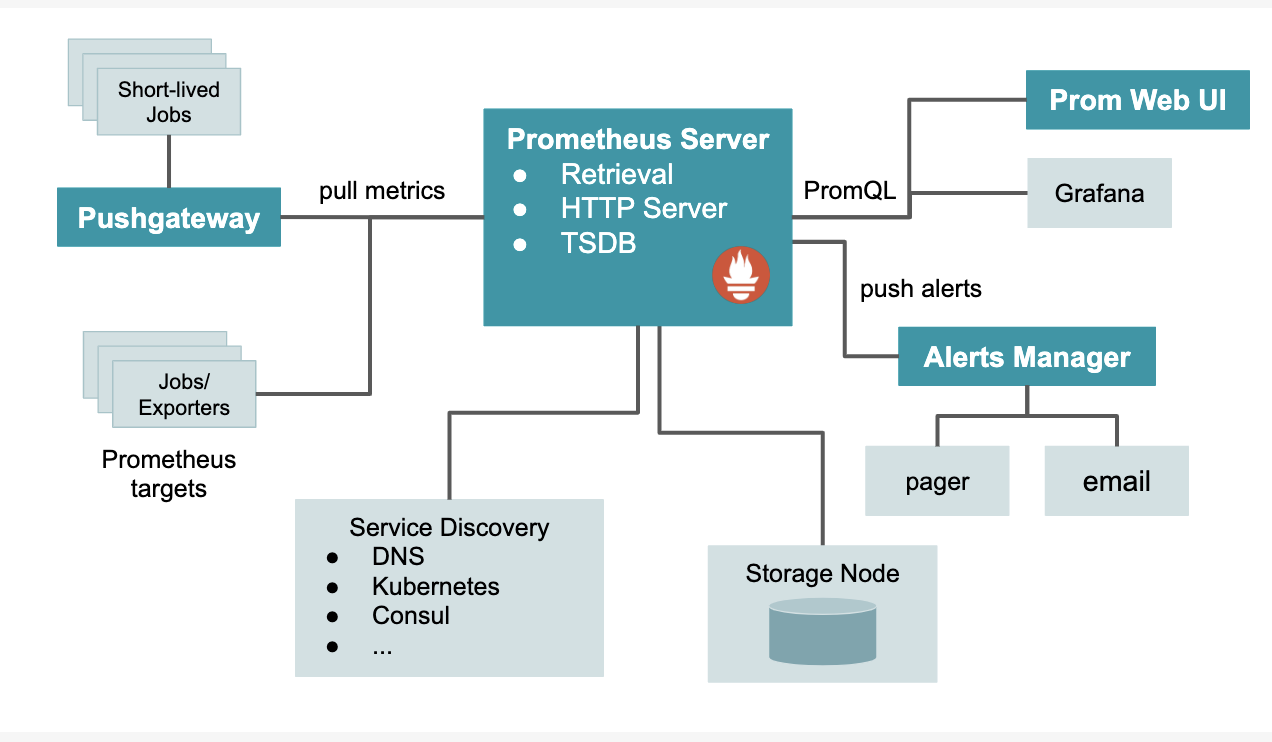
Prometheus can scrape metrics from jobs directly or, for short-lived jobs by using a push gateway when the job exits. The scraped samples are stored locally and rules are applied to the data to aggregate and generate new time series from existing data or generate alerts based on user-defined triggers. While Prometheus comes with a functional Web dashboard or other API consumers can be used to visualize the collected data, with Grafana being the de facto default.
How Prometheus Works
Prometheus gets a metric from an exposed HTTP endpoint. A number of client libraries are available to provide this application integration when building software. With an available endpoint, Prometheus can scrape numerical data and store it as a time series in a local time-series database. It can also integrate with remote storage options.
In addition to the stored time series, impermanent times series from the source are produced by queries. These series are recognized by metric name and key-value pairs known by labels. Queries are generated using PromQL (Prometheus Query Language) that enables users to choose and aggregate time-series data in real-time. PromQL is also used to establish alert conditions that can then transmit notifications outside sources such as PagerDuty, Slack or email. These data can be displayed in graph or tabular form in Prometheus’s Web UI. Alternatively, and commonly, API integrations with alternative display solutions such as Grafana may be used.
When is Prometheus the Correct Monitoring Solution
Prometheus’s primary focus is on reliability rather than accuracy. For this reason, it is ideal in highly dynamic systems such as microservices running in a cloud environment. It is probably not a good fit for a system that requires high accuracy, such as a billing application. In this case, the specific billing function should be addressed with an alternative, but Prometheus may still be the right tool for monitoring the other application and infrastructure functions.
The focus on reliability is built-in by making each Prometheus server standalone with local time series database storage to avoid reliance on any remote service. This design makes Prometheus an ideal tool to rely on for rapidly identifying issues and getting real-time feedback on system performance.
Opsani provides seamless integration with tools like Prometheus and Kubernetes to inform and automate its AI-driven performance optimization. The end results include benefits such as increased productivity, more stable applications, and more agile development processes. Contact Opsani to learn more about how our technology and products can put your metrics to work for you, automatically.
Published at DZone with permission of John Starmer. See the original article here.
Opinions expressed by DZone contributors are their own.
Comments