Monitoring Postgres on Heroku
A developer shows us how to create and monitor a simple Node.js application using Heroku and Librato, with Postgres as the database.
Join the DZone community and get the full member experience.
Join For FreeIntroduction
In the vast majority of applications, the database is the source of truth. The database stores critical business records along with irreplaceable user data. So it is imperative that developers have visibility into their databases to diagnose and remedy any potential issues before they impact the business. If they don't, developers will find unexpected bills at the end of the month that they may not understand.
In this article, you will learn how to set up a Heroku Postgres database with Librato for automated monitoring. Then we'll look at a range of different metrics that are available along with best practices for how to get the most out of each metric. With the right metrics in place you can anticipate where you will need to provision extra resources and how to keep an eye out on potential issues.
Creating Our Example Application With Heroku, Librato, and Postgres
This article assumes you already have a Heroku account. If you don't, creating a free account will be sufficient to follow along, although the metrics will not actually be available unless you have a standard account plan.
Once you have an account, log into our Heroku account and clone the Node.js Getting Started template. You can use the web interface to do all this, but we will use the CLI in this article. We will then cd into the repository and create a new Heroku application called monitoring-heroku-postgres.
xxxxxxxxxx
heroku login
git clone https://github.com/heroku/node-js-getting-started.git
cd node-js-getting-started
heroku create -a monitoring-heroku-postgres
Set the get remote for the starter project. Then, push the project to the Heroku application that we created.
xxxxxxxxxx
heroku git:remote -a monitoring-heroku-postgres
git push heroku main
After deploying the application, we will start a single instance of the application.
xxxxxxxxxx
heroku ps:scale web=1
heroku open

Now that our application is set up and deployed, we will provision our database and install the pg into our project.
xxxxxxxxxx
heroku addons:create heroku-postgresql:standard-0
npm install pg
Open index.js and include the following code to connect our application to the database:
const { Pool } = require('pg');
const pool = new Pool({
connectionString: process.env.DATABASE_URL,
ssl: {
rejectUnauthorized: false
}
});
We will create another route called /db.
xxxxxxxxxx
.get('/db', async (req, res) => {
try {
const client = await pool.connect();
const result = await client.query('SELECT * FROM test_table');
const results = { 'results': (result) ? result.rows : null};
res.render('pages/db', results );
client.release();
} catch (err) {
console.error(err);
res.send("Error " + err);
}
})
Our application is now connected to our database. Commit the changes and push them to our deployed application.
xxxxxxxxxx
git add .
git commit -m "Install PG dependency, connect database, and create db route"
git push heroku main
Right now our database is empty. To write data to the database, we will use psql.
xxxxxxxxxx
heroku pg:psql
create table test_table (id integer, name text);
insert into test_table values (1, 'hello database');
\q
heroku open db

Finally, we will add Librato to our project for automated monitoring. Librato is an add-on for collecting, understanding, and acting on real-time metrics. It automatically creates interactive visualizations so you can quickly understand what is happening with your database. You can access the Librato dashboard under the Resources tab.

heroku addons:create libratoThe Metrics
Now let's look at our new metrics and see what insights we've gained, and how we can use this new data. We'll look at several database metrics and server metrics.
Database Metrics
db_size
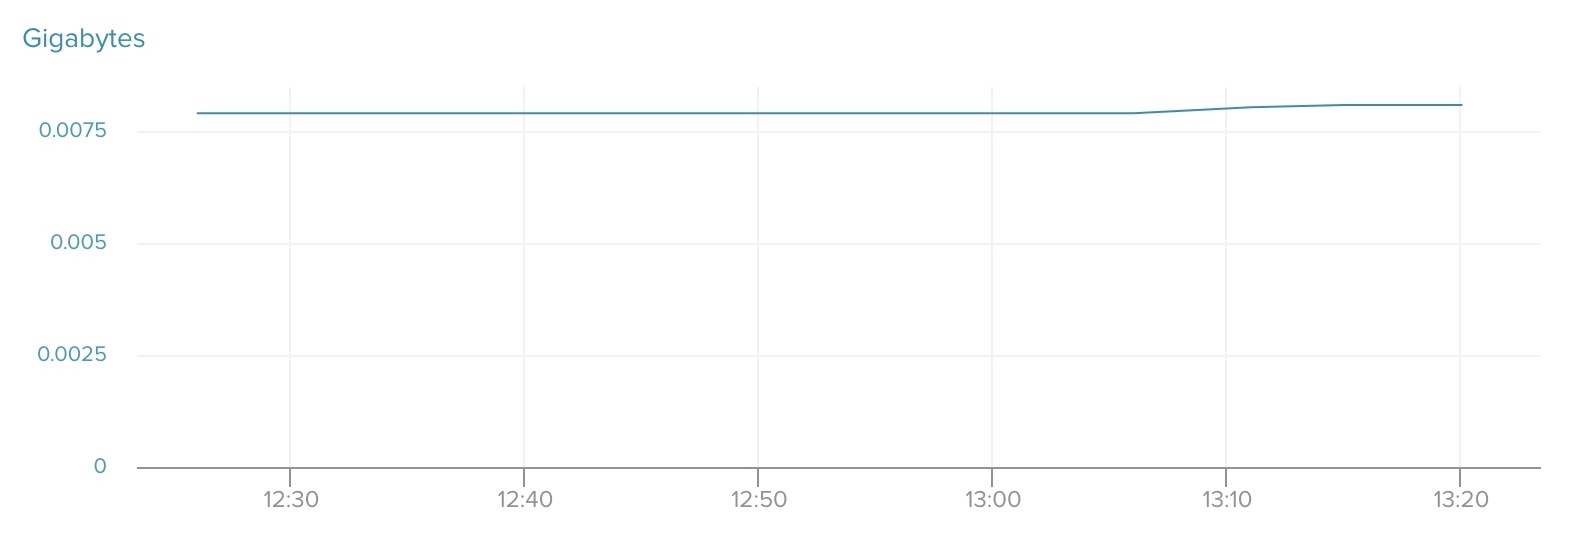
db_size tells you the number of bytes contained in the database. It includes all table and index data on disk, including database bloat.
Your database will have a certain size allotted based on your plan. If your database grows past that allotted size then you will receive a warning email with directions on how to fix the issue. You may receive an enforcement date for when you will be allowed only a single database connection. Access will be restricted to READ, DELETE, and TRUNCATE until the database is back under the plan limit.
Heroku recommends setting a warning alert when your database reaches 80% of the allotted size for your plan and a critical alert when it reaches 90% of the allotted size. As you approach maximum size you can either upgrade your plan or delete data to stay within plan limits.

active-connections
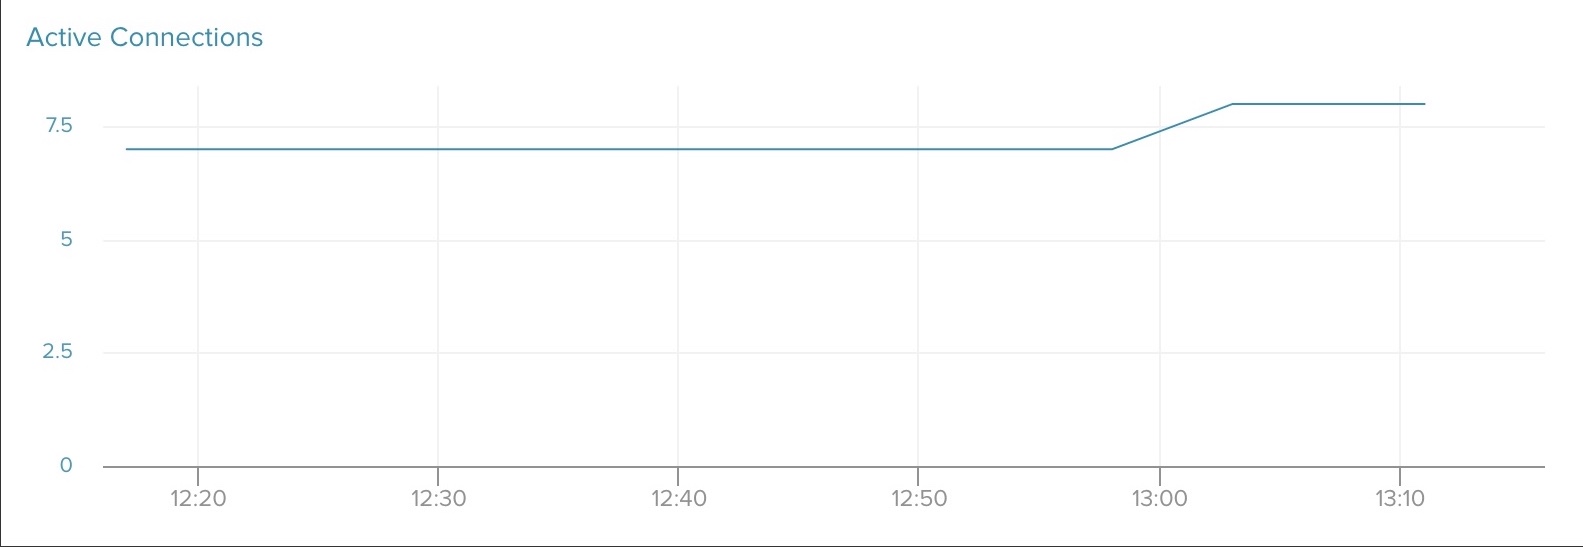
active-connections tells you the number of connections established on the database. Much like db_size, Heroku Postgres enforces a connection limit. There is a hard limit of 500 connections for plans tier-3 and higher. After reaching this limit, you will not be able to create any new connections. You can set up alerts for active-connections in two different ways:
- Sudden, large changes to the current connection count: If your baseline connection number experiences big changes it can be a sign of increased query and/or transaction run times. The alerting thresholds will depend on your application’s connection count range, assessed under normal operating conditions. +50/+100 over your normal daily maximum is a good rule of thumb.
- Connection count approaches its hard maximum:For tier-3 plans and higher, the maximum is 500 connections. As with db_size it is recommended to set alerts at 80% and 90% usage, so 400 and 450 are good numbers to start with. If you find that you are frequently approaching your connection limit, then consider using connection pooling.

index-cache-hit-rate
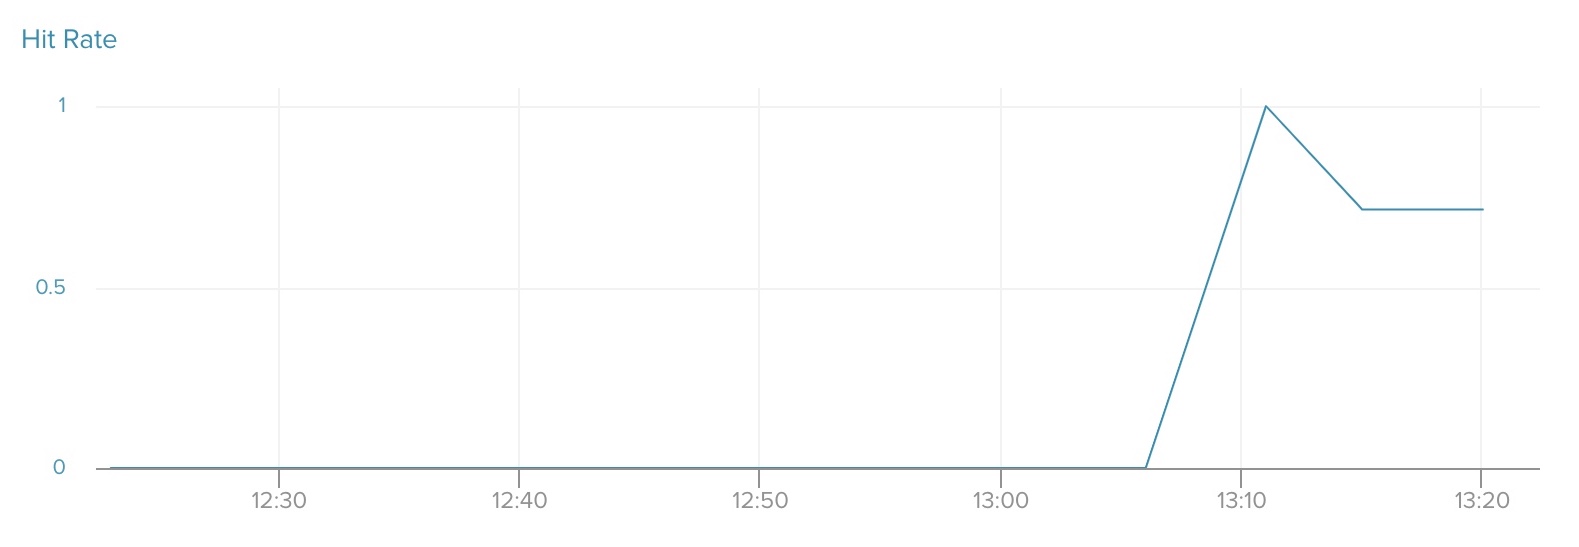
index-cache-hit-rate tells you the ratio of index lookups served from the shared buffer cache, rounded to five decimal points. Heroku recommends a value of 0.99 or greater. If your index hit rate is usually less than 0.99, then it is worth investigating which queries are the most expensive. You can also upgrade your database plan for more RAM.

waiting-connections
waiting-connections tells you the number of connections waiting on a lock to be acquired. Many waiting connections can be a sign of mishandled database concurrency.
We recommend setting up an alert for any connections waiting five consecutive minutes. The pg-extras CLI plugin can help identify queries that are preventing other operations from taking place. Once those queries have been identified they can be terminated in order to resolve lock contention. Knowing which statements are causing blocks can help identify application code to optimize for reducing locks.

Server Metrics
load-avg
load-avg tells you the average system load over a period of 1, 5, and 15 minutes, divided by the number of available CPUs. A load-avg of 1.0 means that, on average, processes requested CPU resources for 100% of the timespan.
A load over 1.0 indicates that processes had to wait for CPU time in the given window. Higher values indicate more time spent by processes waiting. Values under 1.0 indicate that CPUs spent time idle during the given window. If this value is high, then this means that you will get less consistent query execution times and longer wait times.
Once the value goes over 1.0, you are over-utilizing resources. Therefore, you will want to know before the load reaches values over 1.0. Again, we recommend setting alerts at 80% (8.0) and 90% (9.0).
You can check current activity with the pg:ps command for CPU-intensive queries. If your load-avg values are consistently high then it may be worth upgrading to a larger plan. However, before upgrading, it is useful to tune expensive queries to reduce the amount of processing work done on the database.

read-iops
read-iops tells you how many read IO requests are made to the main database disk partition in values of IO Operations Per Second (IOPS). Each plan has a provided Provisioned IOPS (PIOPS) max. This is the maximum total reads + writes per second that the provisioned disk volume can sustain.
You want your reads to come from memory (cache) rather than disk to increase the speed of reads. Exceeding provisioned IOPS can lead to long transaction times and high load-avg since processes need to wait on I/O to become available.
You can set up an alert for 90% of your Provisioned IOPS to identify activities or statements that require significant I/O. Before upgrading to a larger plan you can tune expensive queries to reduce the amount of data being read directly from disk.

wal-percentage-used
wal-percentage-used tells you the space left to store temporary Postgres write-ahead logs. You are at risk of completely filling up the WAL volume if the rate of WAL generation exceeds the rate of WAL archival. This will shut down the database and potentially lead to a risk of data loss.
If you reach 75% utilization, then your database connection limit will be automatically throttled by Heroku. All connections will be terminated at 95% utilization. Unlike previous metrics, we recommend setting up an alert for when this number reaches 60%.

Conclusion
We have reviewed a broad collection of different metrics that provide a range of different insights. The health of a database depends on numerous factors, which include the following:
- size
- number of connections
- cache utilization
- server load
- read frequency
- WAL percentage
Once a developer has visibility into these metrics, they will be better equipped to make informed decisions about provisioning and managing their data. For additional information on monitoring, I recommend you check out this article from Heroku.
Opinions expressed by DZone contributors are their own.

Comments