Real-World Garbage Collection Scenarios and Solutions
Is GC tuning in Java really worthwhile? Real-life case studies show dramatic performance improvements with small tweaks to GC tuning.
Join the DZone community and get the full member experience.
Join For FreeIf you’re experiencing Java performance problems, where do you start looking for solutions? Is GC tuning really worthwhile? How do you analyze the GC logs to identify and fix bottlenecks?
This article looks at some real-life success stories, where organizations were able to achieve dramatic performance gains simply by tweaking GC.
Java GC Troubleshooting: Key Performance Indicators (KPI)
Before going any further, let’s look at how garbage collection performance is measured. In GC tuning, there are certain KPI factors that you need to be aware of:
- Throughput: This is the percentage of time an application spends in doing actual work, as opposed to GC. For performance-critical applications, this should be around 99%.
- Latency: This is the time the application pauses while GC events suspend all other threads. Average and maximum latency are important statistics. Ideally, the average pause should be in milliseconds, and maximum pauses no more than a few seconds, although less critical systems can tolerate a certain amount of latency.
- CPU time: The GC should not use an excessive percentage of CPU time;
- Response time: The average and maximum times the system takes to respond to a user request.
Gathering and Analyzing Information
How do you obtain garbage collection performance data for your application?
It’s worth enabling GC logging when you run your programs. You’d use JVM command line arguments. Logging uses very little overhead and lets you access statistics when you need them.
To enable GC logging, include the following command line switches when you run the program:
For Java 9 or later, the argument is:
-Xlog:gc*:file=<gc-log-file-path>
For Java 8 or earlier, the argument is:
-XX:+PrintGCDetails -Xloggc:<gc-log-file-path>
Several tools are available to work with the logs, like GCeasy. It automatically analyzes the logs, showing KPI, GC statistics, and insights into memory usage. It also gives performance tuning recommendations based on the logs.
Real-Life Case Studies
Let’s look at a few scenarios where GC tuning resulted in big performance gains.
1. Insurance Application Intermittently Unresponsive
An insurance company intermittently experienced poor response times between 10 AM and 4 PM. They submitted GC logs to GCeasy, and discovered that full GC events were running back-to-back, leaving no resources for actual processing.
This symptom showed that memory was filling up too fast. They opted to increase the memory size, and retune the heap size settings accordingly. They decided that analyzing the code to streamline object creating would be too costly, since the system was complex and refactoring and retesting would take too long.
Throughput increased by 23%, response times by 15%, and GC CPU time reduced by 50%.
You can read the full case study for more information.
2. Robotics Application Experiencing 5 Minute Outages
A complex program is used to control robots working in a warehouse. Occasionally, the program paused for as much as 5 minutes. This was disastrous, as the robots weren’t given instructions during this time, and behaved erratically.
Analysis of the GC logs using GCeasy identified that these pauses were caused by long-running GC events. Investigations showed that the heap size was very large (126 GB), and the system was running the CMS GC algorithm.
CMS has, in fact, been deprecated in later versions of Java, because infrequent compaction causes fragmentation over time, and the system pauses while this is dealt with.
Systems engineers decided to opt for the G1 GC algorithm, since the company used an early version of Java, and algorithms such as Z and Shenandoah were not yet stable.
This simple change reduced the longest pause time experienced to about 2 seconds, with an average pause time of 198ms.
You can read the full case study here.
3. Cloud Service Provider Experiencing Long GC Pauses
A cloud service provider hosted time-critical applications. They experienced frequent GC pauses, and analysis with GCeasy showed an unacceptable throughput of 96%.
The image below shows part of the GCeasy report before any tuning took place.
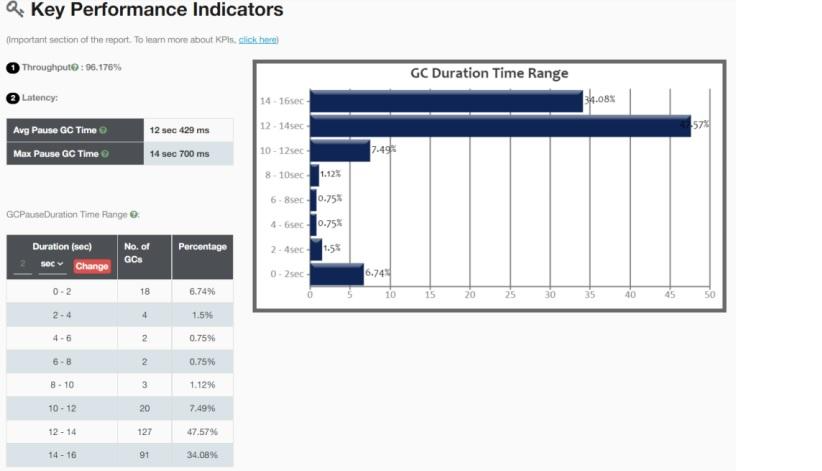
The report also showed that most of the GC events were caused by allocation failure, which indicates that objects couldn’t be created in the young generation.
The system had a heap size of 40GB, split equally between young and old generations, and it was using the Parallel GC algorithm.
Young generation should always be comparatively small, to ensure GC happens quickly in this space. GC collection in the young generation happens frequently, and if it’s sized incorrectly, it adds a considerable overhead to GC performance.
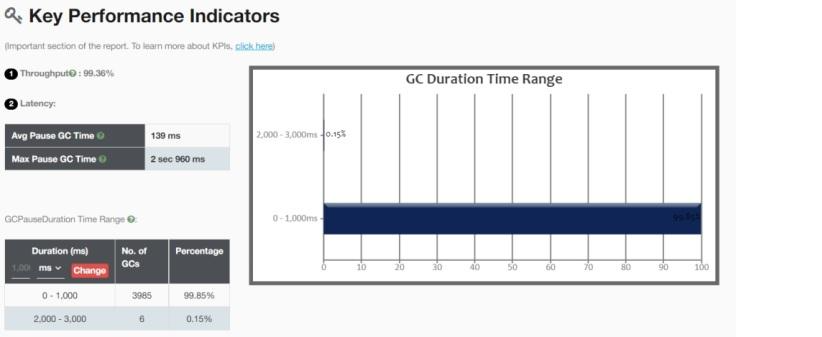
By cutting down the size of the young generation to 1GB, throughput was instantly increased to 99%. Average latency dropped from 12 seconds to 139 ms. The image below shows KPI after tuning.
You’ll see that GC duration is now consistently very short.
Read the full case study here.
Conclusion
Java GC troubleshooting is often a fast and inexpensive way of achieving major performance gains. In this article, we’ve looked at real-life case studies where a small change resulted in significant improvement in performance.
If your Java application is not performing as it should, GC performance analysis should always be your first step in trying to solve the problem.
You can read more case studies on this blog.
Opinions expressed by DZone contributors are their own.
Comments