Grafana Analysis and Visualization with CA APM
This article is an analysis and visualization of Grafana, a multi-platform open-source analytical and visualization tool, with CA APM.
Join the DZone community and get the full member experience.
Join For FreeIntroduction
A Grafana is a multi-platform open-source analytical and visualization tool that consists of multiple individual panels arranged in a grid. It turns your time-series database (TSDB) data into beautiful graphs and visualizations. The panels interact with configured data sources, AWS CloudWatch, Prometheus, MySQL, InfluxDB, SQL Server, etc.
Setup Grafana:
- Refer to the instructions for your OS in the Installation section for instructions.
- Open your web browser and go to http://localhost:3000/
- On the login page, type admin for the username and password.
CA APM monitors the performance of applications and lets IT managers diagnose bottlenecks and other problems, it has capabilities to spot anomalies earlier, predict behavior, and enable automatic corrective actions.
CA APM Integration with Grafana
Grafana requires the NovaTec plugin to integrate with CA APM. NovaTec plugin enables you to query all the metrics from CA APM and visualize them in Grafana Dashboards.
- Install it from here: https://github.com/NovaTecConsulting/ca-apm-grafana-datasource
- Copy the contents of this repository to the plugin directory of your Grafana installation
Windows location: C:\Program Files\GrafanaLabs\grafana>\data\plugins\ca-apm-datasource
Linux : /var/lib/grafana/plugins/ca-apm-datasource
3. Reload Grafana and click DataSource
Now You can see new Datasource as CA APM
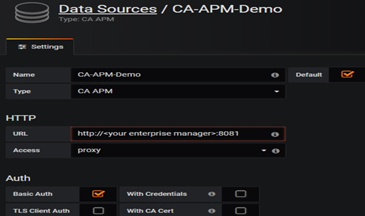
 4. Click on Add DataSource in URL to provide APM Enterprise Manager's API endpoint and proper authentication details (HTTP basic authentication). Click "Save & Test"
Changes in Servers to be Monitored
Download and install CA APM Infrastructure Agent, This should be already available if you have established CA APM monitoring in your enterprise. UNIX just untar it and windows unzip the Agent file.
Start Infrastructure Agent: ./apmia-ca-installer.sh install (UNIX)
a. IntroscopeAgent.profile changes (/opt/caapm/apmia/core/config)
- Configure
agentManager.url.1=<APM endpoint URL> - Default Agent Name:
introscope.agent.agentName=CPM_Agent introscope.epagent.plugins.stateless.names=CPU,DISKintroscope.epagent.stateless.CPU.command=/usr/bin/perl /opt/caapm/apmia/extensions/<Enterprise>/linuxCPU.plintroscope.epagent.stateless.CPU.delayInSeconds=15
**Note item#4 is requested for PERL script If its Python Script replace it with next row
introscope.epagent.stateless.POSTGRES.command=/usr/bin/python /opt/caapm/apmia/extensions/<Org>/pg_apm_grafana.py
Link for https://github.com/forprem/pg-metrics/blob/master/pg_apm_grafana.py
Above python file contains code which generates metrics for CA APM
b. These scripts (item#4 above) has to be created and stored in this location:
opt/caapm/apmia/extensions/<Enterprise>
c. The script will return the metrics data in this format
{"type" : "<a supported metric type>",
"name" : "<a unique metric name (including path but excluding host|process|agent)>",
"value" : "<the metric value>"} }
Sample:.
<metric type="IntCounter" name="Postgres| Replication: Master Replay Lag (#)" value="-56" />
d. Restart agent if its required ./apmia-ca-installer.sh restart
Verify data in CA APM
Now you can see your metrics in CA APM
Pull Metrics in Grafana
Create a new Dashboard in Grafana or import any of the existing JSON dashboards. Select a CA APM data source which was created earlier in this article.
https://grafana.com/docs/grafana/latest/getting-started/getting-started/
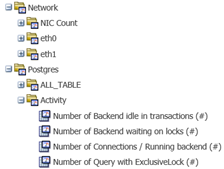
- Browse available metrics to construct a metric query
- Refine the query afterward with basic regular expressions, e.g. wildcards
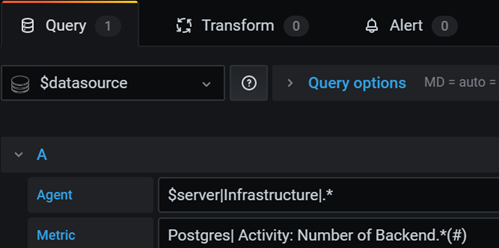
Below given CA APM Metrics will be converted into an above form in the screenshot
SuperDomain/APMIA|localhost|Infrastructure|CPM_Agent|Postgres| Activity: Number of Backend idle in transactions (#)
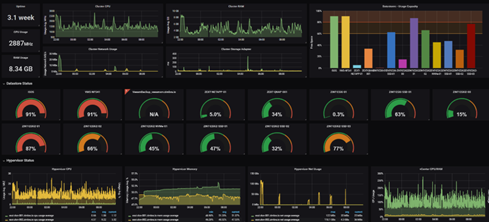
Final Dashboard maybe like this after adding multiple panels
Conclusion
In this article, we have seen what Grafana Dashboard is and how to configure it. There are most organizations are already having CA APM tools for capturing metrics to their servers. These organizations do not want to change their setup. With my configuration, we can use the existing CA APM tool and just adopt the new Grafana open-source dashboard. In my opinion, it is a great tool to get started with monitoring live resources from the production environment as it is free of cost and easy to install and use. The dashboards can be easily created with some basic knowledge of SQL and can be set to refresh on a schedule.
Opinions expressed by DZone contributors are their own.
Comments