Visual Network Mapping Your K8s Clusters To Assess Performance
Visual network mapping is crucial for effective network management. Caretta and Grafana provide real-time network visualization and monitoring.
Join the DZone community and get the full member experience.
Join For FreeBuilding performant services and systems is at the core of every business. Tons of technologies emerge daily, promising capabilities that help you surpass your performance benchmarks. However, production environments are chaotic landscapes that exact a heavy performance toll when not maintained and monitored.
Although Kubernetes is the defacto choice for container orchestration, many organizations fail to implement it. Growing organizations, in the process of upscaling their services, unintentionally introduce complexities into the system. Knowing how the infrastructure is set up and how clusters operate and communicate are crucial.
Most of the infrastructural setup is tranched into a network of systems to communicate and share the workloads. If only we could visually see how the systems are connected and the underlying factors. Mapping the network using an efficient tool for visualization and assessment is essential for monitoring and maintaining services.
Introduction To Visual Network Mapping
Network mapping is the process of identifying and cataloging all the devices and connections within a network. A visual network map is a graphical representation of the network that displays the devices and the links between them. Visual network maps can provide a comprehensive understanding of a network's topology and identify potential problems or bottlenecks, allowing for modifications and expansion plans that can significantly improve troubleshooting, planning, analysis, and monitoring.
Open-source security tools, such as OpenVAS, Nmap, and Nessus, can be used to conduct network mapping and generate visual network maps. These tools are freely available, making them a cost-effective option for organizations looking to improve their network security. Furthermore, many open-source security tools also offer active community support, enabling users to share knowledge, tips, and best practices for using the tool to its full potential.
Benefits of Using Visual Network Maps
An effective tool for planning and developing new networks, expanding or modernizing existing networks, and analyzing network problems or issues is a visual network map.
A proper setup of visual network maps can exponentially augment the monitoring, tracking, and remediation capabilities. It can give you a clear and complete picture of the network, enabling you to pinpoint the issue’s potential source and resolve it then and there, or it can assist you in real-time network monitoring and notify you of any changes or problems beforehand.
Introduction to Caretta and Grafana
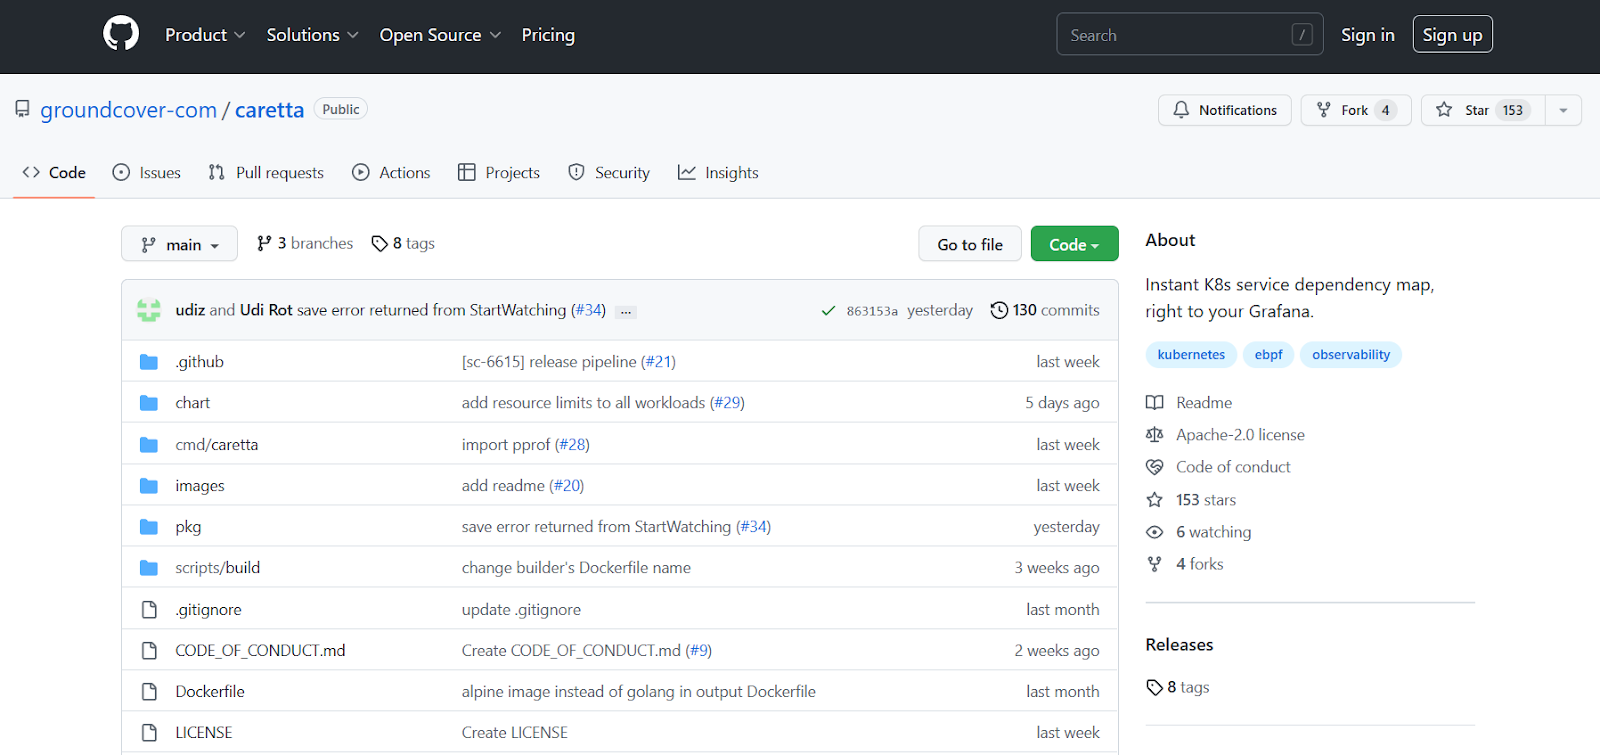
Caretta is an open-source network visualization and monitoring tool that enables real-time network viewing and monitoring.

Grafana is an open-source data visualization and monitoring platform that enables you to create customized dashboards and alerts as well as examine and analyze data.

An effective solution for comprehending and managing your network can be created by combining Caretta and Grafana.
How Caretta Uses eBPF and Grafana
Caretta’s reason for existence is to help you understand the topology and the relationships between devices in distributed environments. It offers various capabilities such as device discovery, real-time monitoring, alerts, notifications, and reporting. It uses Victoria Metrics to gather and publish its metrics, and any Prometheus-compatible dashboard can use the results.
Carreta makes it possible to accept typical control-plane node annotations by enabling tolerations. It gathers network information, such as device and connection details, using the eBPF (extended Berkeley Packet Filter) kernel functionality and then uses the Grafana platform to present the information in a visual map.
Grafana’s Role in Visualizing Caretta’s Network Maps
Grafana is designed to be a modular and flexible tool that integrates and onboards a wide range of data sources and custom applications with simplicity.
Due to its customizable capabilities, you can modify how the network map is presented using the Grafana dashboard. Additionally, you can pick from several visualization options to present the gathered data in an understandable and helpful way. Grafana is crucial for both showing the network data that Caretta has gathered and giving users a complete picture of the network.
Using Caretta and Grafana To Create a Visual Network Map
To use Caretta and Grafana for creating a visual network map, you must set up, incorporate, and configure them. The main configuration item is the Caretta daemonset.
You must deploy the Caretta daemonset to the cluster of choice that will collect the network metrics into a database and set up the Grafana data source to point to the Caretta database to see the network map.
Prerequisites and Requirements for Using Caretta and Grafana
Caretta is a modern tool integrated with advanced features. It relies on Linux kernel version >= 4.16 and x64 bit system helm chart.
Let's dive in and see how to install and configure this brilliant tool combination.
Steps for Installing and Configuring Caretta and Grafana
With an already pre-configured helm chart, installing Caretta is just a few calls away.
The recommendation is to install Caretta in a new, unique namespace.
helm repo add groundcover https://helm.groundcover.com/
helm repo update
helm install caretta --namespace caretta --create-namespace groundcover/caretta
The same can be applied to installing Grafana.
helm install --name my-grafana --set "adminPassword=secret" \n
--namespace monitoring -f custom-values.yaml stable/grafana
Our custom-values.yaml will look something like below:
## Grafana configuration
grafana.ini:
 ## server
 server:
   protocol: http
   http_addr: 0.0.0.0
   http_port: 3000
   domain: grafana.local
 ## security
 security:
   admin_user: admin
   admin_password: password
   login_remember_days: 1
   cookie_username: grafana_admin
   cookie_remember_name: grafana_admin
   secret_key: hidden
 ## database
 database:
   type: rds
   host: mydb.us-west-2.rds.amazonaws.com
 ## session
 session:
   provider: memory
   provider_config: ""
   cookie_name: grafana_session
   cookie_secure: true
   session_life_time: 600

## Grafana data
persistence:
 enabled: true
 storageClass: "-"
 accessModes:
 - ReadWriteOnce
 size: 1Gi
Configuration
You can configure Caretta using helm values. Values in Helm are a chart’s setup choices. When the chart is installed, you can change the values listed in a file called values.yaml, which is part of the chart package, and customize the configurations based on the requirement at hand.
An example of configuration overwriting default values is shown below:
pollIntervalSeconds: 15  # set metrics polling interval
tolerations:             # set any desired tolerations
 - key: node-role.kubernetes.io/control-plane
   operator: Exists
   effect: NoSchedule

config:
 customSetting1: custom-value1
 customSetting2: custom-value2

victoria-metrics-single:
 server:
   persistentVolume:
     enabled: true   # set to true to use persistent volume

ebpf:
 enabled: true  # set to true to enable eBPF
 config:
   someOption: ebpf_options
The pollIntervalSeconds sets the interval at which metrics are polled. In our case, we have set it to poll every 15 seconds.
The tolerations section allows specifying tolerations for the pods. In the shown example, pods are allowed only to run on nodes that have the node-role.kubernetes.io/control-plane label and exist with the effect NoSchedule.
The config section allows us to specify custom configuration options for the application.
The victoria-metrics-single section allows us to configure the Victoria-metrics-single server. Here, it is configuring the persistent volume as enabled.
The eBPF section allows us to enable eBPF and configure its options.
Creating a Visual Network Map With Caretta and Grafana
Caretta consists of two parts: the “Caretta Agent” and the “Caretta Server.” Every node in the cluster runs the Caretta Agent Kubernetes DaemonSet, which collects information about the cluster’s status.
You will need to include the data gathered by Caretta in Grafana in order to view it as a network map and generate a visual network map.
apiVersion: apps/v1
kind: DaemonSet
metadata:
 name: caretta-depoy-test
 namespace: caretta-depoy-test
spec:
 selector:
   matchLabels:
     app: caretta-depoy-test
 template:
   metadata:
     labels:
       app: caretta-depoy-test
   spec:
     containers:
     - name: caretta-depoy-test
       image: groundcover/caretta:latest
       command: ["/caretta"]
       args: ["-c", "/caretta/caretta.yaml"]
       volumeMounts:
       - name: config-volume
         mountPath: /caretta
     volumes:
     - name: config-volume
       configMap:
         name: caretta-config
Data from the Caretta Agent is received by the Caretta Server, a Kubernetes StatefulSet, which then saves it in a database.
apiVersion: apps/v1
kind: StatefulSet
metadata:
 name: caretta-depoy-test
 labels:
   app: caretta-depoy-test
spec:
 serviceName: caretta-depoy-test
 replicas: 1
 selector:
   matchLabels:
     app: caretta-depoy-test
 template:
   metadata:
     labels:
       app: caretta-depoy-test
   spec:
     containers:
       - name: caretta-depoy-test
         image: groundcover/caretta:latest
         env:
           - name: DATABASE_URL
             value: mydb.us-west-2.rds.amazonaws.com
         ports:
           - containerPort: 80
             name: http
To accomplish this, you will need to create a custom data source plugin in Grafana to connect to Caretta’s data and then develop visualizations in Grafana to show that data.
[datasources]
[datasources.caretta]
 name = caretta-deploy-test
 type = rds
 url = mydb.us-west-2.rds.amazonaws.com
 access = proxy
 isDefault = true
Customization Options for the Network Map and How to Access Them
The network map that Caretta and Grafana produced can be customized in a variety of ways. We can customize the following:
- Display options: With display customization options, you have control over the layout of the map, the thickness, and the color of the connections and devices.
- Data options: With data options, you may select which information, including warnings, performance metrics, and details about your device and connection, is shown on the map.
- Alerting options: With alerting options, you can be informed of any network changes or problems, such as heavy traffic, sluggish performance, or connectivity problems.
- Visualization options: With visualization options, you can present the gathered data in an understandable and useful way.
Usually, you’ll need to use the Grafana dashboard to access these and other customization options. Depending on the version of Caretta and Grafana you are running and your particular setup and needs, you will have access to different options and settings.
Interpreting and Using the Visual Network Map
The primary goals of a visual network map made with Caretta and Grafana are aiding in network topology comprehension, the identification of possible bottlenecks or problems, and the planning and troubleshooting of network problems. You must comprehend the various components of the map and what they stand for in order to interpret and use the visual network map.
Some of the types of information that may be displayed on the map are:
- Devices: The network’s endpoints, including servers, switches, and routers, are presented on the map.
- Connections: The connections between devices, such as network cables, wireless connectivity, or virtual connections, and sometime the connectivity type may be depicted on the map.
- Data: Performance indicators, alarms, and configuration information will be displayed on the maps.
Tips for Using the Network Map To Assess Performance in Your K8s Cluster
Creating a curated, informative and scalable network map is more challenging than it sounds. But with a proper tool set, this becomes manageable.
We have seen what we can accomplish using Caretta and Grafana together. Now, let's see what we need to consider for using network maps that showcase the performance metrics of your Kubernetes clusters.
First and foremost, understand the network topology of the cluster, including the physical and virtual networks that your services run on. Next, ensure that the network plugin that you are using is compatible with your application. Finally, define network policies to secure communication between pods, control ingress, and egress traffic, monitor, and troubleshoot. Understand pod-to-pod communication and pod networking is happening.
Conclusion
Breaking down large systems into microservices, making systems distributed, and orchestrating them is the most followed approach to boost performance and uptime. Kubernetes and Docker are the market leaders here.
As performant as it is, observability is a concern in large-scale distributed systems. We need to consider all the influencing outliers and anomalies to monitor and enhance the overall system with optimal performance in mind. New technologies make innovations and advancements easy but introduce unknown impediments to the system. You need an observability tool that can track all the network operations and present them in an efficient and informative way.
Grafana is the leading tool in the monitoring space. By combining Caratta, an open-source network visualization, and monitoring tool, with Grafana, we can unlock the true value of our infrastructure.
Opinions expressed by DZone contributors are their own.

Comments