Mastering SSR and CSR in Next.js: Building High-Performance Data Visualizations
Learn the power of SSR and CSR and how to implement both using Next.js. Gain practical insights to build real-world data visualization applications.
Join the DZone community and get the full member experience.
Join For FreeModern web and mobile applications require showing information from large and changing datasets in an actionable manner to end users. As an example, for a trading application, it is of paramount importance to show changing stock prices for several stocks in a single instance with high performance and accuracy. Slow load times and sluggishness can cause users to become frustrated or even incur financial losses as in the case of the trading application example — which breaks user trust. Therefore, performance in the web application becomes a "must have" and not just a "nice to have."
Next.js is tailormade for such scenarios. It is built on top of React — incorporating all performance gains techniques such as shadow DOM and one-way data from it. Moreover, it supports advanced features such as Server-Side Rendering (SSR) and static site generation (SSG), which reduce page load times significantly compared to traditional rendering techniques. Moreover, Next.js is a full-stack application development framework and has integrated routing, API endpoints, and support for fetching data from other servers.
In this advanced article, you will learn the key differences between Server-Side Rendering and Client-Side Rendering and build a robust data visualization application with Rechart and Next.js to further enhance your knowledge of these key concepts of Next.js.
Overview of SSR vs CSR
In SSR (Server-Side Rendering), the server generates fully renderable HTML and sends it to the end user browser for display. In CSR (Client-Side Rendering), a server sends minimal HTML and underlying JavaScript to fully form and render the page at runtime in the end user browser. Using SSR allows using server resources for creating the page — leaving performance guesswork out when it comes to full page display, which is often the case with CSR which depends on the end user's machine's compute and memory for performance. Additionally, SSR is SEO (Search Engine Optimization)-friendly, as search engines can index content from the initial HTML. In upcoming sections, you will build using Next.js with Recharts.
Prerequisite for Development
You need to meet some prerequisites and set up your development environment for building the application:
- Node.js and npm are available on the machine. Verify them using
node -vandnpm -v. - A code editor of your choice: Using Visual Studio Code is recommended but not mandatory.
- Basic understanding of how React works and what JSX is: You can read this React.js DZone ref card for a quick refresher.
Initializing a New Next.js Application With Dependencies
Follow the steps below to create a new Next.js application.
- Initialize the application using the command
npx create-next-app@latest data-viz-demo. Select the options as shown below.

- Go inside the application folder using
cd data-viz-demo. - Install Rechart dependency using
npm install recharts. - Start the newly created application using
npm run dev. Once the application has compiled fully, navigate tohttp://localhost:3000. You should see a page as shown in the illustration below.

Building Client-Side Rendered Component
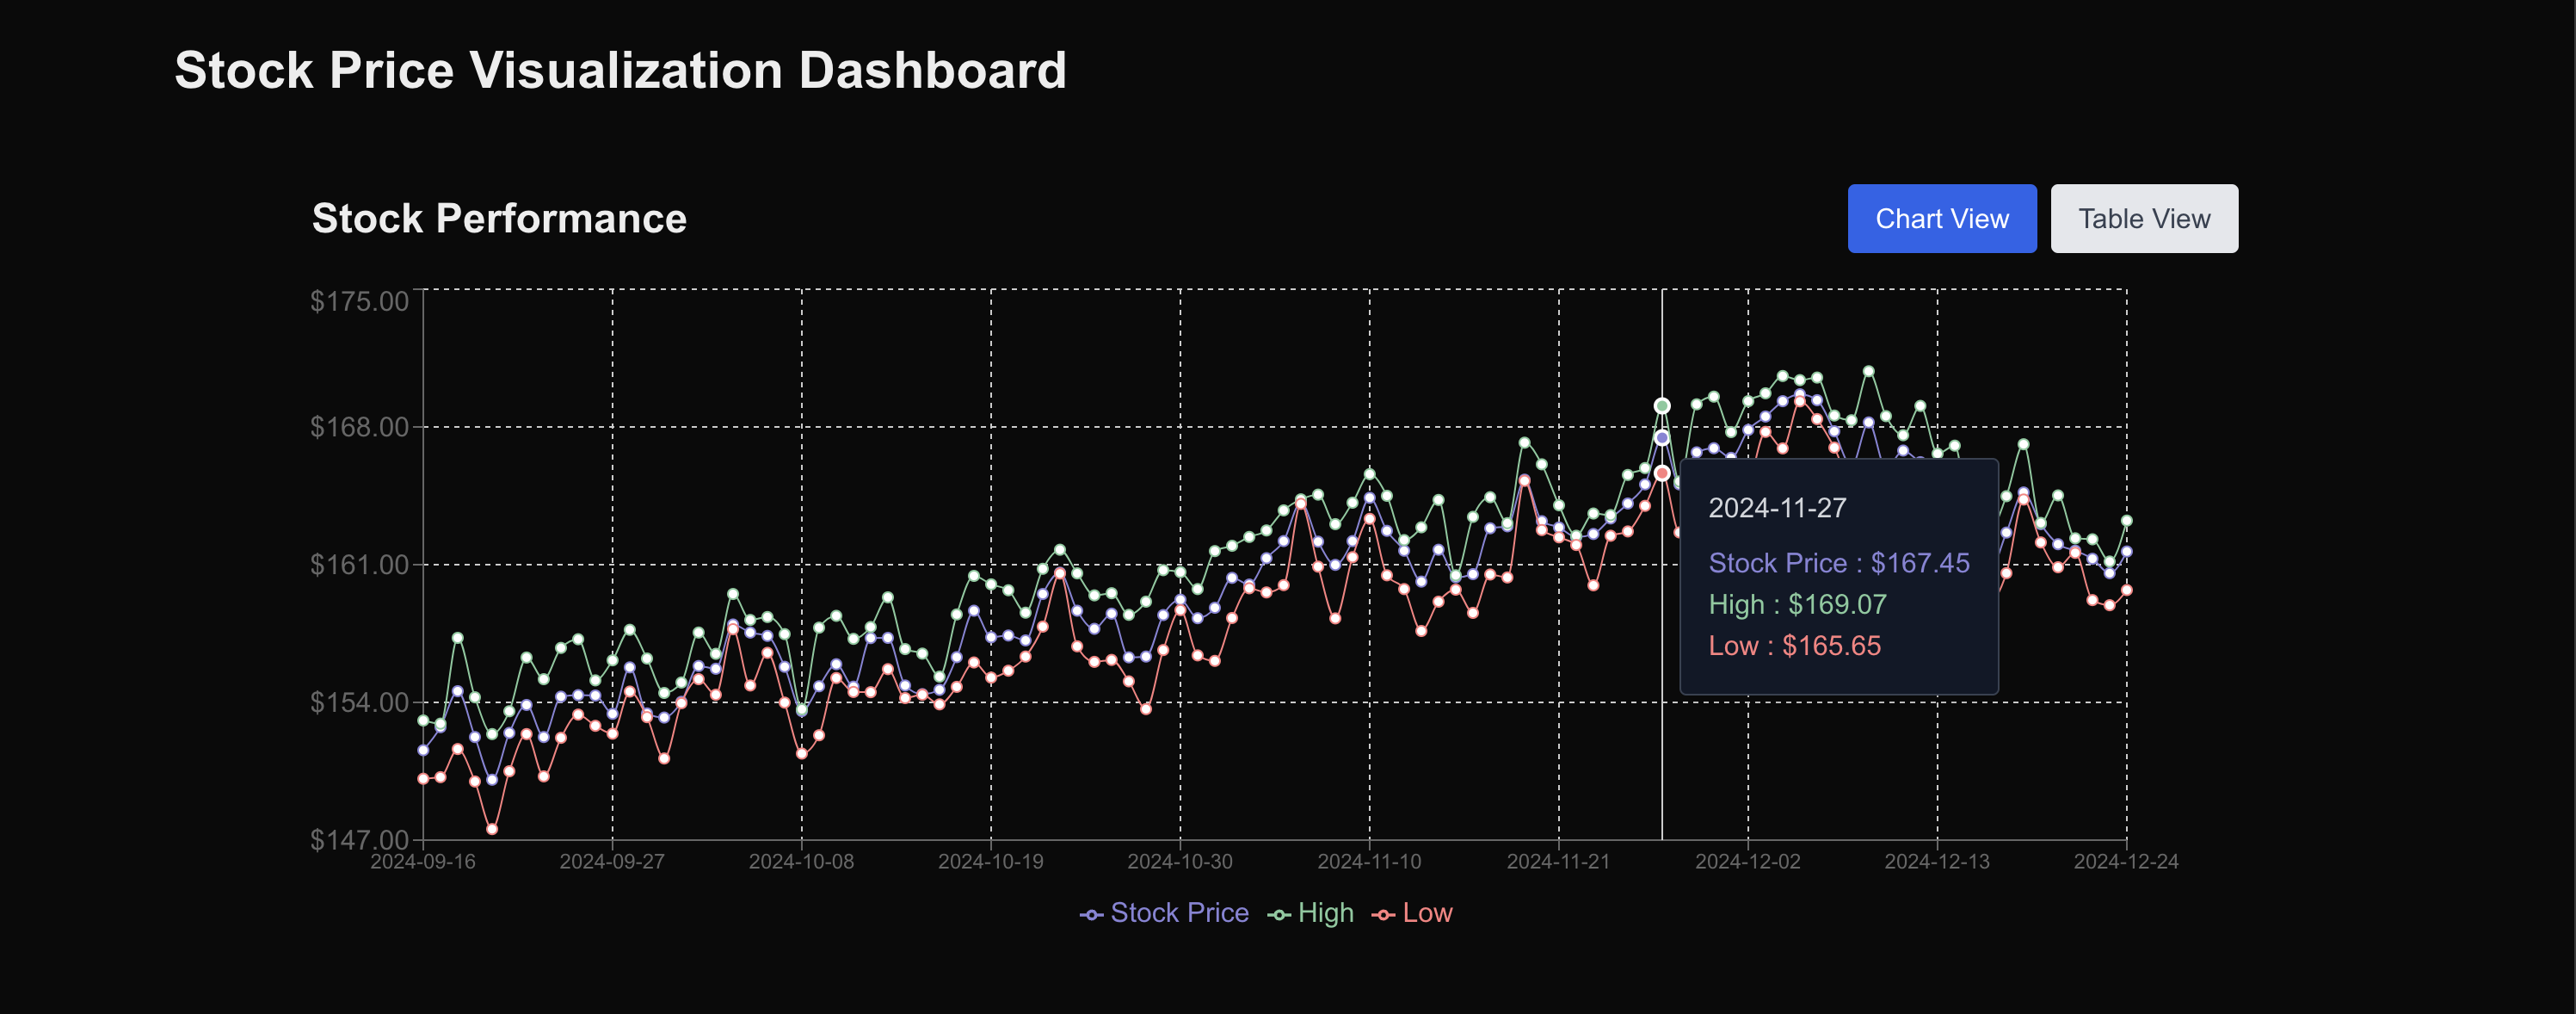
Now that the basic application setup is complete, you are ready to move on to building the first real component. This component will display data in graph as well as table format. You will build this component first purely using CSR. Follow the steps below to build the component.
- You will need data before the data can be visualized. Create dummy data using a function. Add a directory name utils under src, and add the file
generateStockDatainside it with the code below.
// File path: src/utils/generateStockData.ts
export interface StockDataPoint {
    date: string;
    price: number;
    volume: number;
    high: number;
    low: number;
  }

  export const generateStockData = (): StockDataPoint[] => {
    const data: StockDataPoint[] = [];
    let basePrice = 150;

    for (let i = 0; i < 100; i++) {
      const priceChange = (Math.random() - 0.5) * 5;
      basePrice += priceChange;

      const high = basePrice + Math.random() * 3;
      const low = basePrice - Math.random() * 3;

      const date = new Date();
      date.setDate(date.getDate() - (100 - i));

      data.push({
        date: date.toISOString().split('T')[0],
        price: Number(basePrice.toFixed(2)),
        volume: Math.floor(Math.random() * 1000000) + 500000,
        high: Number(high.toFixed(2)),
        low: Number(low.toFixed(2))
      });
    }

    return data;
};- Next, add the data visualization component and add the below code in it.
// File path: src/components/StockVisualizer.tsx
'use client';

import { useState } from 'react';
import {
  LineChart,
  Line,
  XAxis,
  YAxis,
  CartesianGrid,
  Tooltip,
  Legend,
  ResponsiveContainer
} from 'recharts';
import { generateStockData } from '@/utils/generateStockData';

const CustomTooltip = ({ active, payload, label }: any) => {
  if (active && payload && payload.length) {
    return (
      <div className="bg-gray-900 p-4 rounded shadow-lg border border-gray-700">
        <p className="text-gray-300 mb-2">{label}</p>
        {payload.map((entry: any, index: number) => (
          <p key={index} className="text-base" style={{ color: entry.color }}>
            {entry.name} : ${entry.value.toFixed(2)}
          </p>
        ))}
      </div>
    );
  }
  return null;
};

export default function StockVisualizer() {
  const [viewMode, setViewMode] = useState('chart');
  const [data] = useState(generateStockData);

  const formatPrice = (value: number) => `$${value.toFixed(2)}`;
  const formatVolume = (value: number) => value.toLocaleString();

  return (
    <div className="w-full max-w-6xl mx-auto p-4">
      <div className="mb-4 flex justify-between items-center">
        <h2 className="text-2xl font-bold">Stock Performance</h2>
        <div className="flex gap-2">
          <button
            onClick={() => setViewMode('chart')}
            className={`px-4 py-2 rounded ${
              viewMode === 'chart'
                ? 'bg-blue-600 text-white'
                : 'bg-gray-200 text-gray-700'
            }`}
          >
            Chart View
          </button>
          <button
            onClick={() => setViewMode('table')}
            className={`px-4 py-2 rounded ${
              viewMode === 'table'
                ? 'bg-blue-600 text-white'
                : 'bg-gray-200 text-gray-700'
            }`}
          >
            Table View
          </button>
        </div>
      </div>

      {viewMode === 'chart' ? (
        <div className="h-96 w-full">
          <ResponsiveContainer width="100%" height="100%">
            <LineChart data={data}>
              <CartesianGrid strokeDasharray="3 3" />
              <XAxis
                dataKey="date"
                tick={{ fontSize: 12 }}
                interval={10}
              />
              <YAxis
                yAxisId="price"
                domain={['auto', 'auto']}
                tickFormatter={formatPrice}
              />
              <YAxis
                yAxisId="volume"
                orientation="right"
                tickFormatter={formatVolume}
              />
              <Tooltip content={<CustomTooltip />} />
              <Legend />
              <Line
                yAxisId="price"
                type="monotone"
                dataKey="price"
                stroke="#8884d8"
                name="Stock Price"
              />
              <Line
                yAxisId="price"
                type="monotone"
                dataKey="high"
                stroke="#82ca9d"
                name="High"
              />
              <Line
                yAxisId="price"
                type="monotone"
                dataKey="low"
                stroke="#ff7f7f"
                name="Low"
              />
            </LineChart>
          </ResponsiveContainer>
        </div>
      ) : (
        <div className="overflow-x-auto">
          <table className="min-w-full divide-y divide-gray-200">
            <thead className="bg-gray-50">
              <tr>
                <th className="px-6 py-3 text-left text-xs font-medium text-gray-500 uppercase tracking-wider">
                  Date
                </th>
                <th className="px-6 py-3 text-left text-xs font-medium text-gray-500 uppercase tracking-wider">
                  Price
                </th>
                <th className="px-6 py-3 text-left text-xs font-medium text-gray-500 uppercase tracking-wider">
                  High
                </th>
                <th className="px-6 py-3 text-left text-xs font-medium text-gray-500 uppercase tracking-wider">
                  Low
                </th>
                <th className="px-6 py-3 text-left text-xs font-medium text-gray-500 uppercase tracking-wider">
                  Volume
                </th>
              </tr>
            </thead>
            <tbody className="bg-white divide-y divide-gray-200">
              {data.map((row, index) => (
                <tr key={index}>
                  <td className="px-6 py-4 whitespace-nowrap text-sm text-gray-500">
                    {row.date}
                  </td>
                  <td className="px-6 py-4 whitespace-nowrap text-sm text-gray-900">
                    {formatPrice(row.price)}
                  </td>
                  <td className="px-6 py-4 whitespace-nowrap text-sm text-gray-900">
                    {formatPrice(row.high)}
                  </td>
                  <td className="px-6 py-4 whitespace-nowrap text-sm text-gray-900">
                    {formatPrice(row.low)}
                  </td>
                  <td className="px-6 py-4 whitespace-nowrap text-sm text-gray-900">
                    {formatVolume(row.volume)}
                  </td>
                </tr>
              ))}
            </tbody>
          </table>
        </div>
      )}
    </div>
  );
}- The code block above has a lot going on. Below are key highlights:
- Variable
viewModeis utilized to switch between table and chart view. The click of the button changes its value. - Function
generateStockDatahelps you create dummy stock price data which you are displaying in the chart and the table. LineChartcomponent of theRechartlibrary is used for drawing the line chart.- Table rows are dynamically created with
data.mapfunction.
- Variable
- Update your
app/page.tsxfile with the code below. It is the root page of the application.
// File-path: src/app/page.tsx
import DataVisualizer from '@/components/StockVisualizer';

export default function Home() {
  return (
    <main className="container mx-auto py-8">
      <h1 className="text-3xl font-bold mb-8">Stock Price Visualization Dashboard</h1>
      <DataVisualizer />
    </main>
  );
}- After doing all these changes, refresh your browser window. You will see the output below.
Converting to the Server-Side Rendering
- You are ready to transform the code to leverage SSR now. You will be dividing the application into two pages:
/tableand/chart. - The reason to break the application is because the chart view uses
Rechart, and it usesD3.JSinternally.D3.JSneeds direct access to the DOM (Document Object Model) present in the browser. This prevents the chart from being rendered on the server. So/chartpage will stay CSR rendered only. /tablecomponent will be converted to the server-side rendered component. Add two files,src/app/chart/page.tsxandsrc/app/table/page.tsx, and augment them with the code below.
// File-path: src/app/chart/page.tsx
'use client';

import Link from 'next/link';
import {
  LineChart,
  Line,
  XAxis,
  YAxis,
  CartesianGrid,
  Tooltip,
  Legend,
  ResponsiveContainer
} from 'recharts';
import { generateStockData } from '@/utils/generateStockData';

const CustomTooltip = ({ active, payload, label }: any) => {
  if (active && payload && payload.length) {
    return (
      <div className="bg-gray-900 p-4 rounded shadow-lg border border-gray-700">
        <p className="text-gray-300 mb-2">{label}</p>
        {payload.map((entry: any, index: number) => (
          <p key={index} className="text-base" style={{ color: entry.color }}>
            {entry.name} : ${entry.value.toFixed(2)}
          </p>
        ))}
      </div>
    );
  }
  return null;
};

export default function ChartPage() {
  const data = generateStockData();
  const formatPrice = (value: number) => `$${value.toFixed(2)}`;
  const formatVolume = (value: number) => value.toLocaleString();

  return (
    <div className="container mx-auto py-8">
      <div className="w-full max-w-6xl mx-auto p-4">
        <div className="mb-4 flex justify-between items-center">
          <h1 className="text-3xl font-bold">Stock Data (Interactive Chart)</h1>
          <Link
            href="/table"
            className="px-4 py-2 rounded bg-blue-600 text-white hover:bg-blue-700"
          >
            Switch to Table View
          </Link>
        </div>

        <div className="h-96 w-full">
          <ResponsiveContainer width="100%" height="100%">
            <LineChart data={data}>
              <CartesianGrid strokeDasharray="3 3" />
              <XAxis
                dataKey="date"
                tick={{ fontSize: 12 }}
                interval={10}
              />
              <YAxis
                yAxisId="price"
                domain={['auto', 'auto']}
                tickFormatter={formatPrice}
              />
              <YAxis
                yAxisId="volume"
                orientation="right"
                tickFormatter={formatVolume}
              />
              <Tooltip content={<CustomTooltip />} />
              <Legend />
              <Line
                yAxisId="price"
                type="monotone"
                dataKey="price"
                stroke="#8884d8"
                name="Stock Price"
              />
              <Line
                yAxisId="price"
                type="monotone"
                dataKey="high"
                stroke="#82ca9d"
                name="High"
              />
              <Line
                yAxisId="price"
                type="monotone"
                dataKey="low"
                stroke="#ff7f7f"
                name="Low"
              />
            </LineChart>
          </ResponsiveContainer>
        </div>
      </div>
    </div>
  );
}// File-path: src/app/table/page.tsx
import Link from 'next/link';
import { generateStockData } from '@/utils/generateStockData';
export default function TablePage() {
const stockData = generateStockData();
const formatPrice = (value: number) => `$${value.toFixed(2)}`;
const formatVolume = (value: number) => value.toLocaleString();
return (
<div className="container mx-auto py-8">
<div className="w-full max-w-6xl mx-auto p-4">
<div className="mb-4 flex justify-between items-center">
<h1 className="text-3xl font-bold">Stock Data (SSR Table View)</h1>
<Link
href="/chart"
className="px-4 py-2 rounded bg-blue-600 text-white hover:bg-blue-700"
>
Switch to Chart View
</Link>
</div>
<div className="overflow-x-auto">
<table className="min-w-full divide-y divide-gray-200">
<thead className="bg-gray-50">
<tr>
<th className="px-6 py-3 text-left text-xs font-medium text-gray-500 uppercase tracking-wider">
Date
</th>
<th className="px-6 py-3 text-left text-xs font-medium text-gray-500 uppercase tracking-wider">
Price
</th>
<th className="px-6 py-3 text-left text-xs font-medium text-gray-500 uppercase tracking-wider">
High
</th>
<th className="px-6 py-3 text-left text-xs font-medium text-gray-500 uppercase tracking-wider">
Low
</th>
<th className="px-6 py-3 text-left text-xs font-medium text-gray-500 uppercase tracking-wider">
Volume
</th>
</tr>
</thead>
<tbody className="bg-white divide-y divide-gray-200">
{stockData.map((row, index) => (
<tr key={index}>
<td className="px-6 py-4 whitespace-nowrap text-sm text-gray-500">
{row.date}
</td>
<td className="px-6 py-4 whitespace-nowrap text-sm text-gray-900">
{formatPrice(row.price)}
</td>
<td className="px-6 py-4 whitespace-nowrap text-sm text-gray-900">
{formatPrice(row.high)}
</td>
<td className="px-6 py-4 whitespace-nowrap text-sm text-gray-900">
{formatPrice(row.low)}
</td>
<td className="px-6 py-4 whitespace-nowrap text-sm text-gray-900">
{formatVolume(row.volume)}
</td>
</tr>
))}
</tbody>
</table>
</div>
</div>
</div>
);
}- Next.js uses file path-based routing. Therefore, visiting the main URL with the
/tablepath lands you on the table's page.tsx. - The underlying logic to render the chart and the table are the same as you had in the CSR code.
- The final step is to update main page.tsx to reference this updated code.
// File-path: src/app/page.tsx
import { redirect } from 'next/navigation';

export default function Home() {
  redirect('/table');
}- With this change, your application is updated, and visiting http://localhost:3000/chart in a browser will show a chart with the option to toggle to http://localhost:3000/table for table view.
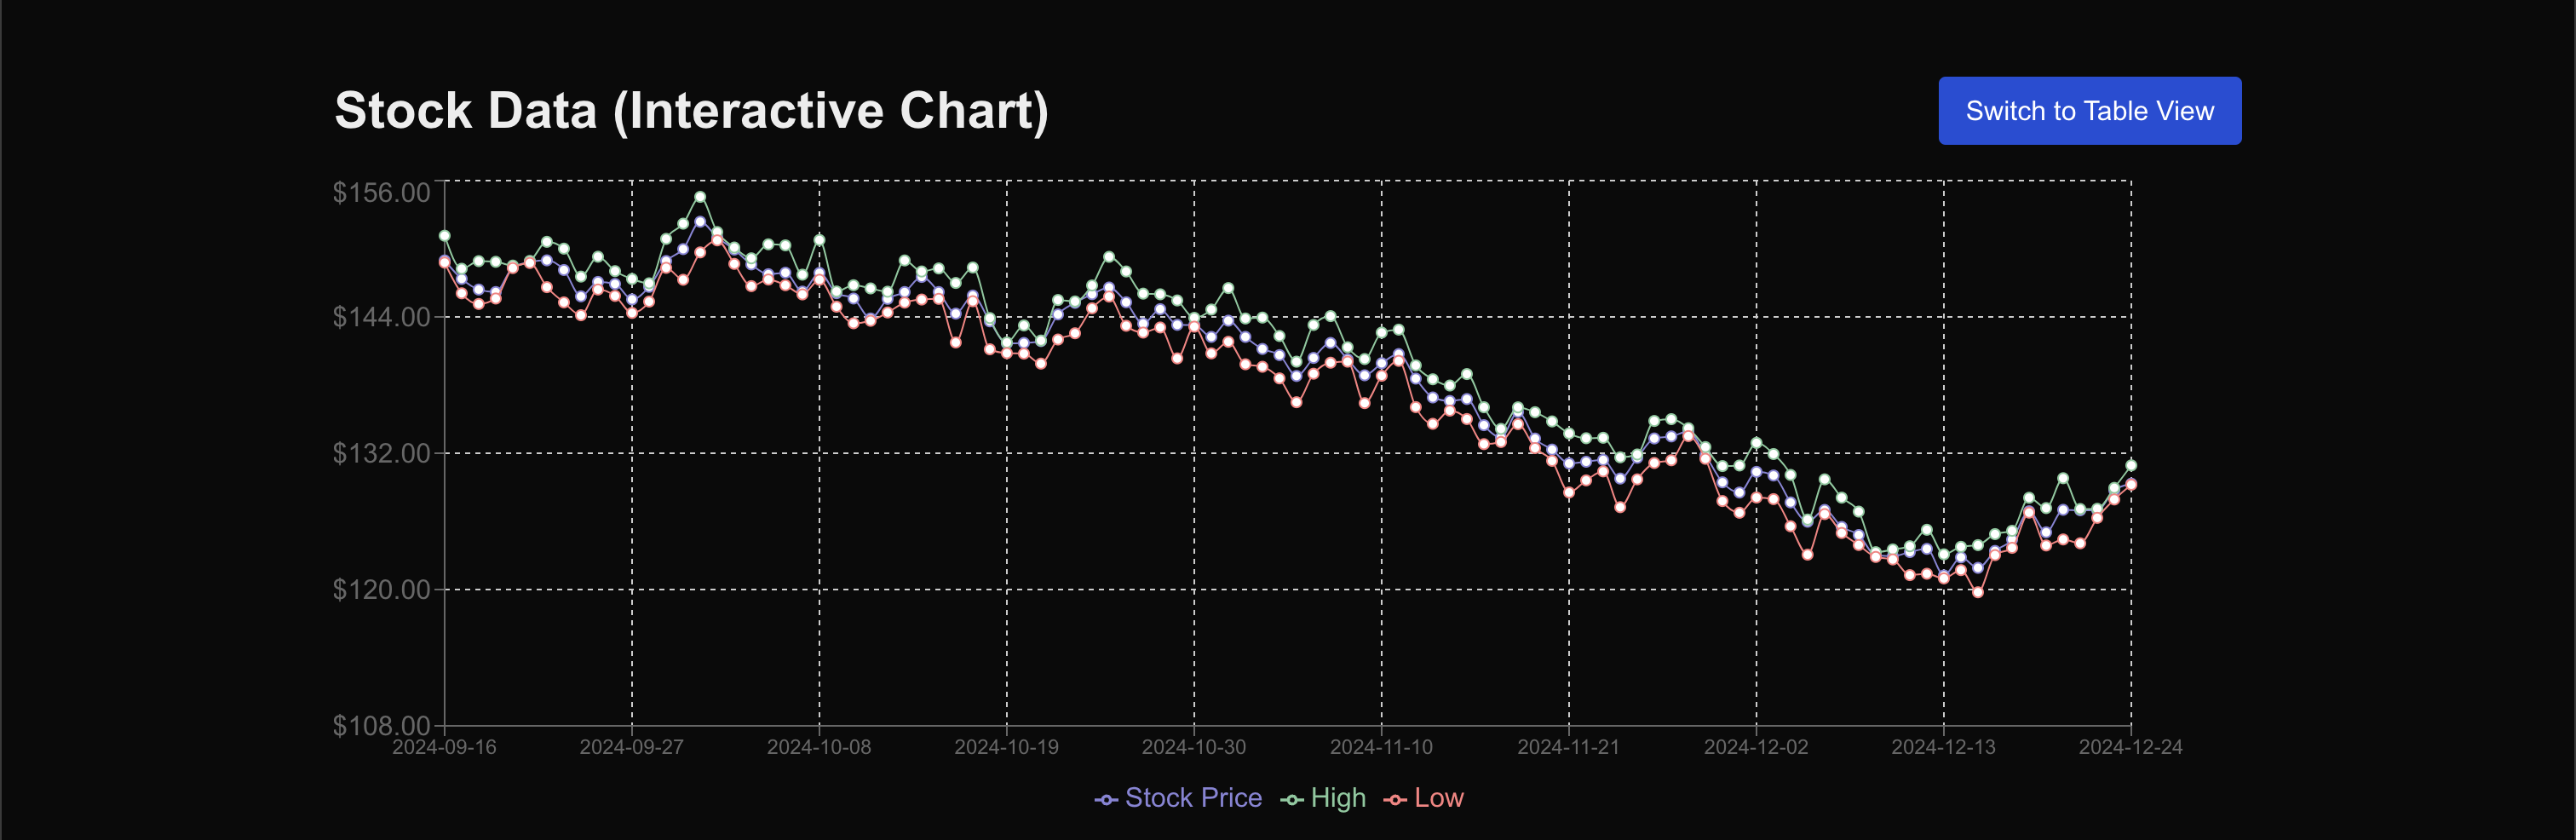
- If you observe the network panel in Chrome Developer Tools, you will observe that for
/tableURL, you are getting fully compiled HTML. This is the true power of SSR.
Conclusion
By following this article, you have learned about Server-Side Rendering and Client-Side Rendering. You implemented these using Next.js, a very popular React-based framework. Additionally, you learned when to use CSR vs SSR and the benefits of both with practical implementation.
Some key takeaways are:
- SSR is beneficial for content-heavy applications, and where SEO plays a key role.
- CSR is useful when an application is highly interactive and direct access to DOM is necessary.
- Next.js is a flexible framework that allows building both CSR and SSR — together or alone, depending on your project needs.
The code built during this article is present on GitHub , but you are highly encouraged to follow through with the article for deeper learning.
Opinions expressed by DZone contributors are their own.
Comments