How To Deploy the ELK Stack on Kubernetes
This article will explore a step-by-step guide on deploying the ELK Stack on Kubernetes. By the end of this guide, you'll have a fully functional ELK stack setup.
Join the DZone community and get the full member experience.
Join For FreeThe ELK stack is an abbreviation for Elasticsearch, Logstash, and Kibana, which offers the following capabilities:
- Elasticsearch: a scalable search and analytics engine with a log analytics tool and application-formed database, perfect for data-driven applications.
- Logstash: a log-processing tool that collects logs from various sources, parses them, and sends them to Elasticsearch for storage and analysis.
- Kibana: A powerful visualization tool that allows you to explore and analyze the data stored in Elasticsearch using interactive charts, graphs, and dashboards.
The Infrastructure of Elasticsearch
Before we dive into deploying the ELK Stack, let's first understand the critical components of Elasticsearch's infrastructure:
- Nodes: elasticsearch runs on dedicated servers called nodes, which operate as binaries for search and analytics tasks.
- Shards: the database space is logically divided into shards, enabling faster data accessibility and distribution.
- Indices: elasticsearch organizes the stored data into indices, facilitating efficient data management.
- Configuring the ELK stack: you'll need a Kubernetes cluster to deploy the ELK Stack on Kubernetes. If you already have one, you can proceed with the deployment. Alternatively, you can use the provided GitHub repository with Terraform files to set up a Kubernetes cluster.
- Deploying elasticsearch: utilizing Helm charts, we can efficiently deploy Elasticsearch. Modify the values file to match your specific requirements, such as adjusting the number of replicas or turning certain features on/off. Download them from Artifactory Hub.
values-elasticsearch.yaml
clusterName: "itsyndicateblog"
replicas: 1
minimumMasterNodes: 1
createCert: true
secret:
  enabled: true
  password: "" # generated randomly if not defined
image: "docker.elastic.co/elasticsearch/elasticsearch"
imageTag: "8.5.1"
resources:
  requests:
    cpu: "200m"
    memory: "500Mi"
  limits:
    cpu: "300m"
    memory: "1Gi"
ingress:
  enabled: false # enable ingress only if you need external access to elasticsearch cluster
  hosts:
    - host: elastic.itsyndicate.org
      paths:
        - path: /
Once you've customized the values, use the Helm chart to install Elasticsearch:
helm install elasticsearch -f elasticsearch-values.yaml <chart-name>Note: Ensure you have configured the drivers (EBS or EFS) for persistent volumes.
Deploying Kibana
Kibana deployment is straightforward using Helm charts. In the values file, specify the URL and port of the Elasticsearch service:
values-kibana.yaml
elasticsearchHosts: "https://elasticsearch-master:9200"
enterpriseSearch: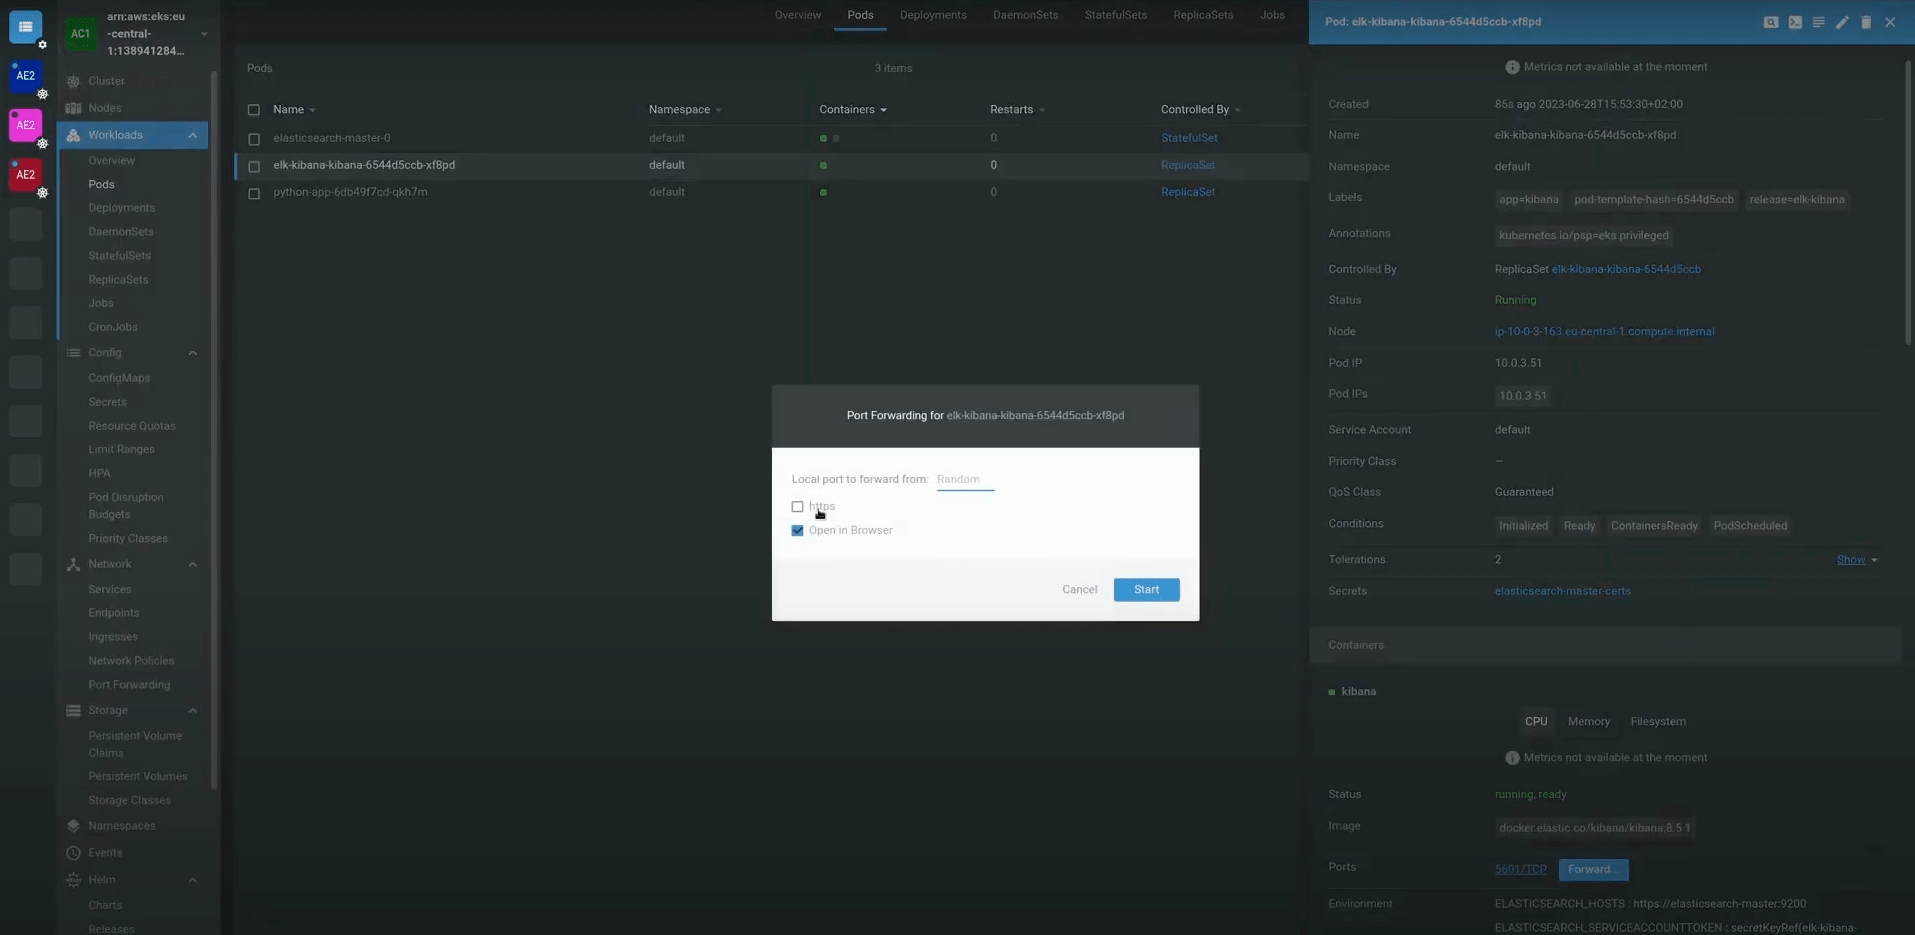
host: "https://elasticsearch-master:9200"helm install kibana -f kibana-values.yaml <chart-name>Check if Kibana is installed correctly, port forward the container’s port to the local network (I am using K8s Lens)

Deploying Logstash and Filebeat
To manage logs effectively, we use Logstash and Filebeat. Filebeat collects records from various sources and Logstash processes and sends them to Elasticsearch.
Deploy Logstash
- Clone repository with configs: logstash-k8s
- Move to tf-modules/eks/manifests/logstash-k8s
- Edit configmap.yaml file
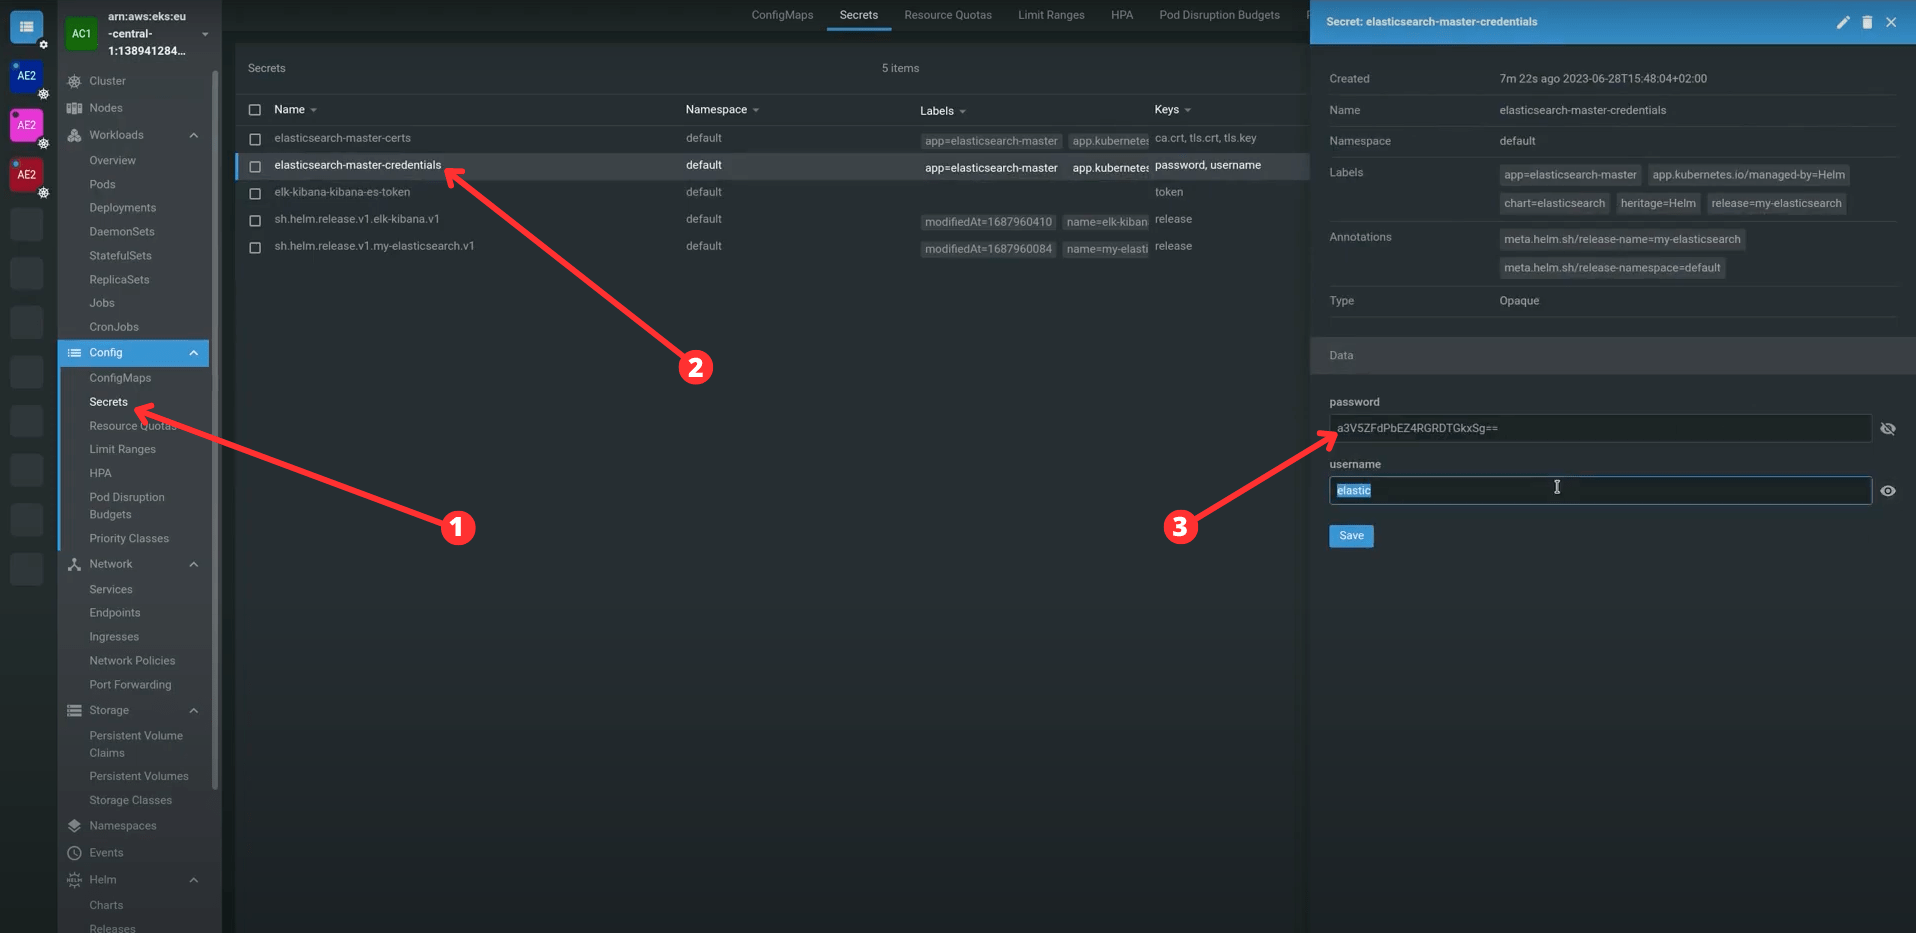
- add elasticsearch host, user and password(you can take them from “Secrets” Kubernetes resource)
- Apply templates:
kubectl apply -f logstash-k8s -n $CHANGE_TO_ELASTIC_NSDeploy Filebeat
- Ensure Filebeat's configuration points to the correct log files on your nodes. Usually, in EKS, it’s the /var/log/containers folder. To check it, log in to one of your nodes and move to the /var/log/containers directory; if there are no files, try to change the directory.
- In case everything is correct, apply Kubernetes templates:
kubectl apply -f filebeat-k8sDeploy a Simple Application to Check How Logs Are Streaming Into Elasticsearch
- Enter the eks/manifests folder from the cloned repository.
- Execute command:
kubeclt apply -f app -n defaultAfter installation is complete, revisit Kibana and create an elasticsearch index.
Creating an index:
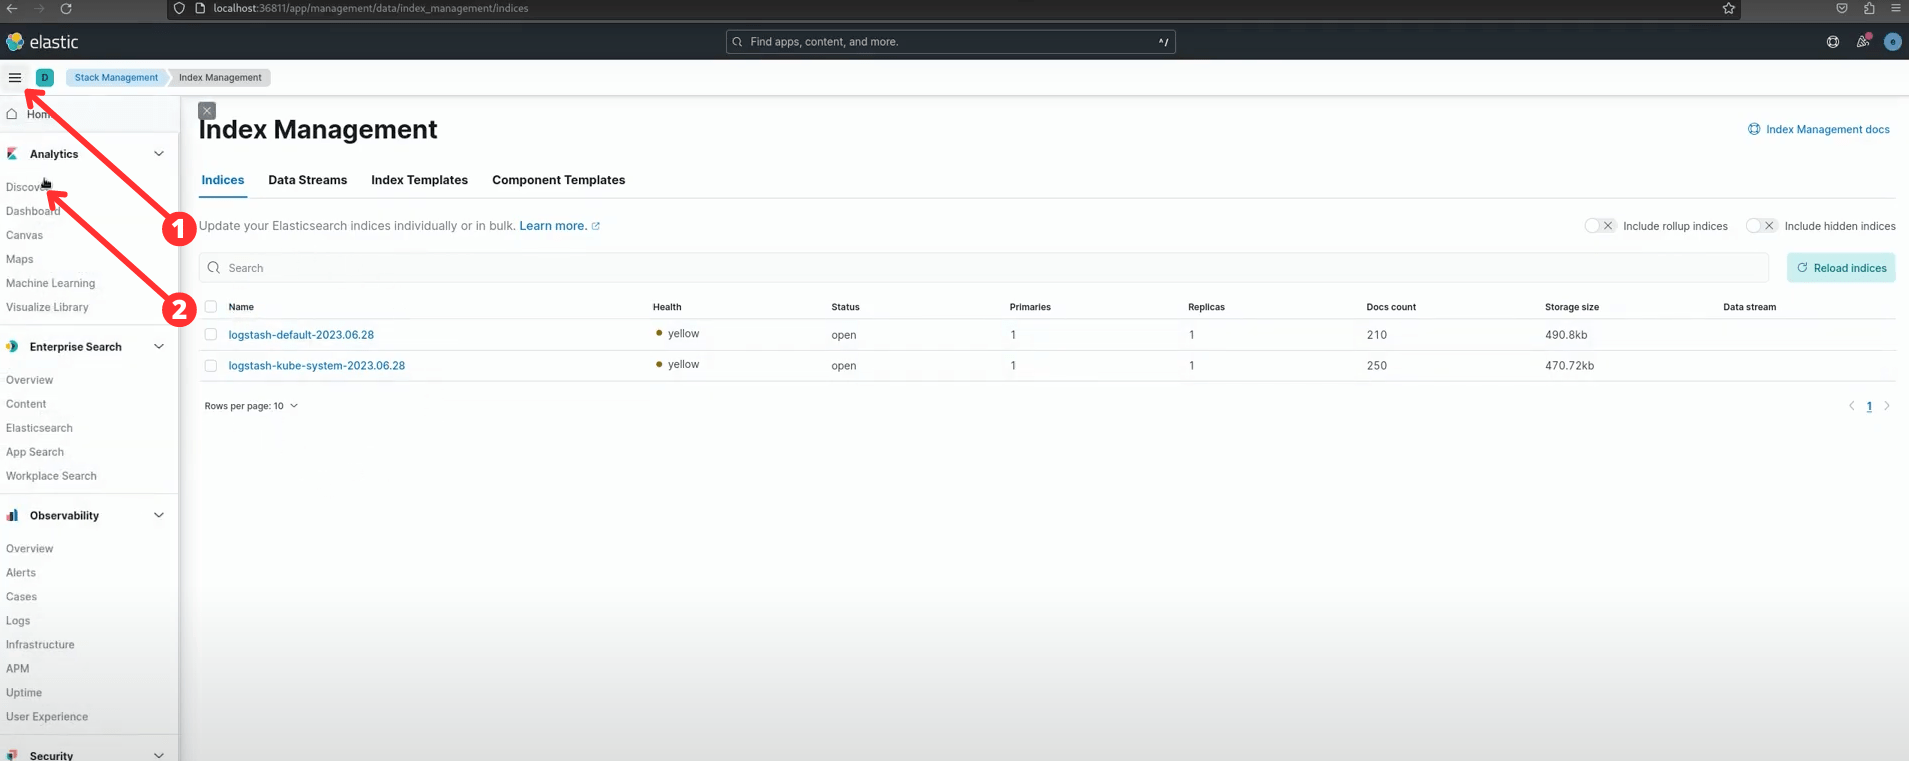
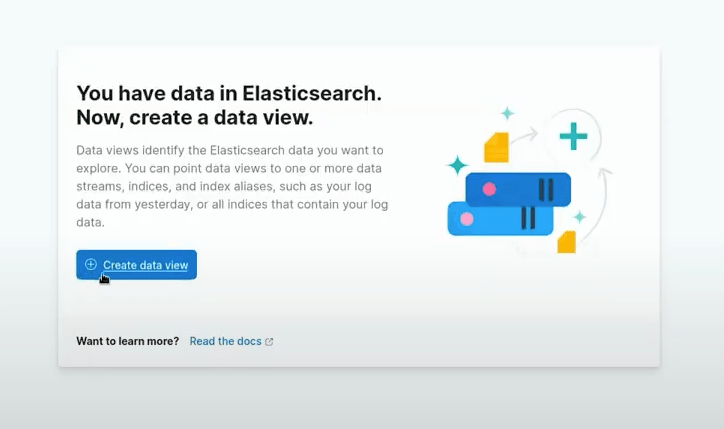
Create logstash index pattern: logstash-[namespace]*
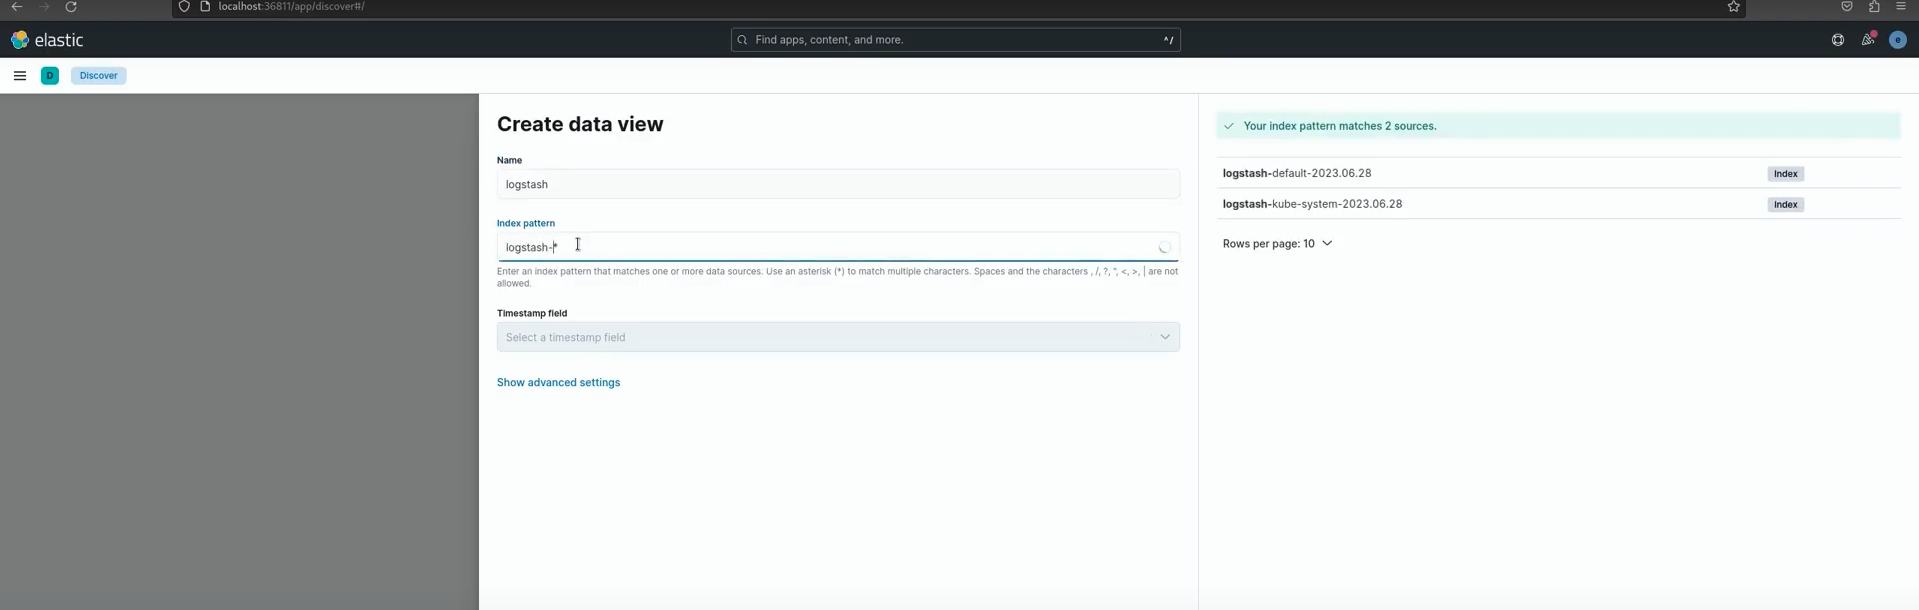
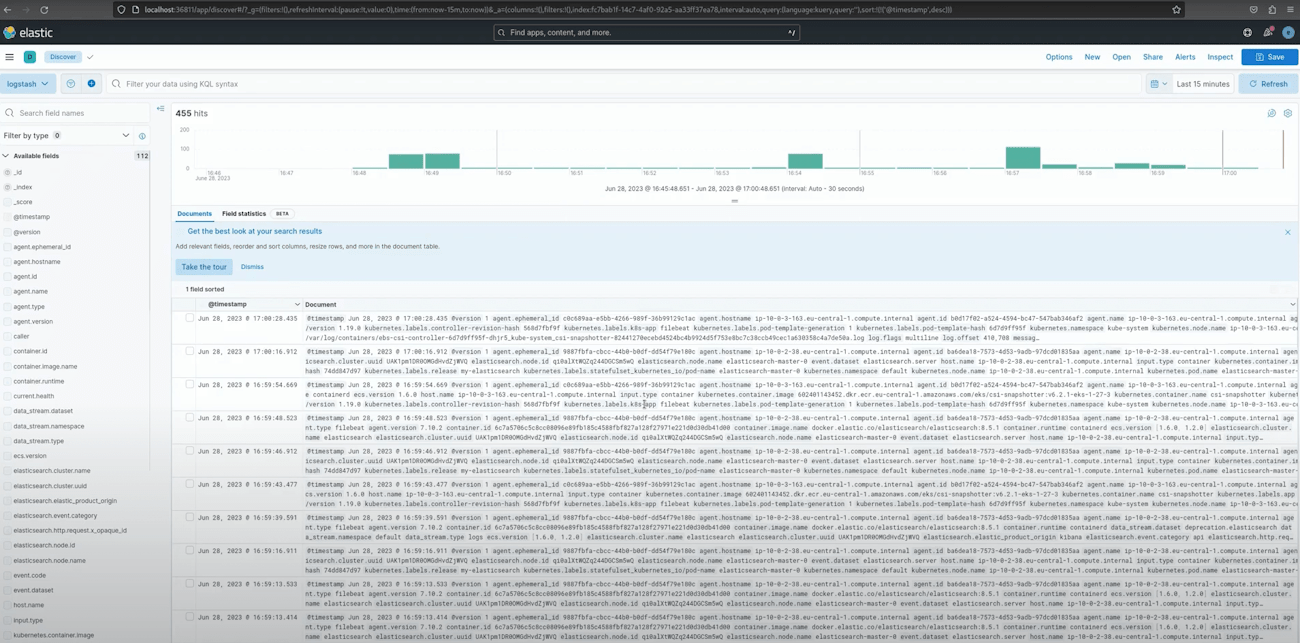
Now, you should see logs from the deployed application. If not, make some requests to this app and try to troubleshoot the issue; refer to the video guide in case help is required.
Conclusion
You've successfully deployed the ELK Stack on Kubernetes, empowering your applications with robust log analysis and data-driven insights. Elasticsearch, Logstash, and Kibana seamlessly handle large data streams and provide meaningful visualizations.
Now that you have a robust logging solution, you can efficiently manage your logs and gain valuable insights. Happy analyzing!
Thank you for reading this guide on deploying the ELK Stack. Feel free to reach out if you have any questions or require further assistance. Happy coding!
Published at DZone with permission of Pavlo Konobeyev. See the original article here.
Opinions expressed by DZone contributors are their own.
Comments