Cluster Logging of Telecom 5G IOT Microservice Pods
Learn how Kibana visualizes data indexed in Elasticsearch log storage for vast 5G Telecom data volumes in the Kubernetes Cloud.
Join the DZone community and get the full member experience.
Join For FreeWhile Kubernetes, the industry standard for container orchestration, offers efficient management, deployment, and scaling capabilities, logging in this environment is not without its challenges. The dynamic and distributed nature of Kubernetes presents unique hurdles in log management. In this complex setting, centralized log management becomes a necessity for understanding and resolving anomalies. This is where Kubernetes Cluster Logging steps in.
Now, let's embark on a journey into the depths of Kubernetes Cluster Logging, a topic that holds the key to efficient management and troubleshooting in the container-based 5G Telecom IoT microservices environment.
Let's dive deep.
Component of Cluster Logging
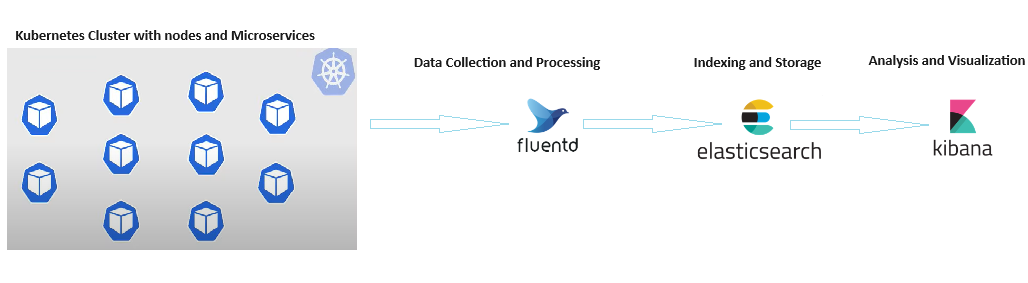
The significant components of Kubernetes cluster logging are:
- Collection (Fluentd) gathers data from the Kubernetes cluster, formats the data, and forwards the data to the log store. The current implementation is fluentd.
- The log store component (Elasticsearch) stores all the data logs. However, the system also allows for forwarding logs to external log stores, giving the power to choose the preferred log storage options. The default Elasticsearch log store is designed and tested for short-term storage, ensuring efficient log management.
- The visualization (Kibana) component is a user-friendly GUI (Graphical User Interface) that provides a comfortable and intuitive experience for viewing logs, graphs, charts, and other data. The current implementation is Kibana, ensuring a user-friendly log viewing experience.
Introduction to Fluentd
What Is Fluentd?
Fluentd, an open-source data collector, is a powerful tool that unifies data collection and consumption. It's designed to enhance data use and understanding, making data management a breeze for Software professionals, Data engineers, and Telecom specialists.
Fluentd, written in Ruby, and scales very well. It's designed to be fast and consumes minimal resources, making it ideal for most small — to large-sized Kubernetes IOT microservices deployments.
Fluentd collects logs from specific sources, converts them into structured data, and then sends them to Elasticsearch. It is highly adaptable to integrations and compatible with various log storage and analytic services.
Why Is Fluentd Important?
Fluentd, with its unique unified logging layer, allows you to use your logs as they are generated. This distinct feature lets you decouple data sources, facilitating quicker iterations for more effective and efficient use. Here are a few reasons Fluentd stands out and should be considered in Kubernetes.
- Fluentd is not only powerful but also incredibly user-friendly: You can set it up in just 10 minutes, and it offers over 500 plug-ins to support your preferred use cases, making it a breeze to work with.
- Free and open source: Use FluentD in Kubernetes without any restrictions. It's flexible, so you can tailor it to the software needs.
- Fluentd has a proven track record of reliability and high performance, making it a dependable choice for data management.
Fluentd in Kubernetes is backed by a vibrant and dedicated community. This community support ensures FluentD's continuous growth, and development and makes the user feel part of a more extensive network, providing you with the necessary support and resources.
"Fluentd is compatible and supports cross-platform data syncing for wide-ranging data compatibility, analysis, and reuse. Additionally, Fluentd offers flexibility, allowing you to consolidate your data by collecting, filtering, buffering, and outputting data logs. Its strength lies in its flexibility and broad community support.
Introduction to Elasticsearch
What Is Elasticsearch?
Elasticsearch is a robust platform that efficiently handles indexing, search, and analysis, allowing for near real-time search and analytics for various data types. It prominently works with documents, inverted indices, shards, replicas, clusters, and nodes. Elasticsearch utilizes external tools to enhance its visualization, storage, monitoring, and data management capabilities.
Why Is Elasticsearch Important?
- Distributed and scalable: Elasticsearch's robust distributed architecture efficiently handles data across multiple nodes in a cluster. This ensures data distribution and fault tolerance and allows for effortless scaling to accommodate growing data volumes.
- Real-time search: Elasticsearch provides lightning-fast real-time search capabilities, ensuring that indexed data is available for search within milliseconds of being indexed. This exceptional speed makes it ideal for applications requiring quick and up-to-date search results.
- Full-text search: Elasticsearch excels in full-text search, enabling users to perform fast and accurate searches across large volumes of text-based data. It supports tokenization, stemming, fuzzy matching, relevance scoring, and highlighting, making it a powerful tool for efficient data retrieval. For IOT Cellular data, the operator user can easily search data based on cellular information like MSISDN (Mobile Station International Subscriber Directory Number) or IMSI (International Mobile Subscriber Identity).
- Document-oriented: Elasticsearch stores and indexes structured and semi-structured data as documents in JSON format. This flexibility allows for efficient indexing and search based on various fields, accommodating diverse data structures seamlessly.
- RESTful API: Elasticsearch's versatile RESTful API empowers developers to interact with the system using a wide range of HTTP methods such as GET, POST, PUT, and DELETE. This provides unparalleled flexibility in system integration and ensures seamless interoperability with other applications.
- Querying and aggregations: Elasticsearch offers a powerful Query DSL (Domain-Specific Language) for constructing complex queries, supporting various query types such as term, match, range, and more. Additionally, it provides aggregations for performing analytics and summarizations on the indexed data, enabling comprehensive data analysis.
Introduction to Kibana
What Is Kibana?
Kibana, a powerful visual interface tool, leverages the log data stored in Elasticsearch Clusters. It enables users to explore, visualize, and construct dashboards over this data, enhancing the data analysis capabilities.
The heart of Kibana lies in its data querying and analysis capabilities. Moreover, Kibana’s versatile visualization features pique your curiosity by offering various ways to visualize data, including heat maps, line graphs, histograms, pie charts, and geospatial support. These features, combined with different search methods, enable you to delve into the data stored in Elasticsearch for root cause diagnostics.
With Kibana, the excitement of understanding big data is within grasp. IoT Developers can swiftly build and share dynamic dashboards that reflect changes to the Elasticsearch query in real time, keeping you engaged and in control.
Why Is Kibana Important?
- Simplify your search: Using Elasticsearch might be familiar, but it can be challenging for the management team. Kibana provides a user-friendly interface that makes accessing data easy for everyone. You can create an index pattern and start making requests against your stored data on Elasticsearch.
- Visualize your data with ease: Understanding how data has changed is crucial for the management team. Kibana showcases your data's progress effectively. Even in the testing phase, you'll find more options than you can imagine.
- Monitor your applications effectively: Kibana excels in log analysis, simplifying the process and eliminating the need to worry about log formatting from the source. With an Application Performance Monitoring server added to the ELK (Elasticsearch, Logstash, and Kibana) stack, you can quickly gather information about your running applications in various languages, technologies, and frameworks.
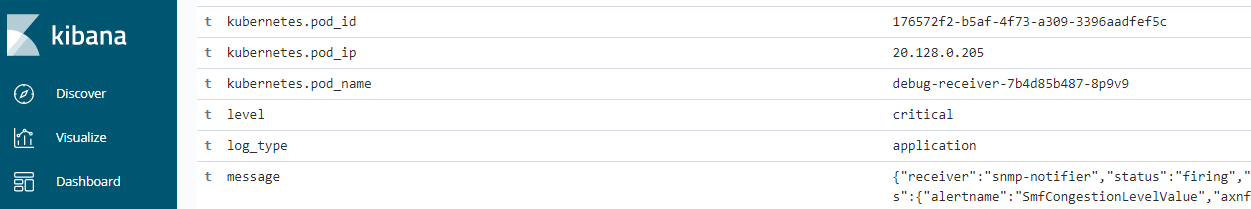
Kibana GUI Sample Visualization for a 5G Iot Network Function Log
The example below underscores the Kibana GUI, alerting us of a critical alert in the 5G IOT Network Function, SMF (Session Management Function).
It explicitly states that the congestion level in the SMF microservice has reached a critical level, and immediate action is imperative to resolve it.
Configuration YAMLs (Yet Another Markup Language)
Deploy Cluster Logging service in the Kubernetes cluster using the configuration below:
  apiVersion: logging.openshift.io/v1
  kind: ClusterLogging
  metadata:
    name: instance
    namespace: openshift-logging
  spec:
    collection:
      logs:
        fluentd:
          resources:
            limits:
              cpu: 1
              memory: 2Gi
            requests:
              cpu: 100m
              memory: 736Mi
        type: fluentd
    curation:
      curator:
        schedule: 30 3 * * *
      type: curator
    logStore:
      elasticsearch:
        nodeCount: 3
        proxy:
          resources:
            limits:
              memory: 512Mi
            requests:
              memory: 512Mi
        redundancyPolicy: SingleRedundancy
        resources:
          limits:
            cpu: 2
            memory: 4Gi
          requests:
            cpu: 1
            memory: 4Gi
        storage:
          size: 50Gi
      retentionPolicy:
        application:
          maxAge: 2d
        audit:
          maxAge: 2d
        infra:
          maxAge: 1d
      type: elasticsearch
    managementState: Managed
    visualization:
      kibana:
        replicas: 1
      type: kibana
Conclusion
In conclusion, it is imperative to establish a robust logging infrastructure to safeguard against data loss and ensure the seamless management of Kubernetes microservices, particularly those associated with 5G Telecom.
Leveraging the power of Fluentd, Elasticsearch, and Kibana tools guarantees uninterrupted operations and extensive control over logs, clusters, and data visualization.
Opinions expressed by DZone contributors are their own.
Comments