Kubernetes Logging With Fluentd and Logz.io
The pace of change in Kubernetes can make it hard to keep up. Let's learn how to log containers with Fluentd and Logz.io.
Join the DZone community and get the full member experience.
Join For FreeKubernetes is developing so rapidly that it has become challenging to stay up to date with the latest changes (Heapster has been deprecated!). The ecosystem around Kubernetes has exploded with new integrations developed by the community, and the field of logging and monitoring is one such example.
The topic of logging containers orchestrated by Kubernetes with the ELK Stack has already been written about extensively both on the Logz.io blog and elsewhere. The most common approach we're seeing now is hooking up Kubernetes with what is increasingly being referred to as the EFK Stack — Elasticsearch, Fluentd and Kibana. Deploying Fluentd as a daemonset, users can spin up a Fluentd pod for each node in their Kubernetes cluster with the correct configurations to forward data to their Elasticsearch deployment.
There are various daemonset configurations available but the one used here to send logs to Logz.io's ELK Stack is based on a daemonset configuration provided by the kind folks at Treasure Data — the company driving the development of Fluentd and Fluent Bit. We've added some basic parsing capabilities on top of this configuration, such as support for multi-line processing for exception stack traces (Java, JS, C#, Python, Go, Ruby, PHP) and parsing the log field as message.
For those new to Kubernetes, steps 1-2 will help you with setting up the demo environment and are most likely superfluous for those with a running Kubernetes cluster. These steps describe setting up Minikube, kubectl, and deploying a basic demo app for generating some simple log data. Putting in place the logging infrastructure is described in subsequent steps.
Step 1: Setting Up Your Kubernetes Development Environment
First, install kubectl, the CLI for running commands against Kubernetes clusters. In this case, I'm installing kubectl's binary on my Mac using cURL:
curl -LO https://storage.googleapis.com/kubernetes-release/release/$(curl -s
https://storage.googleapis.com/kubernetes-release/release/stable.txt)
/bin/darwin/amd64/kubectl
I'm then making the binary executable and moving to my PATH:
chmod +x ./kubectl
sudo mv ./kubectl /usr/local/bin/kubectl
Second, install Minikube.
Minikube enables you to easily run Kubernetes locally as a single-node cluster inside a VM. Be sure to first install a hypervisor (I'm using VirtualBox).
For Mac, you can use this cURL command:
curl -Lo minikube
https://storage.googleapis.com/minikube/releases/v0.28.0/minikube-darwin
-amd64 && chmod +x minikube && sudo mv minikube /usr/local/bin/
Start Minikube with:
minikube startFinally, run the following kubectl command to make sure both kubectl and Minikube were installed correctly and that the former can connect to your Kubernetes cluster:
kubectl cluster-infoYou should be seeing a URL response:
Kubernetes master is running at https://192.168.99.100:8443
KubeDNS is running at
https://192.168.99.100:8443/api/v1/namespaces/kube-system/services/kube-dns:dns/proxy
Our last step is to deploy the Minikube dashboard, a UI that allows you to easily deploy your apps to your Kubernetes cluster, troubleshoot it, and manage the cluster itself along with all the relevant resources.
minikube dashboardThe dashboard opens up in your browser automatically:
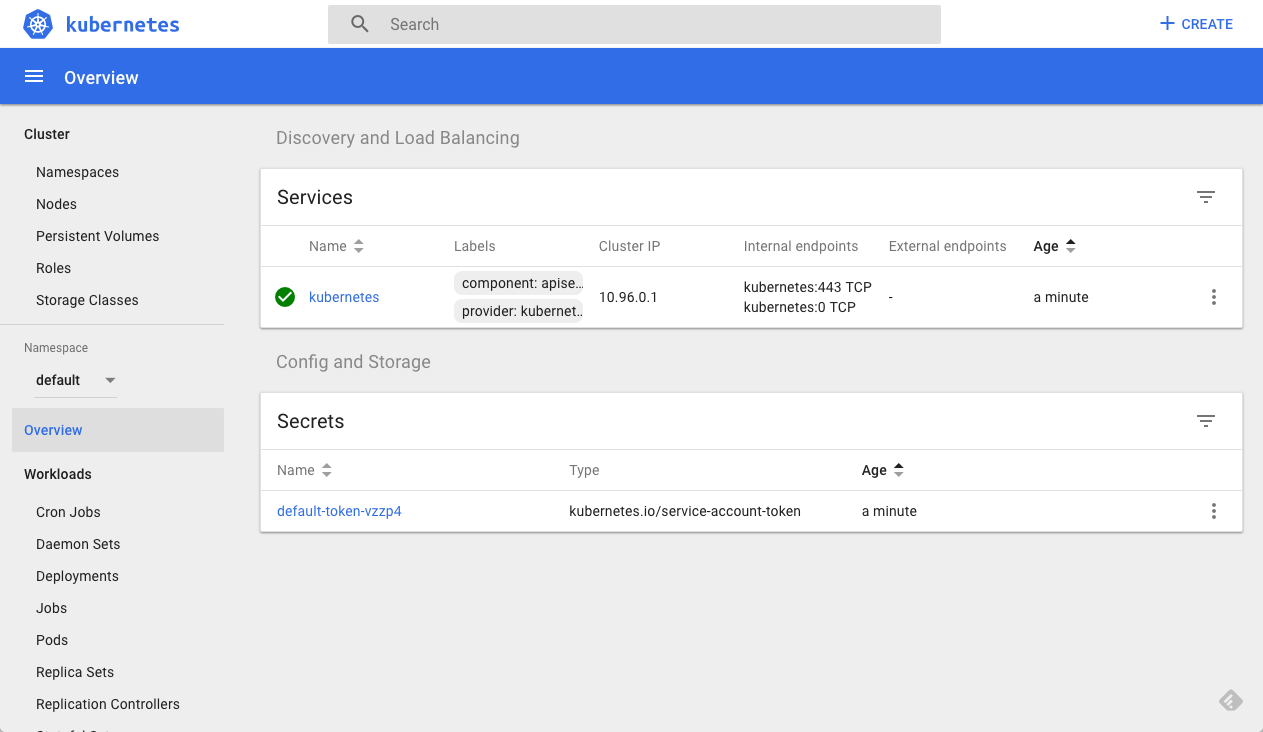
Step 2: Deploying a Demo App Using Minikube
Let's start with deploying a basic demo application on our Kubernetes cluster. For this purpose, I'll use Docker's voting app, a basic app built of five services for handling online voting.
Clone the repo and use the provided specs file to deploy to your Kubernetes cluster:
git clone https://github.com/dockersamples/example-voting-app.git
cd /example-voting-app
kubectl create -f k8s-specifications/

deployment.extensions "db" created
service "db" created
deployment.extensions "redis" created
service "redis" created
deployment.extensions "result" created
service "result" created
deployment.extensions "vote" created
service "vote" created
deployment.extensions "worker" created
After a few minutes, all services, deployments and pods should be up and running, and to access the voting app, simply open your browser using the cluster IP and port 31000:
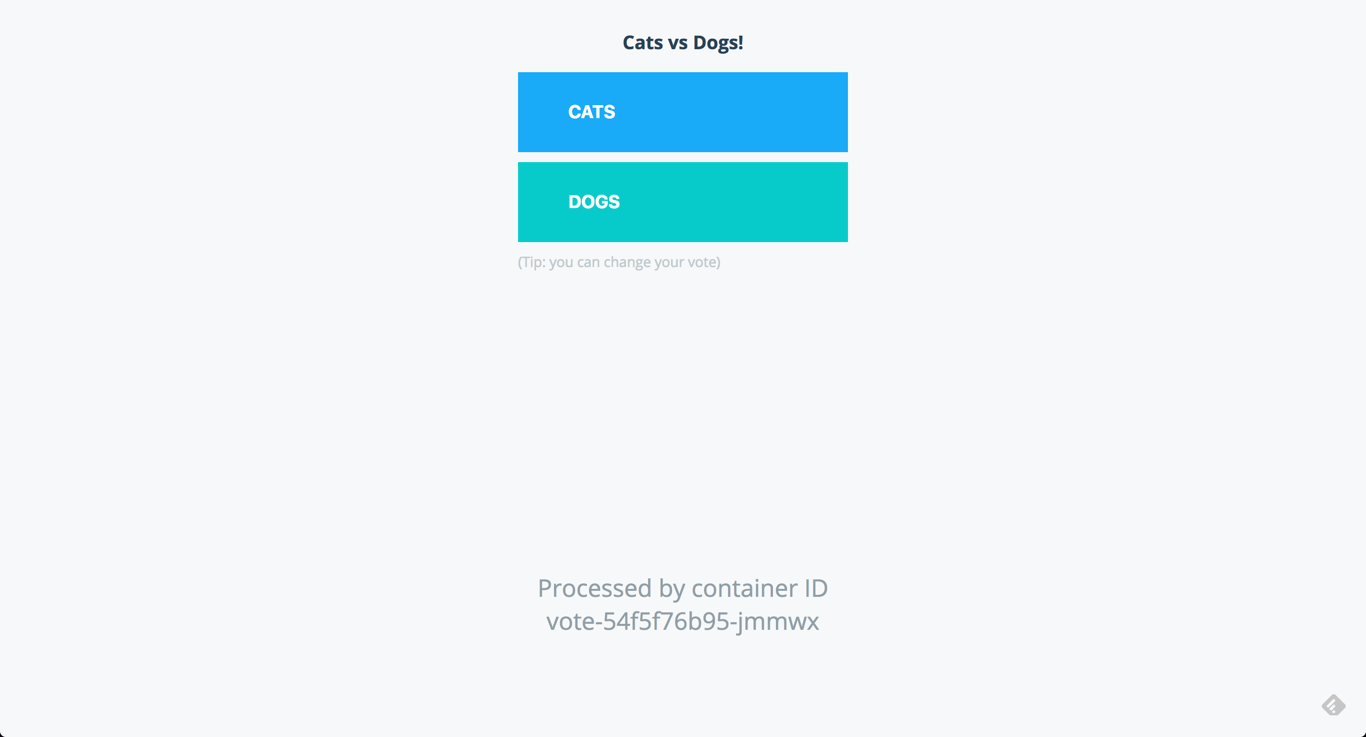
You can review all your pods either using kubectl or the dashboard:
kubectl get pods

NAME                      READY     STATUS    RESTARTS   AGE
db-86b99d968f-fkxqg       1/1       Running   0          15m
redis-659469b86b-gtkpx    1/1       Running   0          15m
result-59f4f867b8-6ntrg   1/1       Running   0          15m
vote-54f5f76b95-jmmwx     1/1       Running   0          15m
worker-56578c48f8-ljqph   1/1       Running   0          15m
Step 3: Creating a Fluentd Daemonset
As mentioned above, the method we're going to use for hooking up our development cluster with Logz.io involves deploying a Fluentd as a daemonset. A close look at the YAML reveals that with a few tweaks to the environment variables, the same daemonset can be used to ship logs to your own ELK deployment as well.
Create a new daemonset configuration file:
sudo vim daemonset.yamlUse this configuration, and be sure to enter your Logz.io account token in the environment variables section:
apiVersion: extensions/v1beta1
kind: DaemonSet
metadata:
  name: fluentd-logzio
  namespace: kube-system
  labels:
    k8s-app: fluentd-logzio
    version: v1
    kubernetes.io/cluster-service: "true"
spec:
  template:
    metadata:
      labels:
        k8s-app: fluentd-logzio
        version: v1
        kubernetes.io/cluster-service: "true"
    spec:
      tolerations:
      - key: node-role.kubernetes.io/master
        effect: NoSchedule
      containers:
      - name: fluentd
        image: logzio/logzio-k8s:1.0.0
        env:
          - name:  LOGZIO_TOKEN
            value: "your logz.io account token"
          - name:  LOGZIO_URL
            value: "your logz.io host url" ##example:https://listener.logz.io:8071
        resources:
          limits:
            memory: 200Mi
          requests:
            cpu: 100m
            memory: 200Mi
        volumeMounts:
        - name: varlog
          mountPath: /var/log
        - name: varlibdockercontainers
          mountPath: /var/lib/docker/containers
    readOnly: true
      terminationGracePeriodSeconds: 30
      volumes:
      - name: varlog
        hostPath:
          path: /var/log
      - name: varlibdockercontainers
        hostPath:
          path: /var/lib/docker/containers
Create the Daemonset with:
kubectl create -f daemonset.yamlYou can, of course, use the dashboard as well for the same purpose. In any case, after a minute or two you will see a new pod deployed:
kubectl get pods

NAME                      READY     STATUS              RESTARTS   AGE
db-86b99d968f-fkxqg       1/1       Running             0          22m
fluentd-d7fc2             1/1       Running             0          1m
redis-659469b86b-gtkpx    1/1       Running             0          22m
result-59f4f867b8-6ntrg   1/1       Running             0          22m
vote-54f5f76b95-jmmwx     1/1       Running             0          22m
worker-56578c48f8-ljqph   1/1       Running             0          22m
In Logz.io, you will begin to see log data being generated by your Kubernetes cluster:
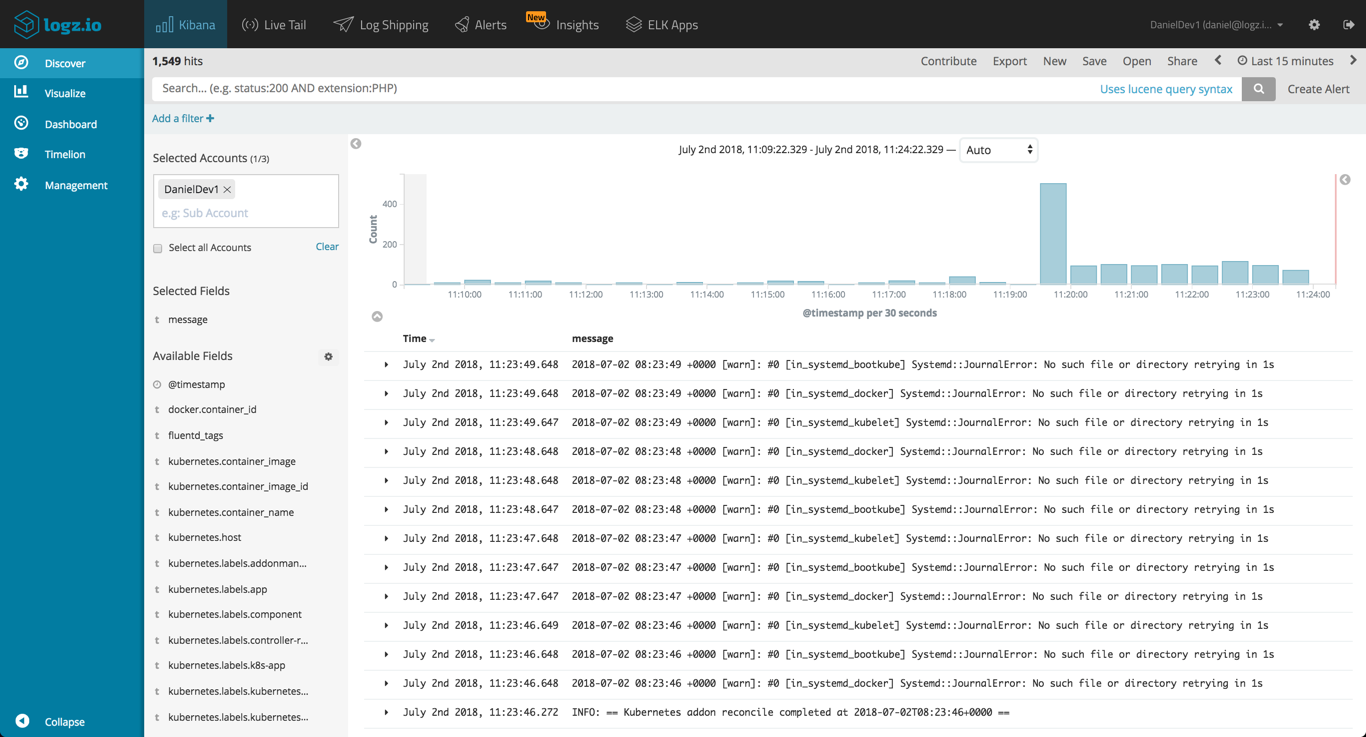
Step 4: Visualizing Kubernetes Logs in Kibana
As mentioned above, the image used by this daemonset knows how to handle exceptions for a variety of applications, but Fluentd is extremely flexible and can be configured to break up your log messages in any way and fashion you like depending on the type of logs being collected.
Also worthy of note is that this Fluentd image adds useful Kubernetes metadata to the logs which can come in handy in larger environments consisting of multiple nodes and pods. Below are a few examples of how you can leverage this metadata to gain visibility into your Kubernetes cluster with Kibana visualizations.
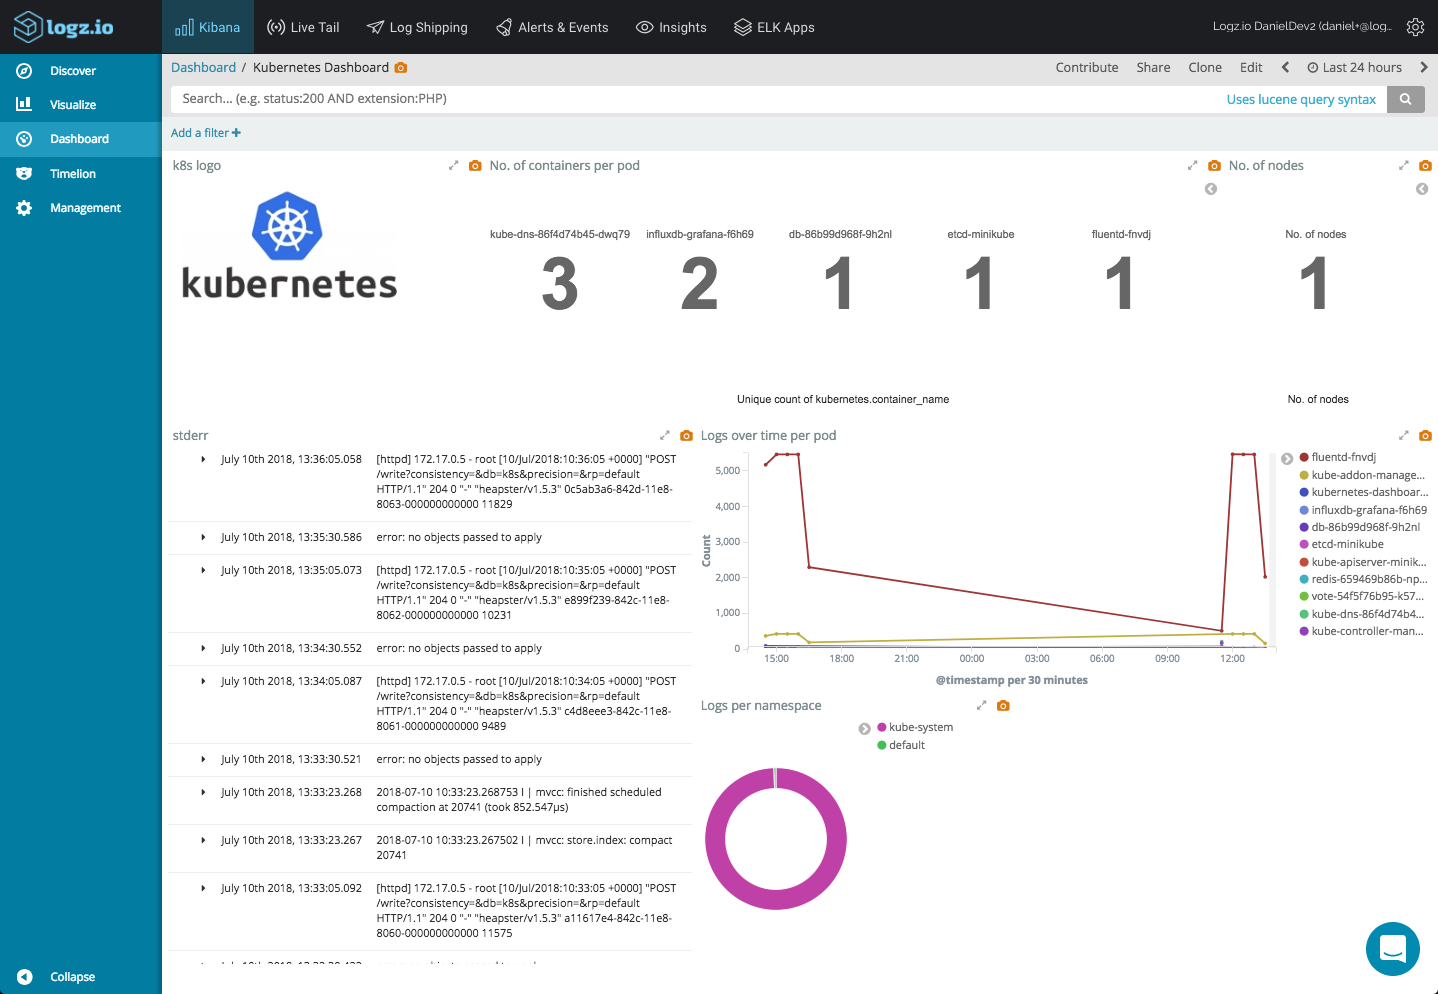
Metric visualizations are simple and are great for displaying simple stats related to your setup. For example, you can use a unique count aggregation of the kubernetes.container_name field to see how many containers you've got running in each pod.
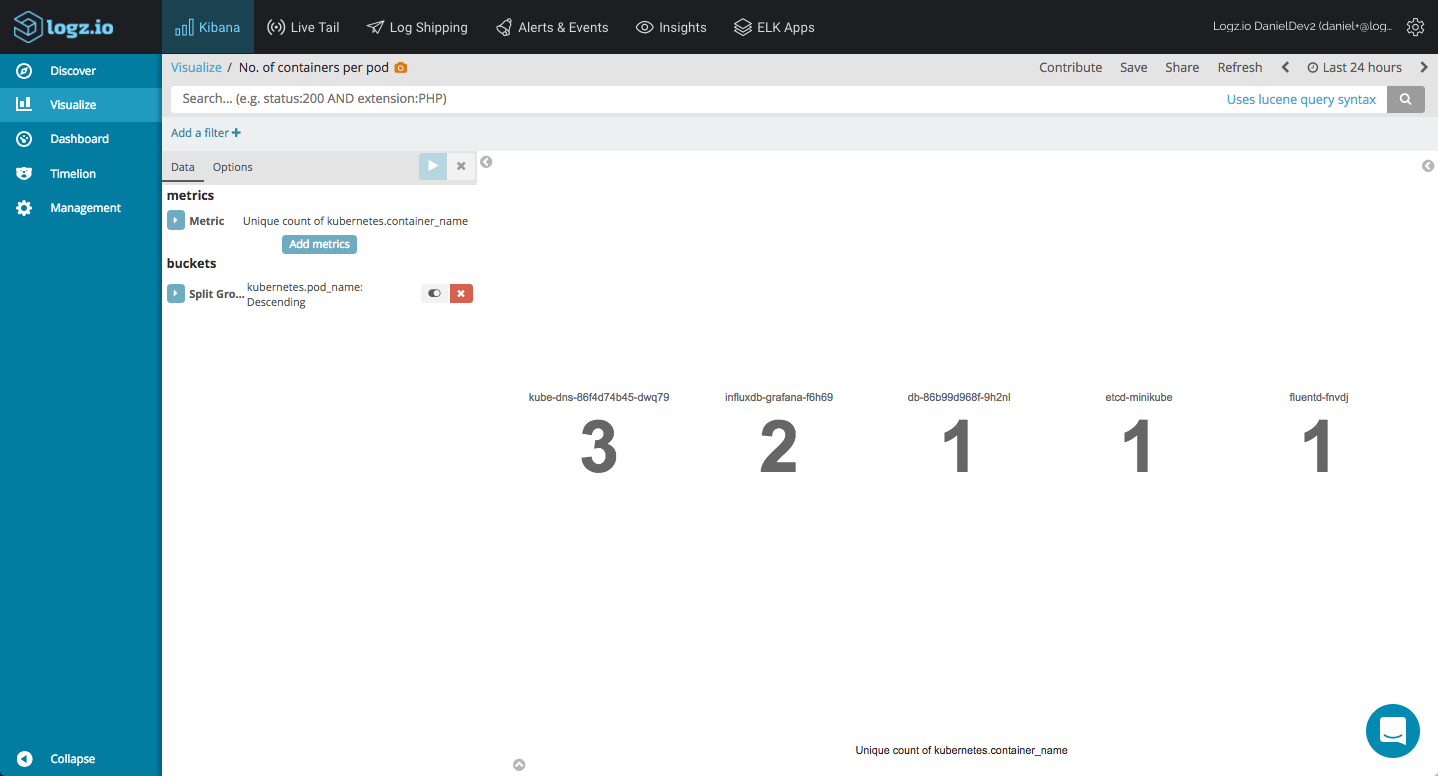
You can do the same of course for the number of nodes running in your cluster.
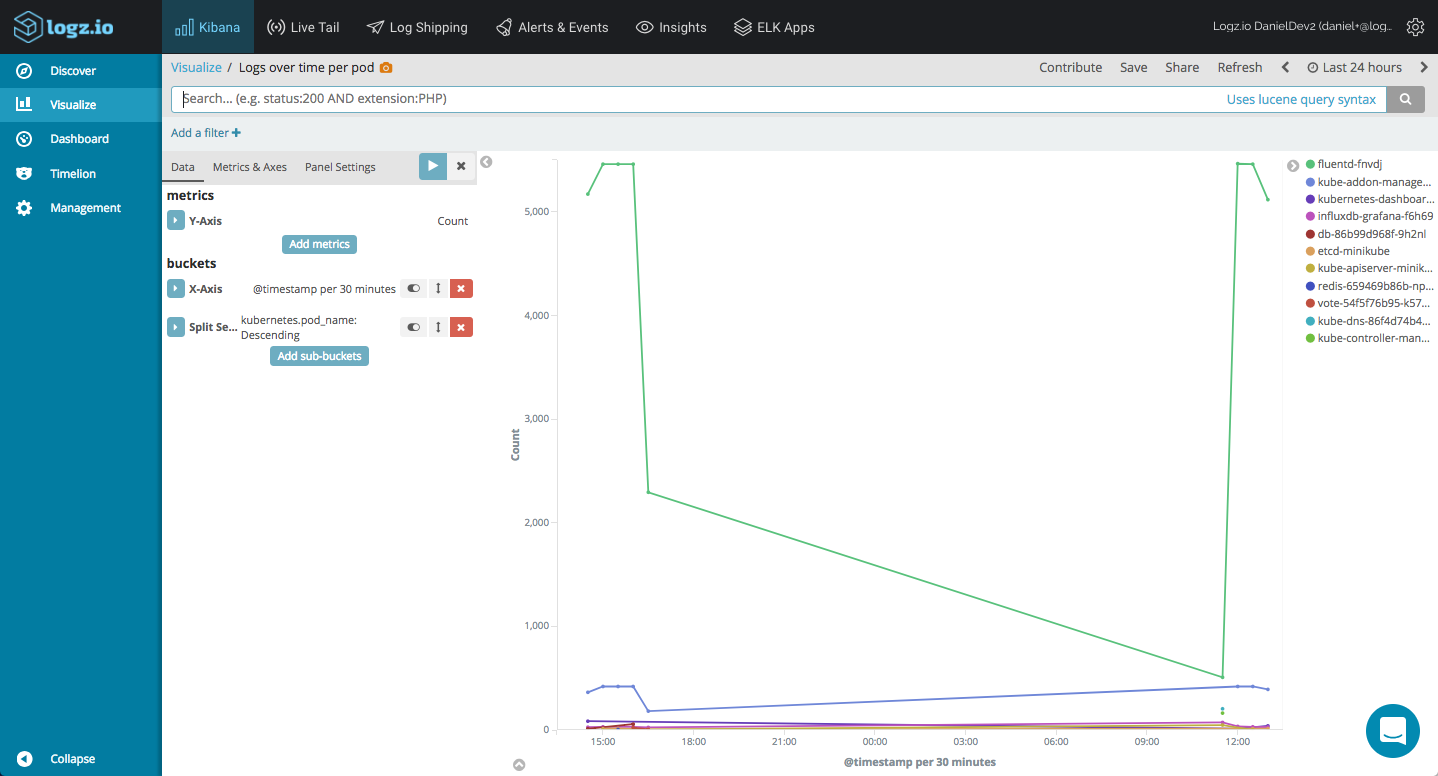
Using line charts and a combination of count aggregations together with time histograms, we can get a nice picture of the logging pipeline in our cluster:
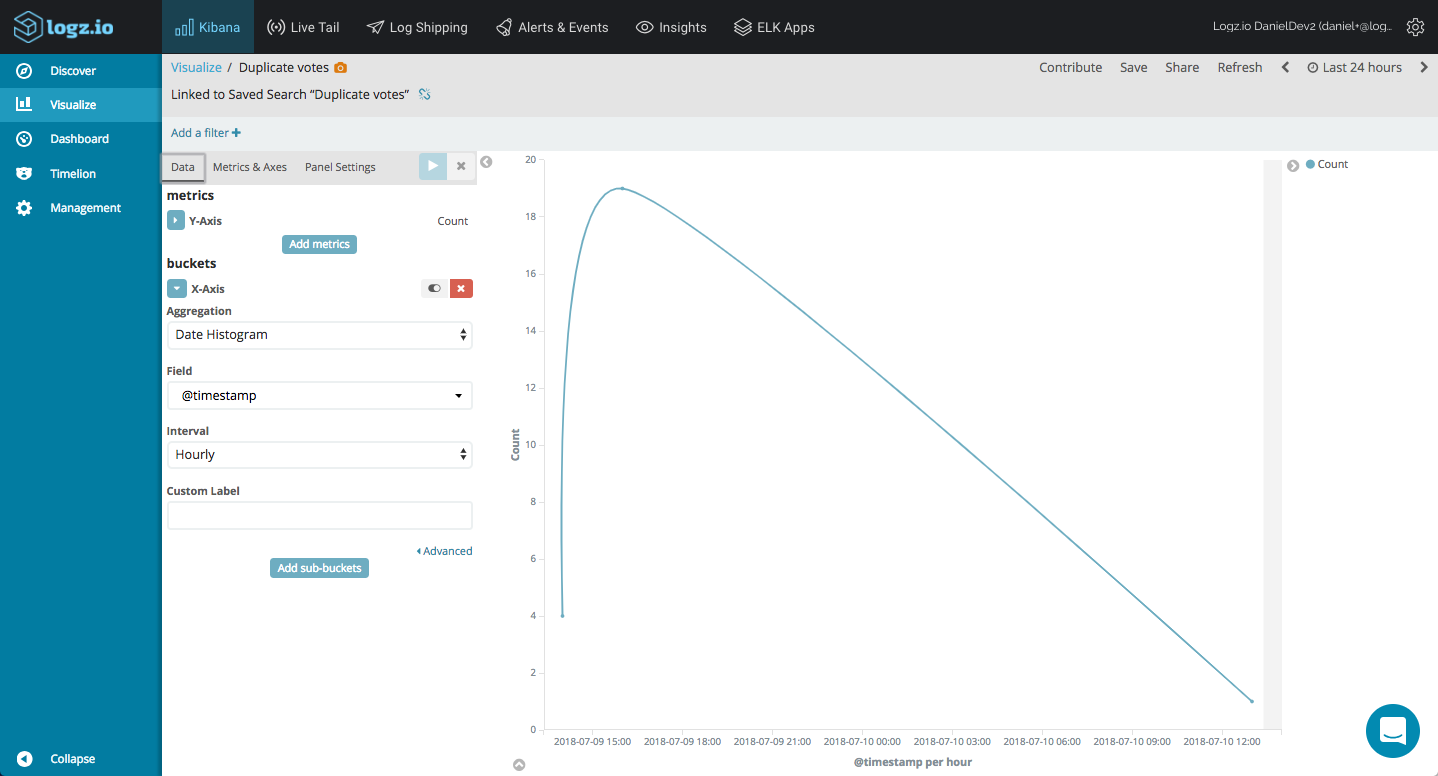
Monitoring the stderr output for error messages reporting, I can create a basic line chart showing me duplicate votes in our voting app:
We can add all these into a dashboard to get a nice overview of our Kubernetes cluster:
The EFK stack (Elasticsearch, Fluentd, and Kibana) is probably the most popular method for centrally logging Kubernetes deployments. In fact, many would consider it a de-facto standard. The combination of an easily deployable and versatile log aggregator, a high-performing data store and a rich visualization tool is a powerful solution.
Of course, the log data generated by a single-node cluster deployed with Minikube on Mac does not do justice to the full potential of the stack - the visualizations above are simple examples and you can slice and dice your Kubernetes logs in any way you want.
We are always looking to improve, so we'd love for you guys to try out this daemonset and give us your feedback .
Published at DZone with permission of Daniel Berman. See the original article here.
Opinions expressed by DZone contributors are their own.
Comments