Host Hack Attempt Detection Using ELK
Learn how using ELK to detect host hack attempts is an effective approach to enhance the security posture of an organization.
Join the DZone community and get the full member experience.
Join For FreeWhat Is SIEM?
SIEM stands for Security Information and Event Management. It is a software solution that provides real-time analysis of security alerts generated by network hardware and applications. SIEM collects log data from multiple sources such as network devices, servers, and applications, then correlates and analyzes this data to identify security threats.
SIEM can help organizations improve their security posture by providing a centralized view of security events across the entire IT infrastructure. It allows security analysts to quickly identify and respond to security incidents and provides detailed reports for compliance purposes.
Some of the key features of SIEM solutions include:
- Log collection and analysis
- Real-time event correlation and alerting
- User and entity behavior analytics
- Threat intelligence integration
- Compliance reporting
SIEM is often used in conjunction with other security solutions, such as firewalls, intrusion detection systems, and antivirus software, to provide comprehensive security monitoring and incident response capabilities.
What Is ELK?
ELK is an acronym for a set of open-source software tools used for log management and analysis: Elasticsearch, Logstash, and Kibana.
Elasticsearch is a distributed search and analytics engine that provides fast search and efficient storage of large volumes of data. It is designed to be scalable and can handle a large number of queries and indexing operations in real-time.
Logstash is a data collection and processing tool that allows you to collect logs and other data from multiple sources, such as log files, syslog, and other data sources, and transform and enrich the data before sending it to Elasticsearch.
Kibana is a web-based user interface that allows you to visualize and analyze data stored in Elasticsearch. It provides a range of interactive visualizations, such as line graphs, bar charts, and heatmaps, as well as features such as dashboards and alerts.
Together, these three tools form a powerful platform for managing and analyzing logs and other types of data, commonly referred to as the ELK stack or Elastic stack. The ELK stack is widely used in IT operations, security monitoring, and business analytics to gain insights from large amounts of data.
Ingesting SIEM Data to ELK
Ingesting SIEM data into the ELK stack can be useful for organizations that want to combine the security event management capabilities of SIEM with the log management and analysis features of ELK.
Here are the high-level steps to ingest SIEM data into ELK:
- Configure the SIEM to send log data to Logstash, which is part of the ELK stack.
- Create a Logstash configuration file that defines the input, filters, and output for the SIEM data.
- Start Logstash and verify that it is receiving and processing SIEM data correctly.
- Configure Elasticsearch to receive and store the SIEM data.
- Create Kibana visualizations and dashboards to display the SIEM data.
Here is an example of a Logstash configuration file that receives Syslog messages from a SIEM and sends them to Elasticsearch:
	input {
	  syslog {
	    type => "syslog"
	    port => 5514
	  }
	}
	filter {
	  if [type] == "syslog" {
	    grok {
	      match => { "message" => "%{SYSLOGTIMESTAMP:syslog_timestamp} %{SYSLOGHOST:syslog_hostname} %{DATA:syslog_program}(?:\[%{POSINT:syslog_pid}\])?: %{GREEDYDATA:syslog_message}" }
	      add_field => [ "received_at", "%{@timestamp}" ]
	      add_field => [ "received_from", "%{host}" ]
	    }
	  }
	}

	output {
	  elasticsearch {
	    hosts => ["localhost:9200"]
	    index => "siem"
	  }
}
Once Logstash is configured and running, SIEM data will be ingested into Elasticsearch and can be visualized and analyzed in Kibana. It's important to ensure that the appropriate security measures are in place to protect the SIEM and ELK environments, and to monitor and alert on any security events.
Detecting Host Hack Attempt
Detecting host hack attempts using SIEM in ELK involves monitoring and analyzing system logs and network traffic to identify suspicious activity that may indicate a hack attempt. Here are the high-level steps to set up host hack attempt detection using SIEM in ELK:
- Configure the hosts to send system logs and network traffic to a centralized log collection system.
- Set up Logstash to receive and parse the logs and network traffic data from the hosts.
- Configure Elasticsearch to store the parsed log data.
- Use Kibana to analyze the log data and create dashboards and alerts to identify potential hack attempts.
Here are some specific techniques that can be used to detect host hack attempts:
- Monitor for failed login attempts: Look for repeated failed login attempts from a single IP address, which may indicate a brute-force attack. Use Logstash to parse the system logs for failed login events and create a Kibana dashboard or alert to monitor for excessive failed login attempts.
- Monitor for suspicious network traffic: Look for network traffic to or from known malicious IP addresses or domains. Use Logstash to parse network traffic data and create a Kibana dashboard or alert to monitor for suspicious traffic patterns.
- Monitor for file system changes: Look for unauthorized changes to system files or settings. Use Logstash to parse file system change events and create a Kibana dashboard or alert to monitor for unauthorized changes.
- Monitor for suspicious process activity: Look for processes that are running with elevated privileges or that are performing unusual actions. Use Logstash to parse process events and create a Kibana dashboard or alert to monitor for suspicious process activity.
By implementing these techniques and regularly monitoring the logs and network traffic, organizations can improve their ability to detect and respond to host hack attempts using SIEM in ELK.
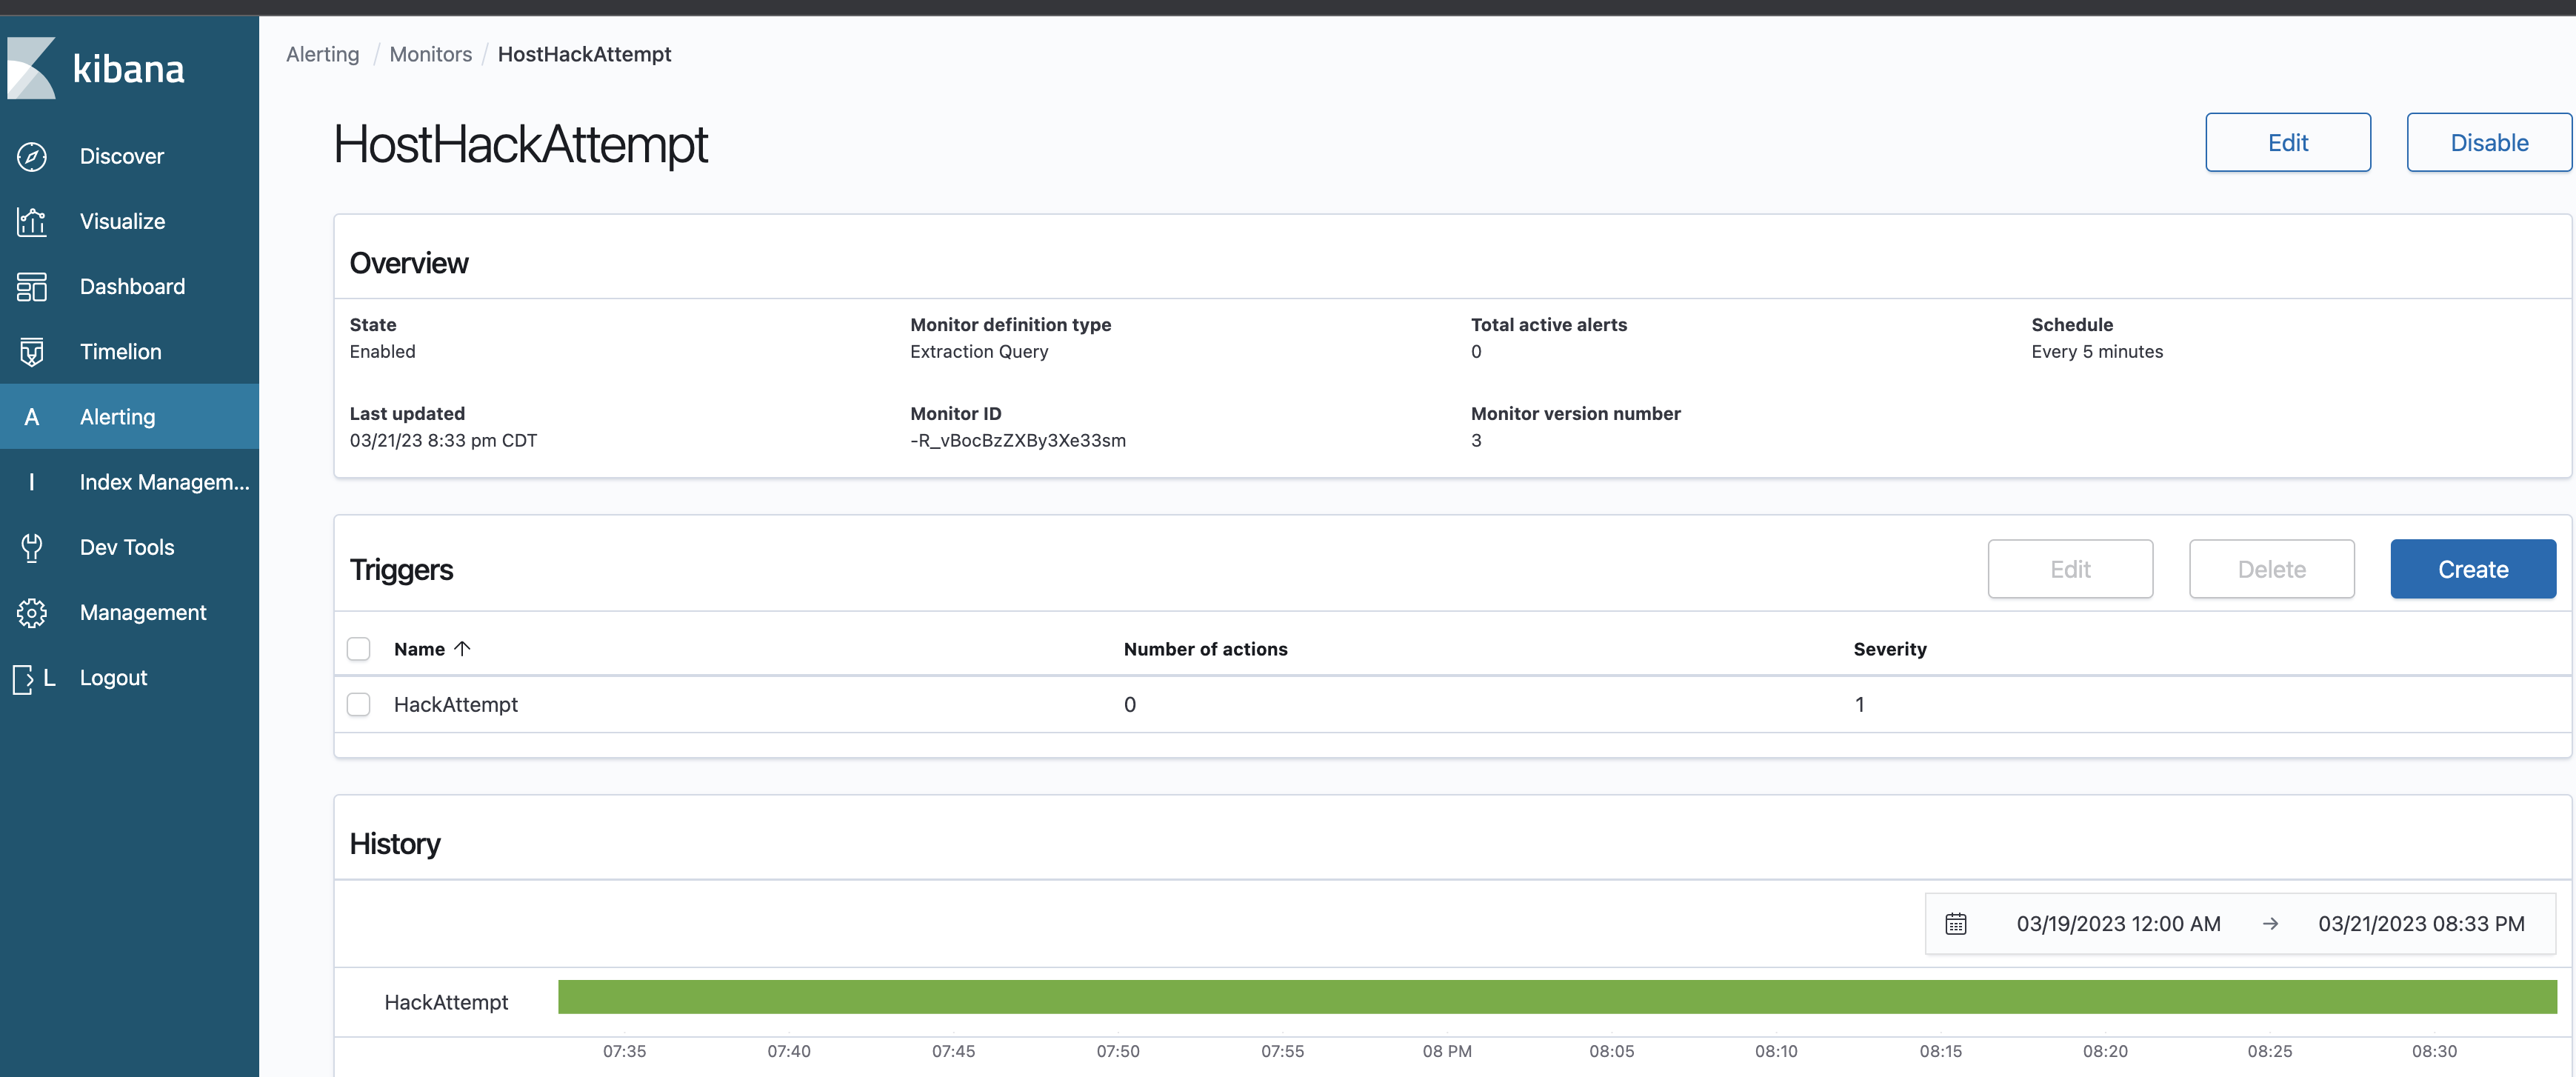
Configure Alert in ELK to Detect Host Hack Attempt
To configure an alert in ELK to detect a host hack attempt, you can follow these general steps:
- Create a search query in Kibana that filters logs for Host Hack Attempt events. For example, you can use the following search query to detect failed login attempts:
from elasticsearch import Elasticsearch

es = Elasticsearch()

search_query = {
  "query": {
    "bool": {
      "must": [
        {
          "match": {
            "event.dataset": "auth"
          }
        },
        {
          "match": {
            "event.action": "failed_login"
          }
        }
      ]
    }
  }
}

res = es.search(index="siem", body=search_query)

for hit in res['hits']['hits']:
    print(hit['_source'])
- Once you have created your search query, save it as a Kibana saved search.
- Go to the Kibana Alerts and Actions interface and create a new alert. Choose the saved search you created in step 2 as the basis for the alert.
- Configure the alert to trigger when a certain threshold is met. For example, you can configure the alert to trigger when there are more than 5 failed login attempts within a 5-minute window.
- Configure the alert to send a notification, such as an email or Slack message, when it triggers.
- Test the alert to ensure that it is working as expected.
Once the alert is configured, it will automatically trigger when it detects a Host Hack Attempt event, such as a failed login attempt. This can help organizations detect and respond to security threats efficiently and effectively. It is important to regularly review and update your alerts to ensure they are detecting the most relevant and important security events.
Conclusion
Using ELK to detect host hack attempts is an effective approach to enhance the security posture of an organization. ELK provides a powerful combination of log collection, parsing, storage, analysis, and alerting capabilities, which enable organizations to detect and respond to host hack attempts in real-time.
By monitoring system logs and network traffic, and using advanced search queries and alerting mechanisms, ELK can help organizations detect a wide range of host hack attempts, including failed login attempts, suspicious network traffic, file system changes, and suspicious process activity.
Implementing a robust host hack attempt detection strategy using ELK requires careful planning, configuration, and testing. However, with the right expertise and tools, organizations can create a comprehensive security monitoring system that provides real-time visibility into their network, improves incident response times, and helps prevent security breaches before they occur.
Opinions expressed by DZone contributors are their own.
Comments