How to Generate Flame Graphs in Java
This article describes generating flame graphs in Java, discusses options, and in which use cases we could take advantage of it.
Join the DZone community and get the full member experience.
Join For FreeFlame graphs became the de facto standard for investigating issues in today's applications (not only written in Java). The flame graphs can provide a lot of interesting insights and can give developers valuable hints to improve the execution of their applications. However, still, a lot of developers don't use them, even if generating flame graphs is easier than ever before.
In this article, I will demonstrate a couple of examples of how easy it is in Java to get started with the investigation of your applications. If you don't know the details about flame graph visualization, please, visit a great article about flame graphs from Brendan Gregg.
Let's Get Started With Jeffrey CLI
I'll be using the Jeffrey CLI (Command-Line Interface) tool for generating a flame graph. It's a pretty new and easy-to-use tool for your terminal that accepts JFR (JDK Flight Recorder) recordings and generates flame graphs from events stored inside the binary files.
Jeffrey takes the JFR file and generates the graphs and data included into a single HTML file, therefore, you have a very convenient way to share it with your colleagues.
For the sake of completeness, I need to mention that there is also Jeffrey App. It's a web-based solution with a running Java backend serving data dynamically and containing some other interesting features over the Jeffrey CLI tool. However, let's focus just on generation flame graphs today.
There are some limitations over the server-based solution Jeffrey App coming from the "static nature" of the generated file. Jeffrey App dynamically generates data on the server behind the scenes. The features below are not available in the CLI solution. However, there are some mitigations of these shortcomings:
- Dynamic searching in the time series graph is not provided. We can use the CLI parameter to split the time series graph at the time of executing the command.
- Zooming of the time series graph is not propagated to the flame graph.
If you never heard about JFR recordings, then let's start with a brief introduction. JFR stands for JDK Flight Recorder and it's a built-in feature for collecting events from your JVM and Java application in OpenJDK builds. It generates optimized binary files with all the collected events + metadata to correctly parse the events from the file. At the time of writing this article, there are two common ways to generate this binary file:
- Enabling the feature directly in the JVM (User Guide for JDK Flight Recorder)
- Using Async Profiler that can replace some events with their own (setup of Async-Profiler)
The generated binary file from whichever approach has absolutely the same structure and can be processed by Jeffrey CLI.
Download and Startup
The most straightforward way is to download it directly from GitHub.
I'll be using pre-generated recordings from Jeffrey's Test Application. Check out the recordings and copy the jeffrey-cli.jar to the same folder to make easier and shorter commands. The recordings from the GitHub repository above were generated using AsyncProfile which uses its own CPU (jdk.ExecutionSample) and Allocation (jdk.ObjectAllocationInNewTLAB) events and these events will be used in our examples below.
jeffrey-cli.jar is just an executable jar file that executes basic commands with some arguments to specify the behavior.
According to HELP command, at the time of writing this blog post, we can generate flame graphs, sub-second graphs, and their differential graphs (comparison between the same event types from JFR recordings). Let's focus just on flame graphs in this article.
$ java -jar jeffrey-cli.jar --help
Usage:  [-hV] [COMMAND]
Generates a flamegraph according to the selected event-type
  -h, --help      Show this help message and exit.
  -V, --version   Print version information and exit.
Commands:
  flame            Generates a Flamegraph (default: jdk.ExecutionSample)
  flame-diff       Generates a Differential Flamegraph (default: jdk.ExecutionSample)
  events           List all event-types containing a stacktrace for building a flamegraph
  sub-second       Generates Sub-Second graph (the first 5 minutes)
  sub-second-diff  Generates Differential Sub-Second graph (the first 5 minutes)
Flame Graph With a Default Event Type
There are multiple arguments to clarify the generated output, let's focus on the main ones. Execute flame --help command to show the information below.
$ java -jar jeffrey-cli.jar flame --help
Usage: flame [-htVw] [--with-timeseries] [-e=<eventType>] [--end-time=<endTime>] [-o=<outputFile>] [-s=<searchPattern>] [--start-time=<startTime>] <jfr_file>
Generates a Flamegraph (default: jdk.ExecutionSample)
<jfr_file> one JFR file for fetching events
-e, --event-type=<eventType>
Selects events for generating a flamegraph (e.g. jdk.ExecutionSample)
--end-time=<endTime> Relative end in milliseconds from the beginning of the JFR file
-h, --help Show this help message and exit.
-o, --output=<outputFile> Path to the file with the generated flamegraph (default is the current folder with a filename '<jfr-name>.html')
-s, --search-pattern=<searchPattern>
Only for timeseries (timeseries cannot dynamically searches in the generated file, only the flamegraph can)
--start-time=<startTime>
Relative start in milliseconds from the beginning of the JFR file
-t, --thread Groups stacktraces omitted on the particular thread
-V, --version Print version information and exit.
-w, --weight Uses event's weight instead of # of samples (currently supported: jdk.ObjectAllocationSample, jdk.ObjectAllocationInNewTLAB, jdk.
ObjectAllocationOutsideTLAB, jdk.ThreadPark, jdk.JavaMonitorWait, jdk.JavaMonitorEnter)
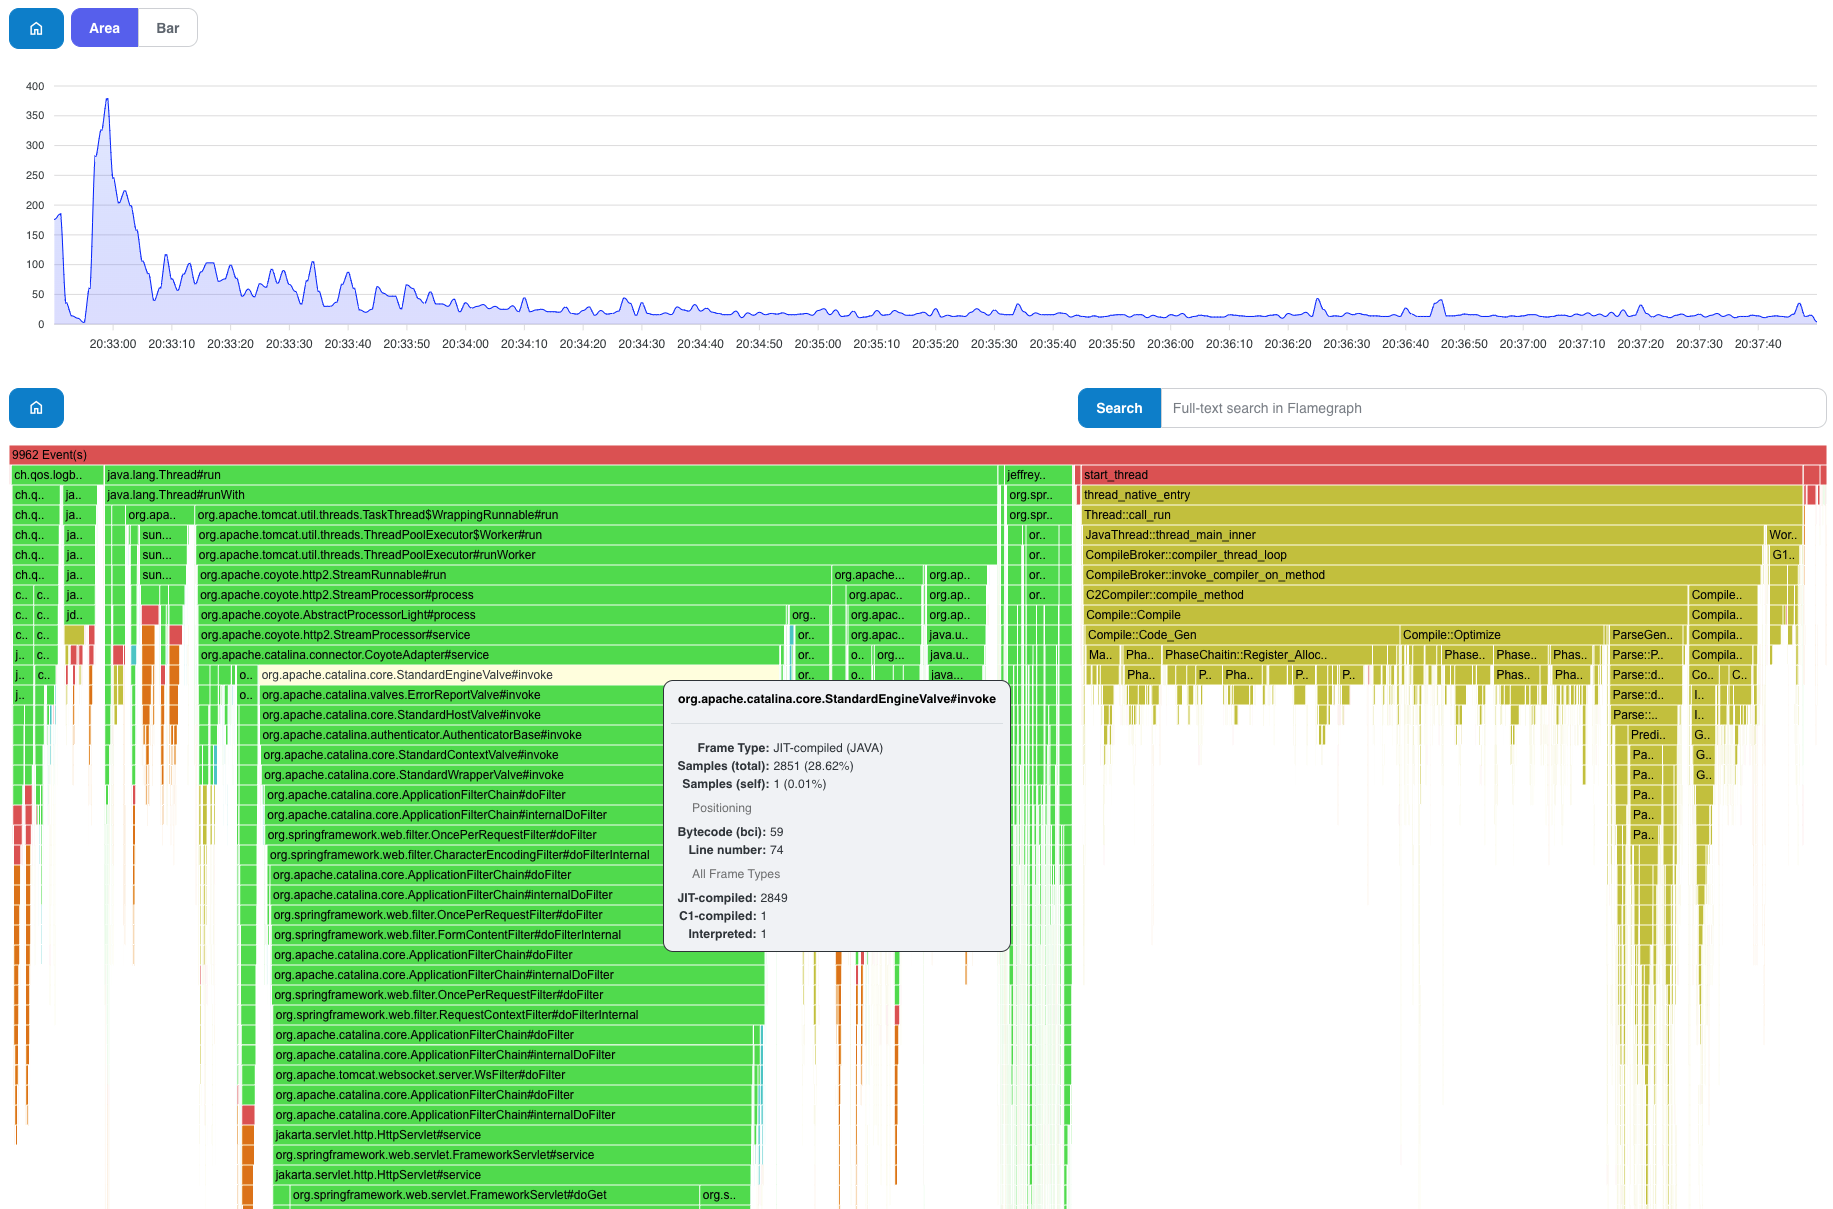
--with-timeseries Includes Timeseries graph with a Flamegraph (it's `true` by default, set `false` to have only the Flamegraph) The simplest command below generates the CPU flame graph (based on jdk.ExecutionSample) to the same folder with the name of the recording (you can use the output argument to specify the output's filename and path).
java -jar jeffrey-cli.jar flame jeffrey-persons-full-direct-serde.jfr
Generated: <path>/jeffrey-recordings/jeffrey-persons-full-direct-serde.html
Open <path>/jeffrey-recordings/jeffrey-persons-full-direct-serde.html in your favorite browser.
Flame Graph for a Specific Event Type
Another example below uses a specific event-type with a weight option. Since we know that the recording was generated using async-profiler with an alloc option, then we need to use jdk.ObjectAllocationInNewTLAB as the event-type to get the appropriate result.
The weight option is useful in this case because we want to be focused more on the path generating more bytes instead of more samples. Otherwise, we could be misled by a lot of samples with non-significant allocated amounts of memory that would hide interesting spots with fewer samples but huge allocated chunks.
$ java -jar jeffrey-cli.jar flame --event-type=jdk.ObjectAllocationInNewTLAB --weight jeffrey-persons-full-direct-serde.jfr
Generated: <path>/jeffrey-recordings/jeffrey-persons-full-direct-serde.html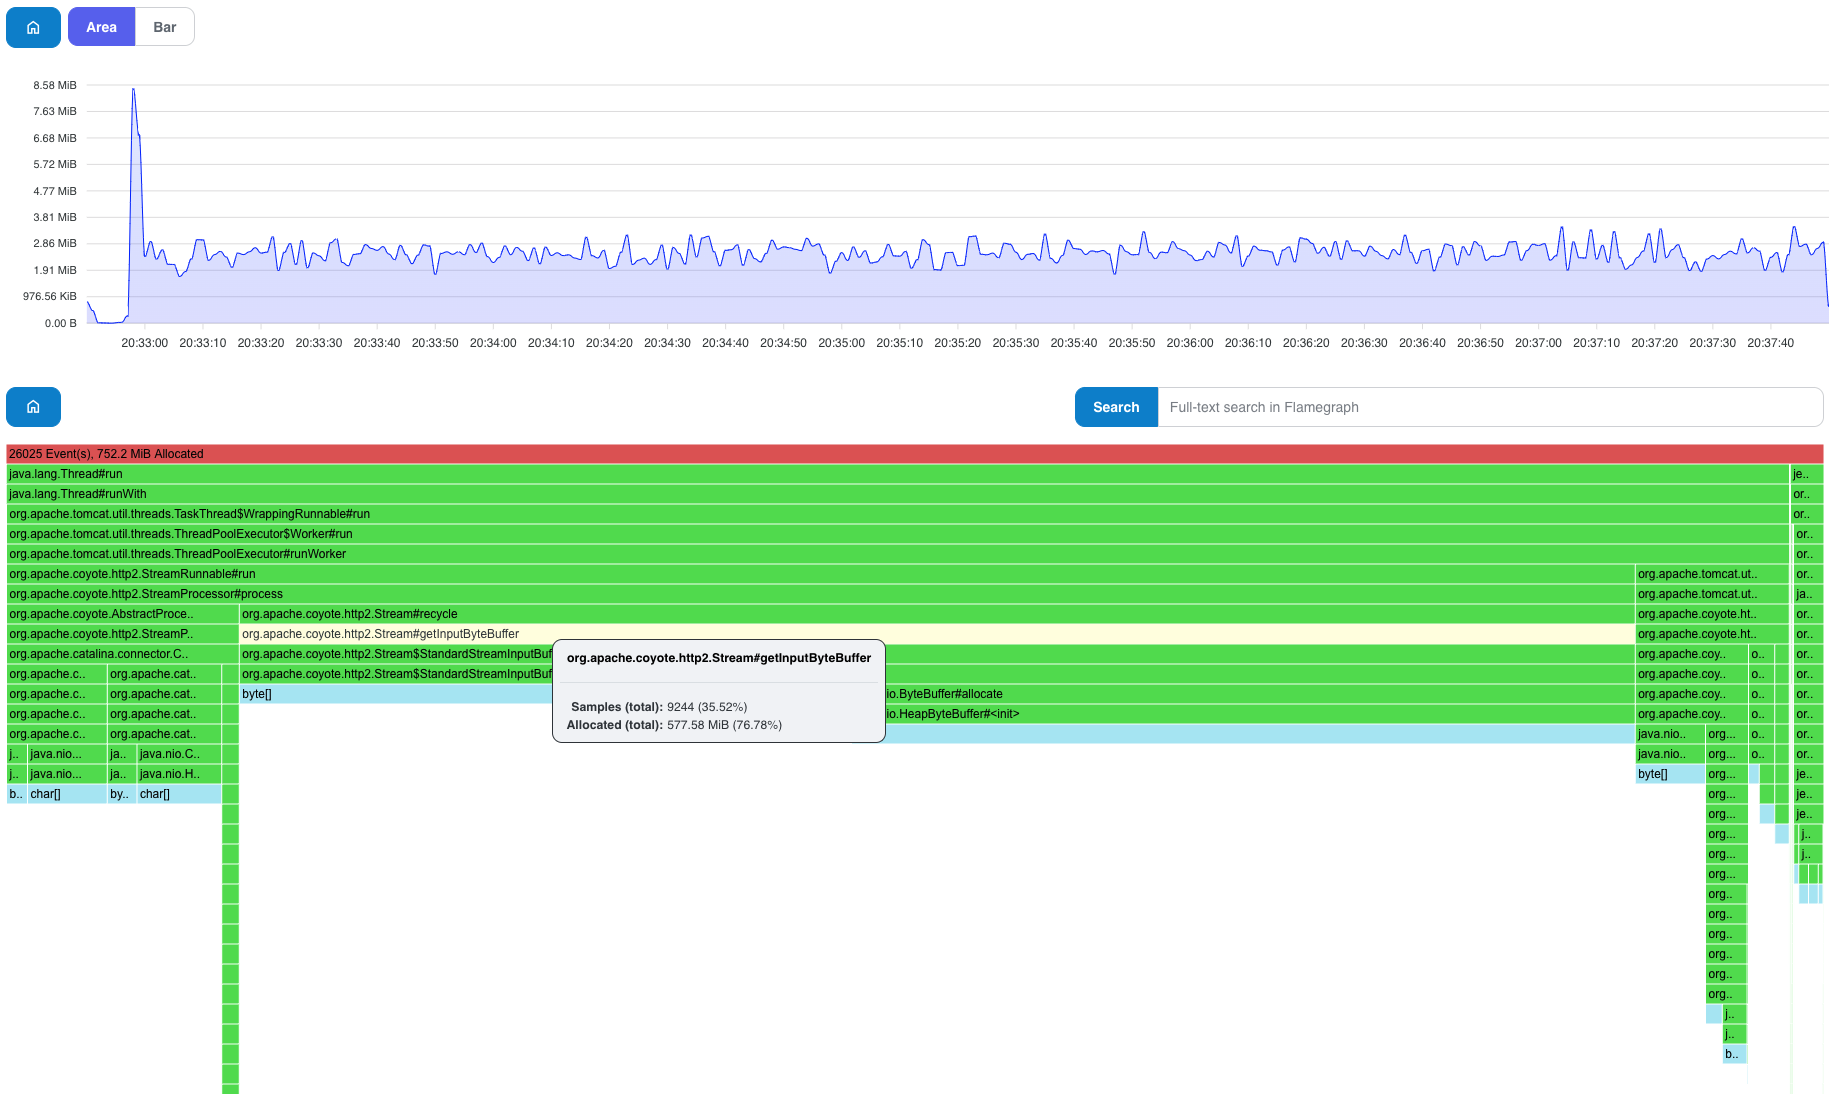
Flame Graph Grouped by Threads
In some cases, it's useful to generate a graph where samples are grouped by a specific thread generated by the given sample (especially for wall-clock samples, however, it makes sense for other types as well).
$ java -jar jeffrey-cli.jar flame --thread jeffrey-persons-full-direct-serde.jfr
Generated: <path>/jeffrey-recordings/jeffrey-persons-full-direct-serde.html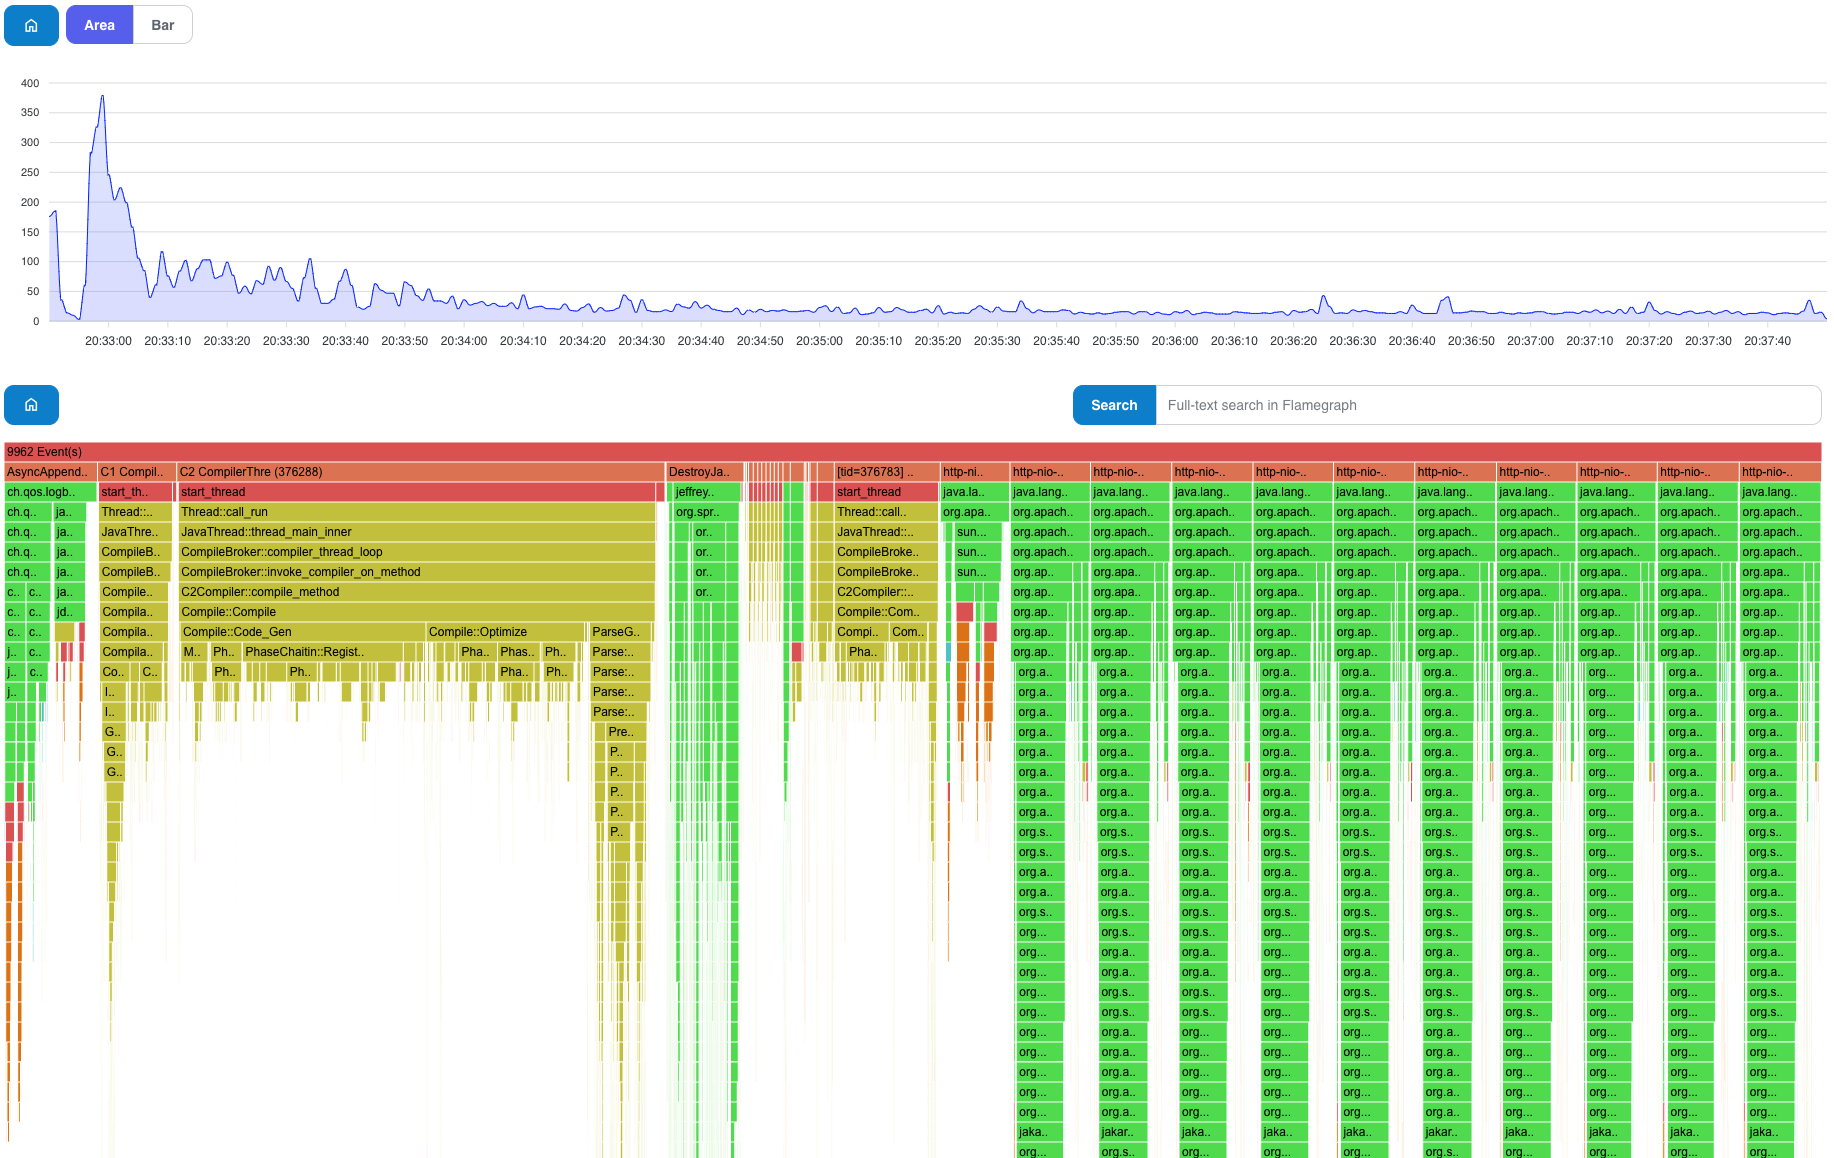
Searching in Time Series and Flame Graph
As mentioned before, it's not possible to use zooming and searching directly from the generated graph because of its static nature. However, at least we can generate the graph with a search-pattern option to split the time series graph into two series:
- Samples that contain the search-pattern
- The rest of the samples that are not matched
We search for Compile pattern in the samples to point out the compilation overhead over the time of the recording.
$ java -jar jeffrey-cli.jar flame --search-pattern=Compile jeffrey-persons-full-direct-serde.jfr
Generated: <path>/jeffrey-recordings/jeffrey-persons-full-direct-serde.html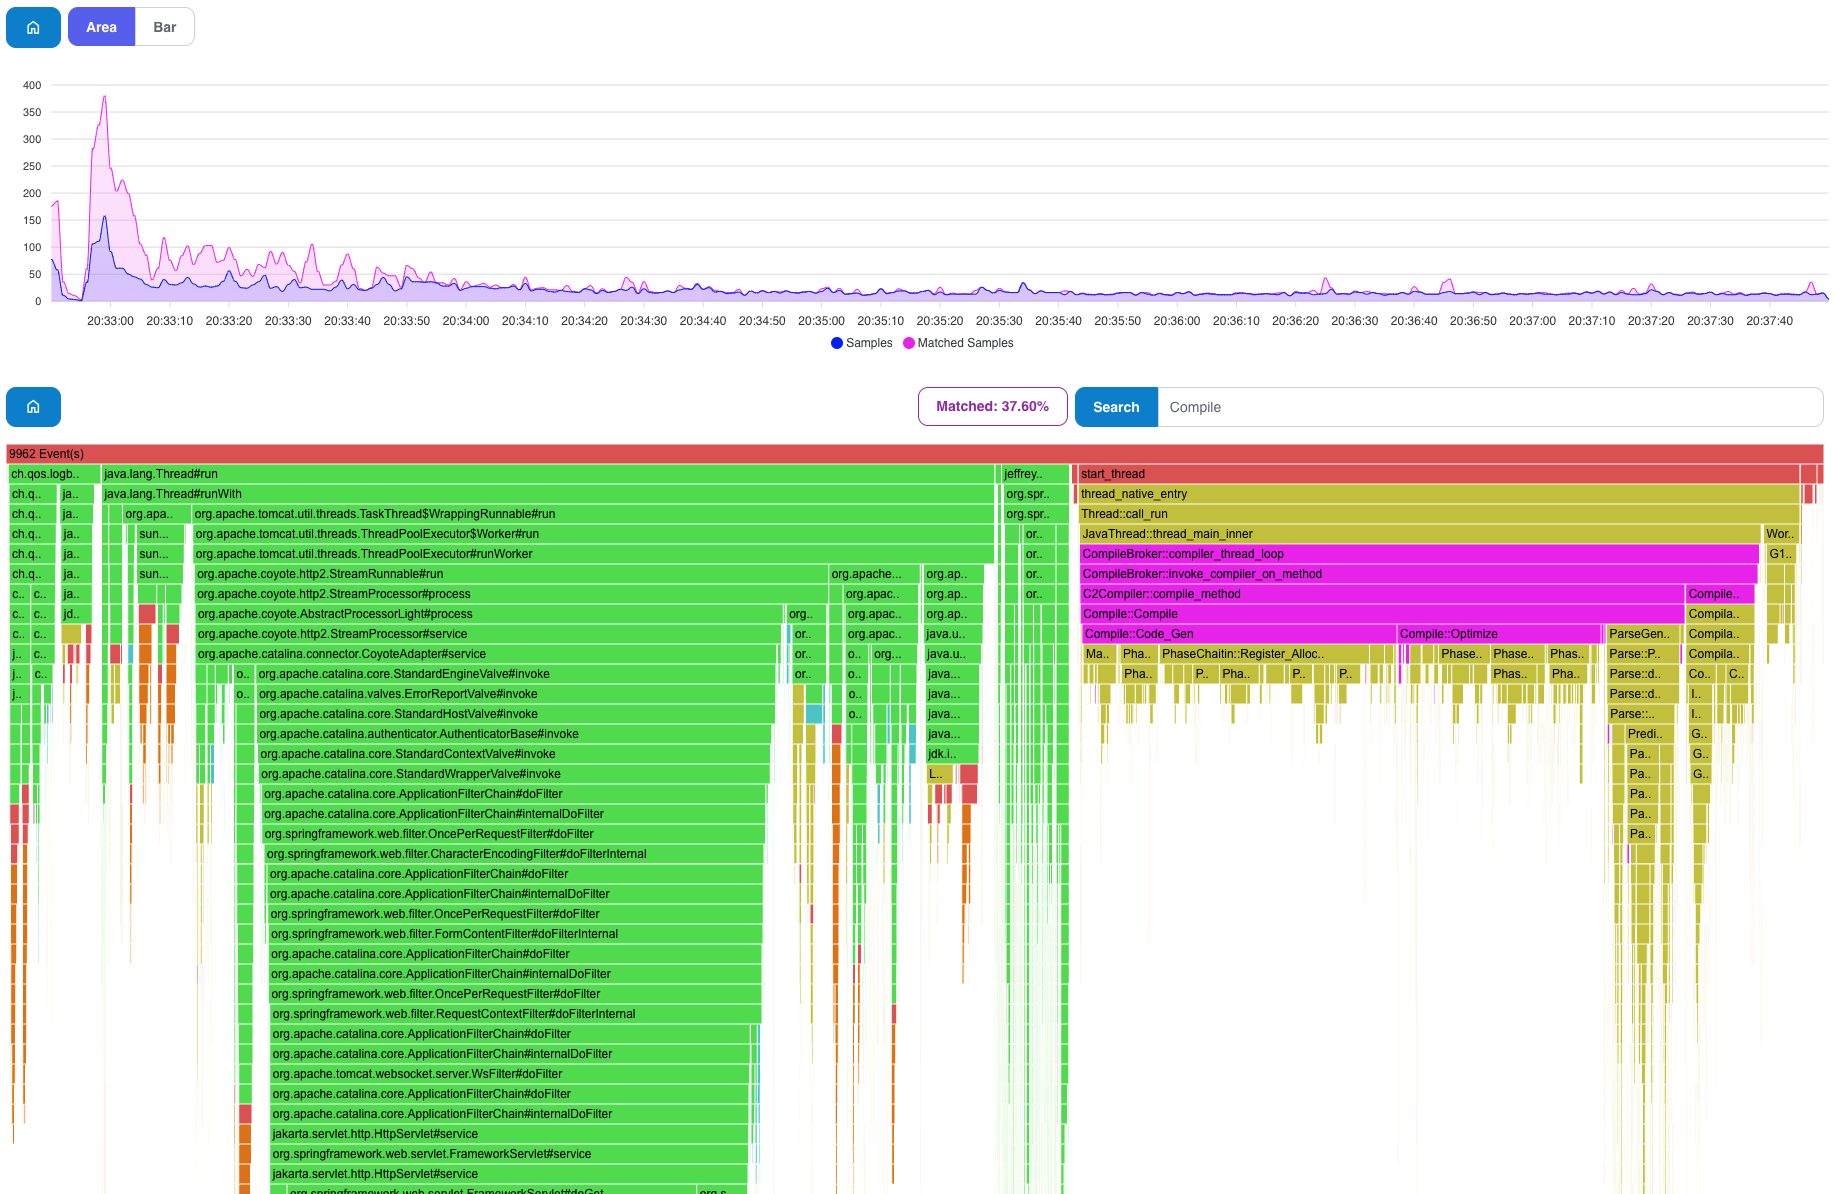
Summary
Play around, try out other use cases, and let me know about your findings. Thank you for reading my article and please leave your comments below. If you have any ideas to make Jeffrey a better tool to use, or if you want to file a bug, please, visit Jeffrey's GitHub Repository.
The next article could be about differential graphs! Stay tuned!
Published at DZone with permission of Petr Bouda. See the original article here.
Opinions expressed by DZone contributors are their own.
Comments