How to Identify and Troubleshoot a Netty Memory Leak
Learn more about identifying a Netty memory leak.
Join the DZone community and get the full member experience.
Join For FreeLet’s start with the happy ending — after a long search, we managed to identify a Netty memory leak in one of our log listeners and were able to troubleshoot and fix the issue on time before the service crashed.
More on the subject can be found below:
- Transforming DevOps from an Art to a Science: Announcing Logz.io Cognitive Insights
- Introducing Application Insights and Data Optimizer
- What’s New in Logz.io: Introducing Alerts on Aggregations
Listening to Netty
Backing up a bit, let’s provide some context.
Logz.io’s log listeners act as the entry point for data collected from our users and are subsequently pushed to our Kafka instances. They are Dockerized Java services, based on Netty, and are designed to handle extremely high throughput.
Netty memory leaks are not an uncommon occurrence. In the past, we’ve shared some lessons learned from a ByteBuf memory leak and there are other types of memory issues that can arise, especially when handling high volumes of data. Manual tweaking of the cleanup process for unused objects is extremely tricky and blown up memory usage is a scenario experienced by many scarred engineering teams (don’t believe me? just Google it).
In a production environment handling millions of logs messages a day though, these events run the risk of going unnoticed — until disaster strikes and memory runs out, that is. Then, they are extremely noticed.
Identifying the leak
So, how was the Netty memory leak identified in this case?
The answer is Logz.io’s Cognitive Insights — a technology that combines machine learning with crowdsourcing to help reveal exactly this type of event. It works by identifying correlations between logs and discussions in technical forums and flagging them as events within Kibana. Then, it displays them together with actionable information, which can be used to debug and prevent the same event from occurring in the future.
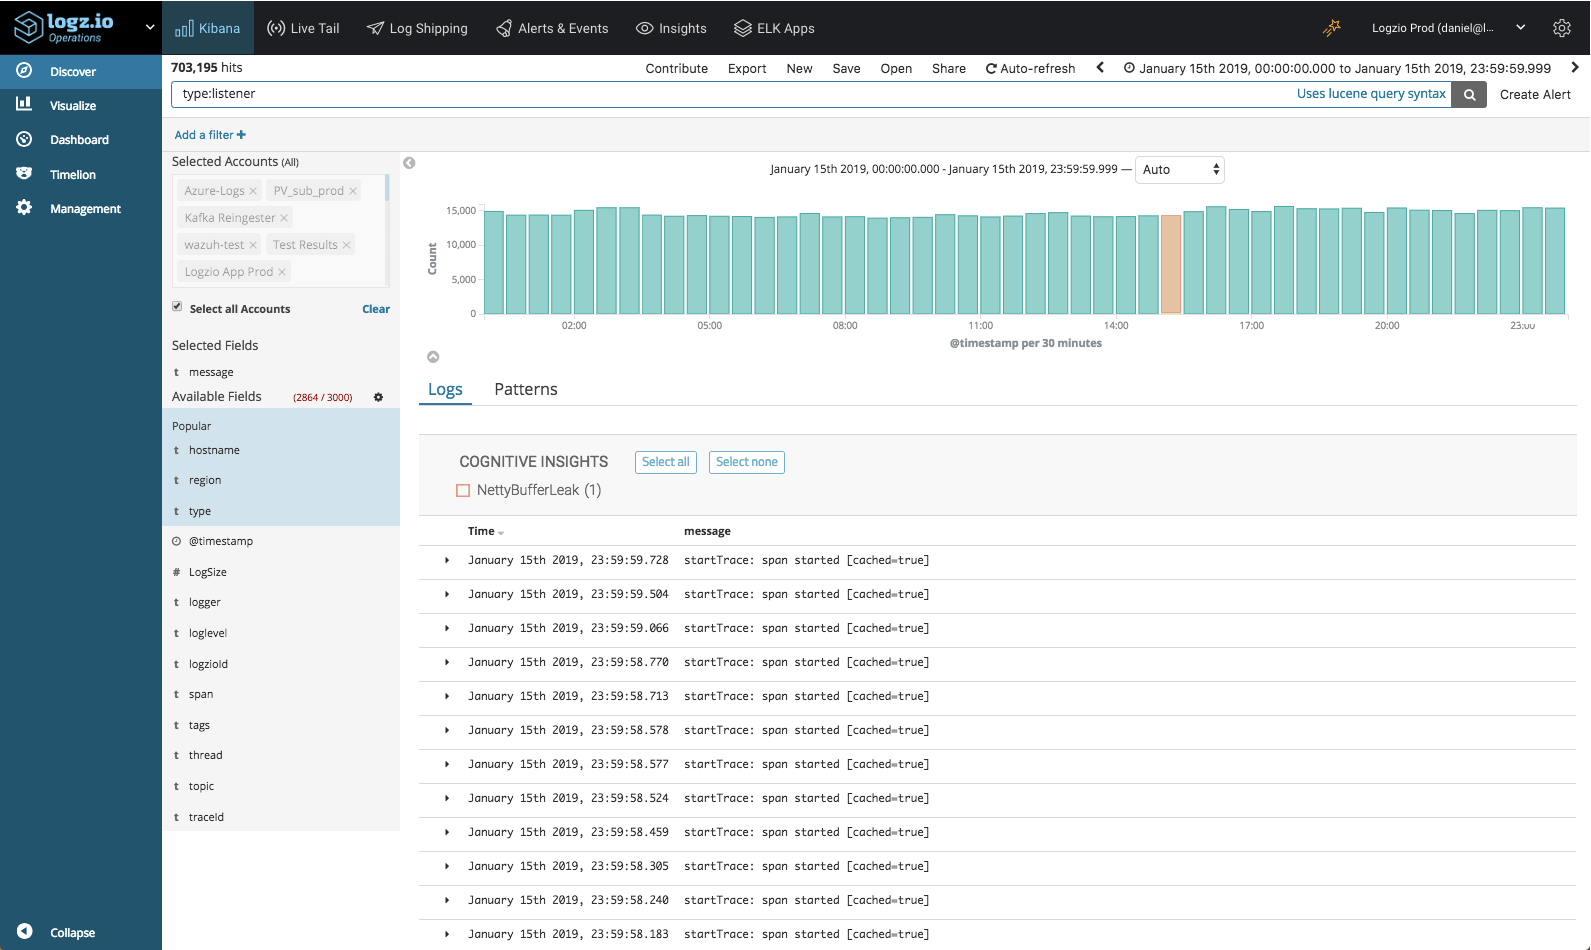
On the day in question, January 15, our system recorded over 400 million log messages. Out of these messages, Cognitive Insights identified one log message generated by the listener service — NettyBufferLeak.
Opening the insight, more details were revealed. Turns out that this event had transpired four times during the recent week and that this specific event was discussed in Netty’s technical documentation, the link to which is included in the insight.
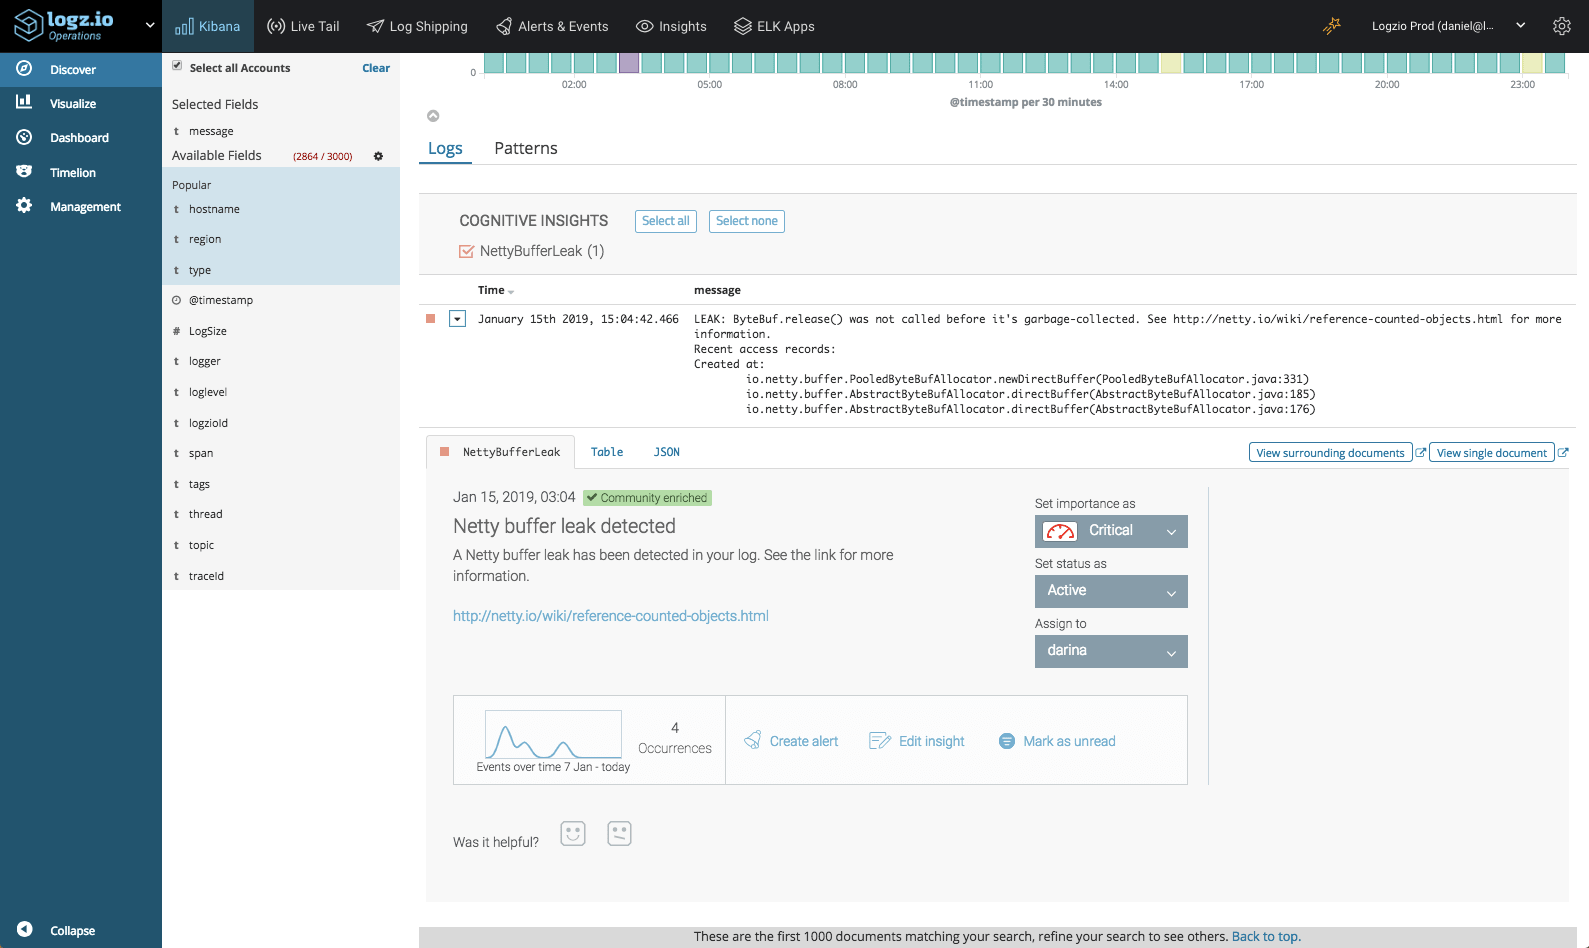
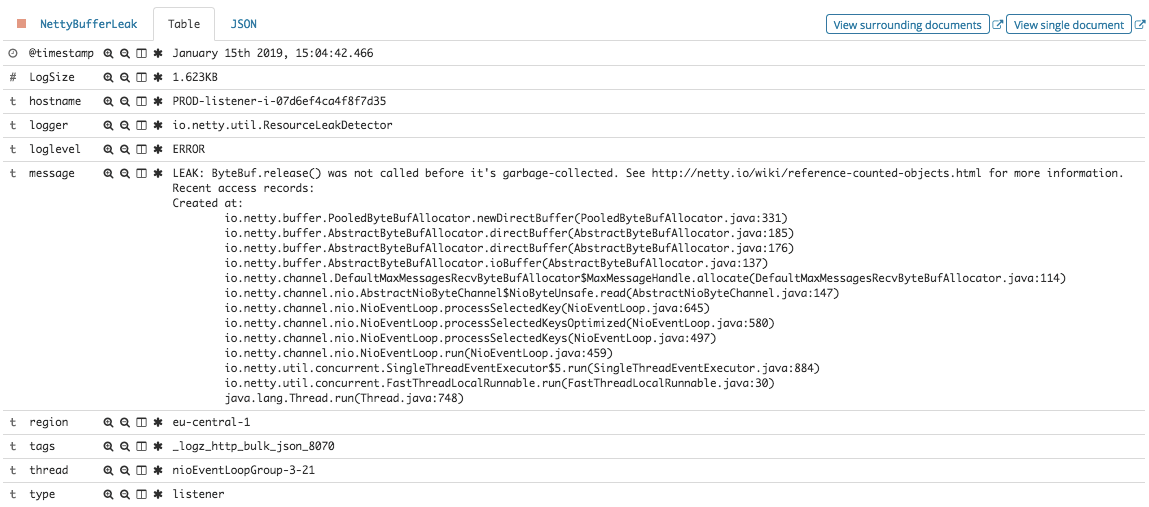
Taking a look at the actual stacktrace included in the message, our team was able to understand the cause of the leak and fix it.
Going Proactive
While there are fail-safe mechanisms in place for failed listeners, this scenario is not one Logz.io can afford and we’d rather avoid waking up an on-call engineer if possible.
To prevent similar memory leaks from happening in the future, we executed a number of measures based on the information provided to us in the insight. First, we created tests based on the specific log message the insight surfaced and then used them to verify that our fix to the leak did not generate the log. Second, we created an alert to notify us, should this exact event take place in the future.
Endnotes
In the field of log analysis, one of the biggest challenges facing engineers is being able to find the needle in the haystack and identify that single log message, which indicates that something in the environment is broken and is about to crash our service. Often enough, events will simply go unnoticed in the stream of big data being ingested into the system.
There are different methods used to overcome this challenge, a popular one being anomaly detection. A baseline for normal behavior is identified and deviations from this baseline trigger alerts. While sufficient in some cases, a traditional anomaly detection system would most likely not have identified the Netty memory leak — an event that is extremely slow and gradual, with leakages occurring intermittently over time.
Using correlations between specific log messages and the vast wealth of technical knowledge on the web helps reveal critical events that would, otherwise, have gone unnoticed. A large number of our users are already leveraging Cognitive Insights for this purpose, and I’ll follow up with a piece on some examples of events we’ve helped uncover.
Published at DZone with permission of Daniel Berman, DZone MVB. See the original article here.
Opinions expressed by DZone contributors are their own.
Comments