How To Integrate Grafana in Our Internal Tools/Admin Panels Using AuthProxy
In this tutorial, learn how to integrate Grafana with an internal app using the AuthProxy module of Grafana.
Join the DZone community and get the full member experience.
Join For FreeGrafana is an amazing charting tool, as it can provide beautiful charts and visualization for data. Integrating Grafana charts with internal tools can unlock great potential. Internal tools are custom dashboards, admin panels, and CRUD apps that enable teams to automate processes.
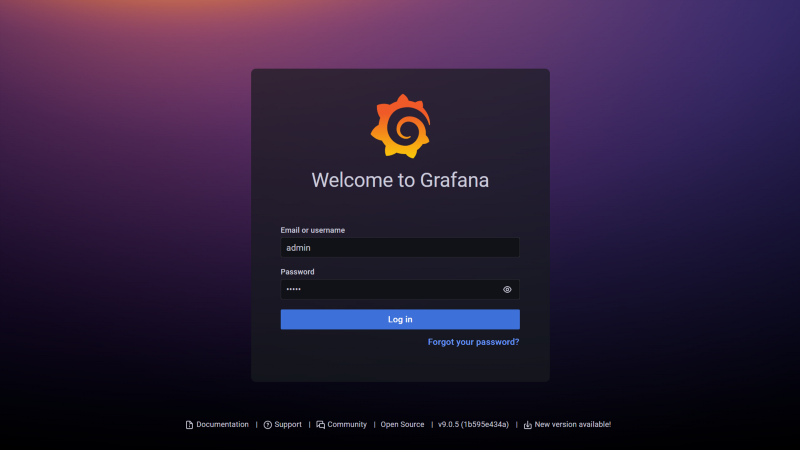
Grafana comes with built-in authentication. To view its dashboard, the user has to go through its login screen.
Now our user has to do two authentications: one for the internal tool and the other for Grafana. Multiple authentications can create a bad user experience. So how can we integrate Grafana authentication with our internal tool auth, such that our users can get a seamless experience and have to sign in only once?
In this tutorial, we are going to learn how to integrate Grafana with our internal app using the AuthProxy module of Grafana. We will be using a custom reverse proxy for this.
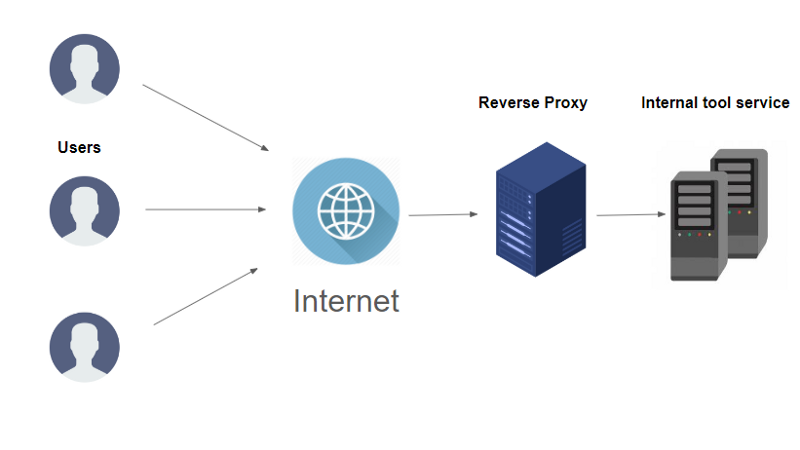
Quick Overview of Reverse Proxy
A reverse proxy is a proxy server that acts like middleware, responsible for protecting the identity of the server to the clients. Well, it increases security.
Generally, the proxy level load balancers as well as authentication layers are present. Multiple applications can be accessed with a single login by setting up authentication at the reverse proxy level; for example, Google single sign-in gives access to drive, docs, maps, Gmail, etc.
Adding Grafana to Our Cluster
We can add Grafana easily to our cluster with the help of a Helm Chart or we can run it as a Kubernetes manifest file.
Architecture, when Grafana service is directly exposed to the main reverse proxy, is as follows:
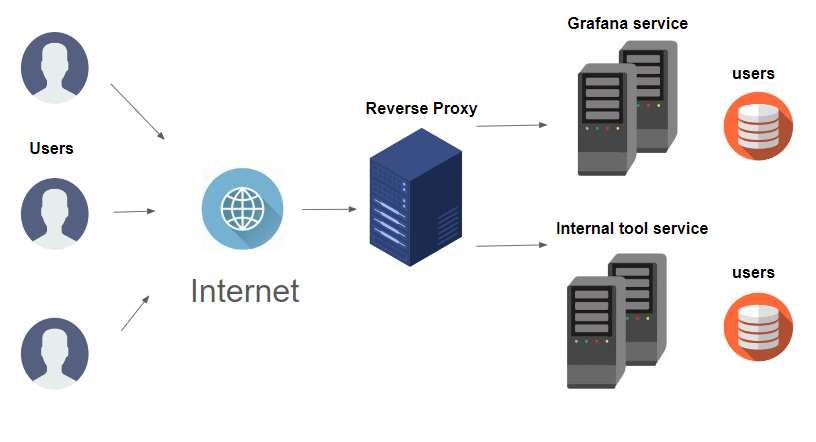
Both services maintain their authentication separately, so managing users can be a real pain.
To remove this double authentication, we are going to use the AuthProxy module, which will make authentication pluggable. We will also update the config file such that we can auto-sign up users.
Grafana AuthProxy feature
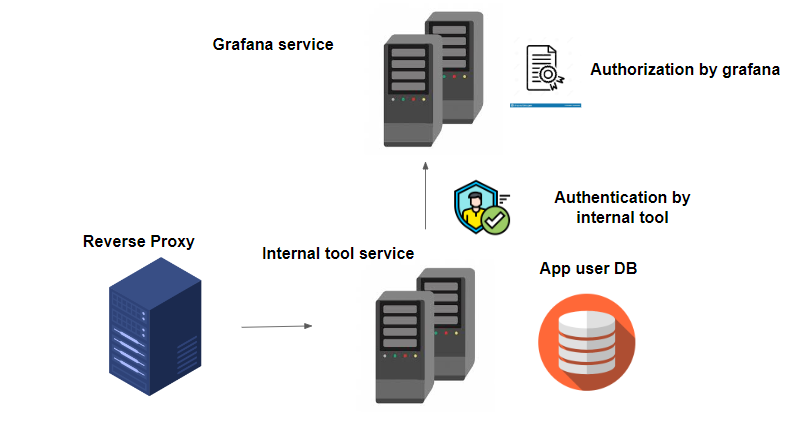
The Grafana AuthProxy module can make Grafana authentication pluggable. So, a reverse proxy can sit in front of Grafana and can take responsibility for user authentication.
Note that the Grafana database will be further used for authorization purposes. We are only plugging out authentication responsibility and giving it to our internal tool which will act like a reverse proxy.
Our ultimate architecture will look like this:
Now that we have understood the theory, let’s start hands-on.
The overall code is present in this repository.
Prerequisite
- Docker Or Kubernetes cluster
Steps for Starting Grafana With AuthProxy
1. Inside your working directory, make adata directory and make a file in it as Grafana.ini. This data/grafana.iniwill be our configuration file.
Add the following code to it:
[server]
protocol= http
domain= localhost
http_port= 3000
root_url= "%(protocol)s://%(domain)s:%(http_port)s/grafana/"
serve_from_sub_path= true

[auth.proxy]
enabled = true
# HTTP Header name that will contain the username or email
header_name = X-WEBAUTH-USER
# HTTP Header property, defaults to `username` but can also be `email`
header_property = username
# Set to `true` to enable auto sign up of users who do not exist in Grafana DB. Defaults to `true`.
auto_sign_up = true
# Define cache time to live in minutes
# If combined with Grafana LDAP integration it is also the sync interval
sync_ttl = 60
# Limit where auth proxy requests come from by configuring a list of IP addresses.
# This can be used to prevent users spoofing the X-WEBAUTH-USER header.
# Example `whitelist = 192.168.1.1, 192.168.1.0/24, 2001::23, 2001::0/120`
whitelist =
# Optionally define more headers to sync other user attributes
# Example `headers = Name:X-WEBAUTH-NAME Role:X-WEBAUTH-ROLE Email:X-WEBAUTH-EMAIL Groups:X-WEBAUTH-GROUPS`
headers =
# Non-ASCII strings in header values are encoded using quoted-printable encoding
;headers_encoded = false
# Check out docs on this for more details on the below setting
enable_login_token = false
2. Let’s now start a Docker container and attach a volume to it containing the above config file:
docker run --name grafana --rm -v "$PWD/data:/etc/grafana" -p 3000:3000 grafana/grafana
3. Now let’s go to hit Grafana using curl request:
curl -H "X-WEBAUTH-USER: admin" http://localhost:3000/api/users
We can see a list of existing users without any authentication.
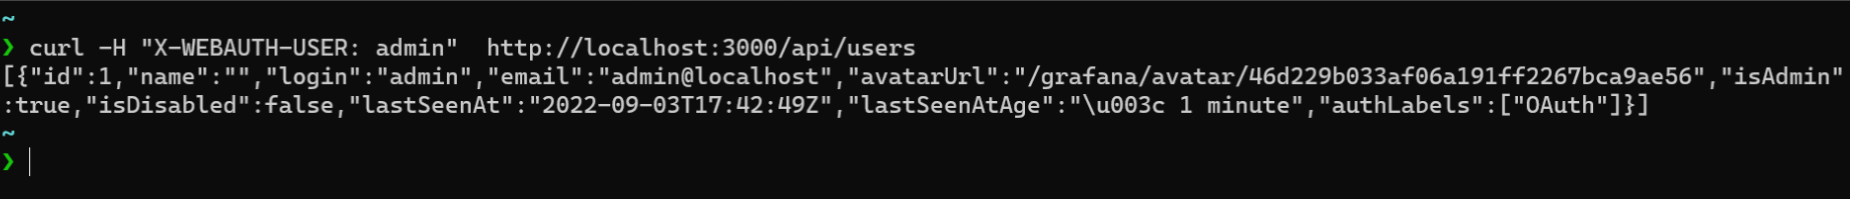
The above is the output of the GET request to Grafana.
Steps for Attaching Reverse Proxy Code to Our Internal App
1. We need to add the following snippet to our internal tool:
// NewProxy takes target host and creates a reverse proxy
func NewProxy(targetHost string) (*httputil.ReverseProxy, error) {
	url, err := url.Parse(targetHost) //targetHost is the url of grafana in case of docker it will be http://localhost:3000.
  // For k8s it will be http://SERVICE_NAME.NAMESPACE.svc.local:PORT
	if err != nil {
		return nil, err
	}
	proxy := httputil.NewSingleHostReverseProxy(url) //create reverse proxy object
	originalDirector := proxy.Director
	proxy.Director = func(req *http.Request) {
		originalDirector(req)
    // read username from request body &
    // authenticate the user and pass its user name to header as follows
    // "admin" user will have all privileges
    // rest users will have access as per authorization policy
    user := "admin"
		req.Header.Set("X-WEBAUTH-USER", user)
	}
	return proxy, nil
}

// ProxyRequestHandler handles the http request using proxy
func ProxyRequestHandler(proxy *httputil.ReverseProxy) func(http.ResponseWriter, *http.Request) {
	return func(w http.ResponseWriter, r *http.Request) {
		proxy.ServeHTTP(w, r)
	}
}
2. Yes, that’s it. Now we can create new users in Grafana DB by plugging authentication into our internal tool service.
The repository code is available.
Now run the code using go run main.go and access our internal app which is printing hello world.
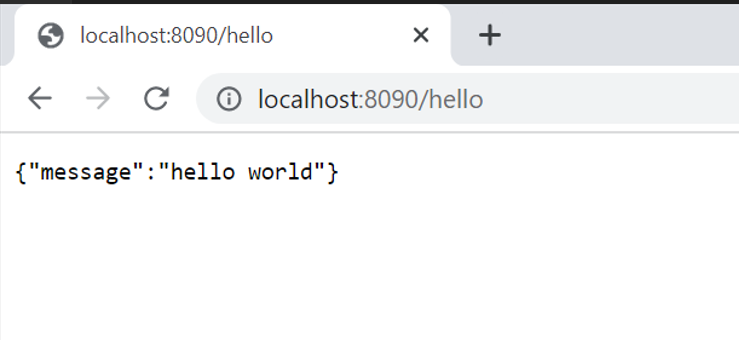
We can access Grafana with the same login and on the same port. Amazing, right?
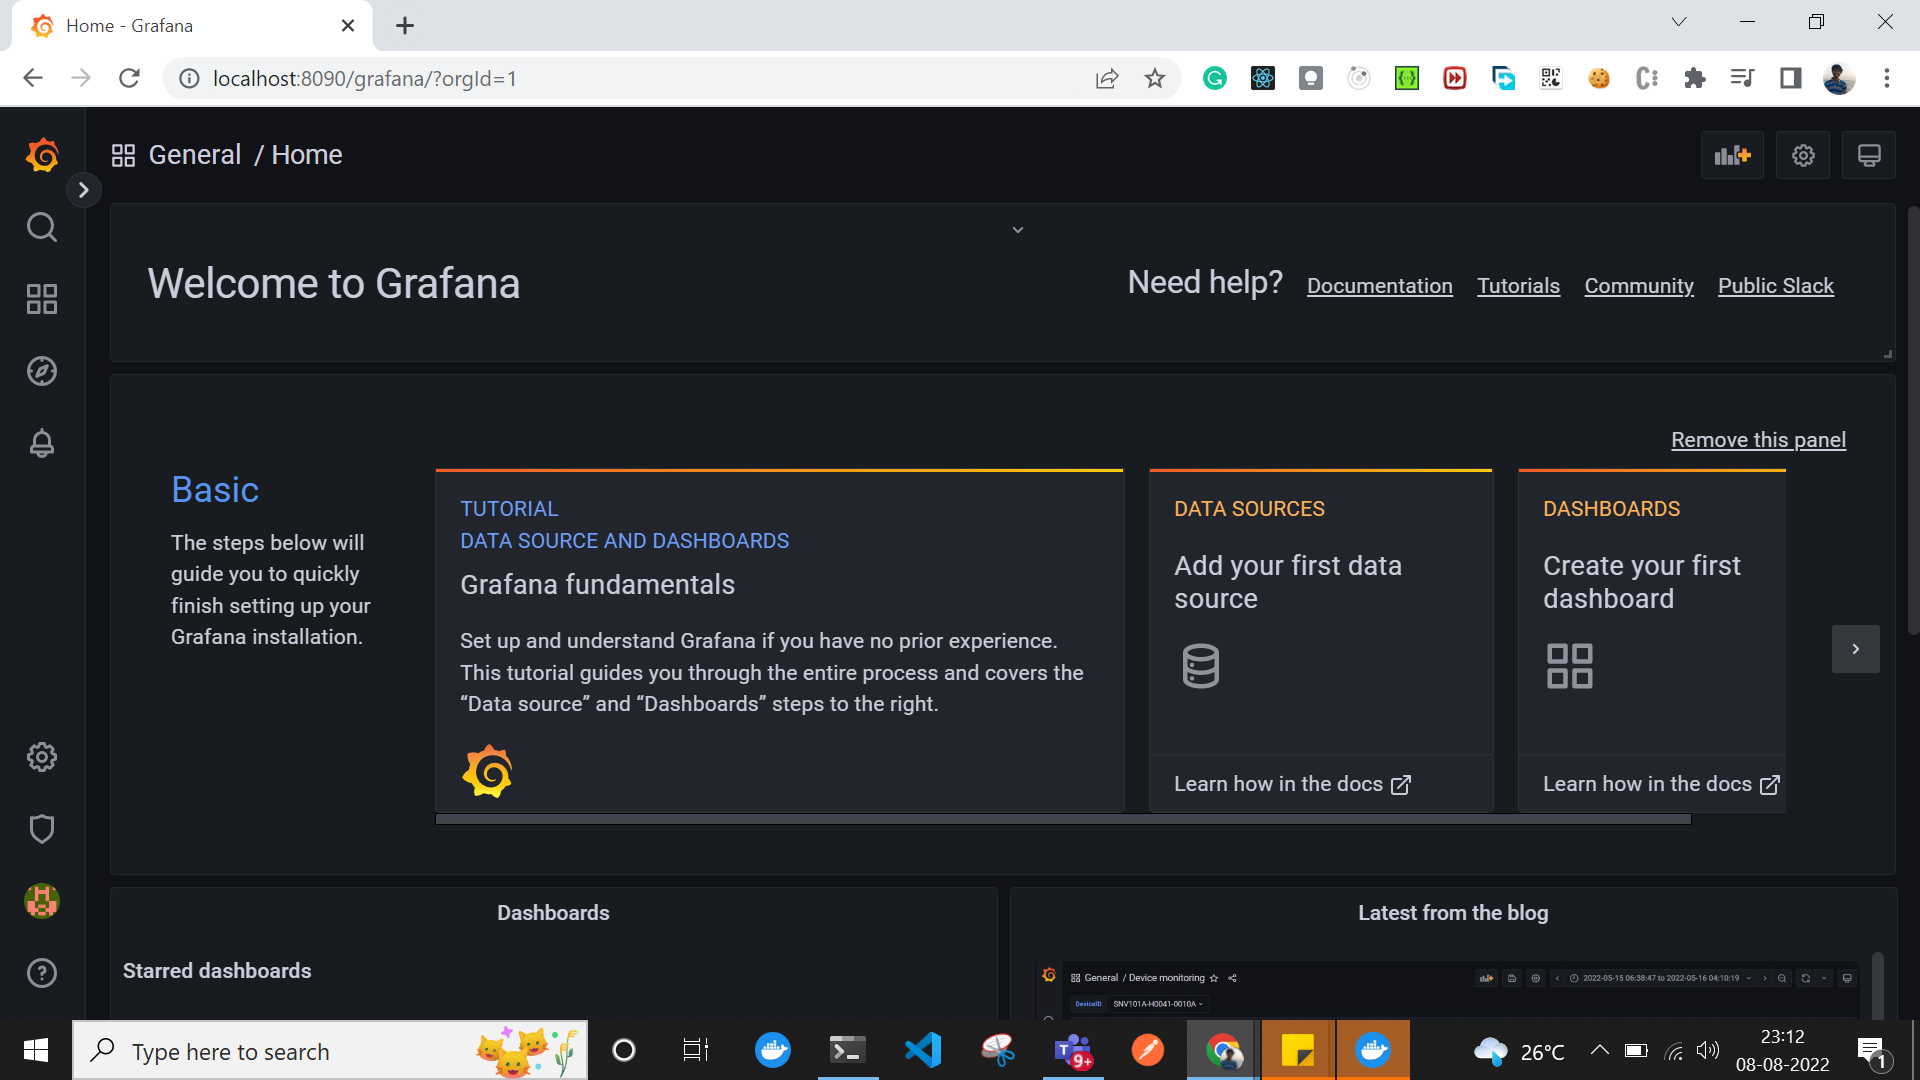
Hurray, we have made it, and now we don’t have to do multiple authentications!
But wait! We can’t forget the following important points:
- In production K8s cluster Grafana service won’t be exposed to any Load Balancer and should be treated as
ClusterIP. - The “admin” user plays an important role. Be aware of passing a right header in reverse proxy.
- New users will be created automatically as per the configuration file as we have enabled
auto_sign_up.
Published at DZone with permission of Atharva Ajgaonkar. See the original article here.
Opinions expressed by DZone contributors are their own.
Comments