Integrating Blackbox Exporter in Datadog, Prometheus, and Grafana for Custom Metrics
In this article, we will explore the process of utilizing the Blackbox Exporter to extract metrics from endpoints, as well as its integration with Datadog and Prometheus.
Join the DZone community and get the full member experience.
Join For FreeWhen exploring the capabilities of Blackbox Exporter and its role in monitoring and observability, I was eager to customize it to meet my specific production needs.
Datadog is a powerful monitoring system that comes with pre-planned packages containing all the necessary services for your infrastructure. However, at times I need a more precise and intuitive solution for my infrastructure that allows me to seamlessly transition between multiple cloud monitoring systems.
My use case involved the need to scrape metrics from endpoints using a range of protocols, including HTTP, HTTPS, DNS, TCP, and ICMP. That’s where Blackbox Exporter came into play.
It’s important to note that there are numerous open-source exporters available for a variety of technologies, such as databases, message brokers, and web servers. However, for the purposes of this article, we will focus on Blackbox Exporter and how we can scrape metrics and send them to Datadog.
If your system doesn’t use Datadog, you can jump to implement Step 1 and Step 3.
Following are the steps one takes in order to scrape custom metrics to Datadog:
- Step-by-step instructions on how to install Blackbox Exporter using Helm, with guidance on how to use it locally or in a production environment
- Extract custom metrics to DataDog from the BlackBox Exporter endpoints
- Collect custom metrics from BlackBox Exporter endpoints and make them available in Prometheus, then use Grafana to visualize them for better monitoring
Step 1: How to Install Blackbox Exporter Using Helm
We’ll use Helm to install the Blackbox Exporter. If necessary, you can customize the Helm values to suit your needs.
If you’re running in a Kubernetes production environment, you could opt to create an ingress:
ingress:
  enabled: true
  annotations:
    kubernetes.io/ingress.class: ingress-class
    nginx.ingress.kubernetes.io/proxy-connect-timeout: "30"
    nginx.ingress.kubernetes.io/proxy-read-timeout: "180"
    nginx.ingress.kubernetes.io/proxy-send-timeout: "180"
  hosts:
    - host: blackbox-exporter.<organization_name>.com
      paths:
      - backend:
          serviceName: blackbox-exporter
          servicePort: 9115
        path: /
  tls:
  - hosts:
    - '*.<organization_name>.com'
We won’t create an ingress in our tutorial as we test the example locally.
Our installation command is by the following:
helm upgrade -i prometheus-blackbox-exporter prometheus-community/prometheus-blackbox-exporter --version 7.2.0
Let’s try and see the Blackbox Exporter in action. We will export the BlackBox Exporter service with port-forward:
export POD_NAME=$(kubectl get pods --namespace default -l "app.kubernetes.io/name=prometheus-blackbox-exporter,app.kubernetes.io/instance=prometheus-blackbox-exporter" -o jsonpath="{.items[0].metadata.name}")
export CONTAINER_PORT=$(kubectl get pod --namespace default $POD_NAME -o jsonpath="{.spec.containers[0].ports[0].containerPort}")
echo "Visit http://127.0.0.1:9115 to use your application"
kubectl --namespace default port-forward $POD_NAME 9115:$CONTAINER_PORT
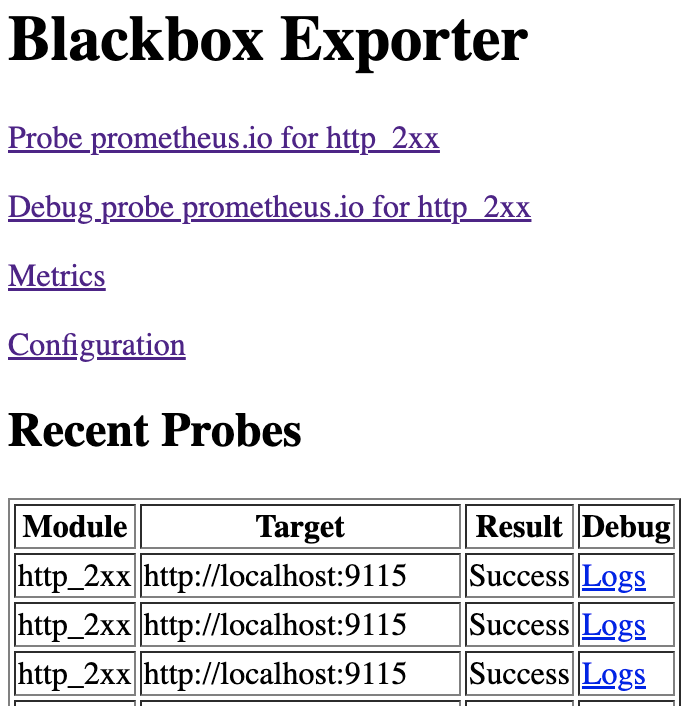
Let’s visit the URL : http://localhost:9115/
Let’s make a CURL request to check if we succeed to get a response of 200 from our BlackBox Exporter:
curl -I http://localhost:9115/probe\?target\=http://localhost:9115\&module\=http_2xx
If it passes successfully, we will be able to see the following result on the BlackBox Exporter dashboard:
Step 2: Extract Custom Metrics to DataDog
We’ll be using the following version of the Helm chart to install the Datadog agent in our cluster. Once installed, we can specify the metrics we want to monitor by editing the configuration and to add our OpenMetrics block. The OpenMetrics will enable us to extract custom metrics from any OpenMetrics endpoints.
Our installation command is by the following:
helm repo add prometheus-community https://prometheus-community.github.io/helm-charts
helm repo update
We are using the Prometheus Integration with Datadog in order to retrieve metrics from applications. However, instead of configuring the Prometheus URL, we will set up the BlackBox Exporter endpoints.
Our configuration in the Datadog Helm values looks like:
datadog:
  confd:
    openmetrics.yaml: |-
      instances:
        - prometheus_url: https://blackbox-exporter.<organization_name>.com/probe?target=https://jenkins.<organization_name>.com&module=http_2xx
          namespace: status_code
          metrics:
            - probe_success: 200
          min_collection_interval: 120
          prometheus_timeout: 120
          tags:
            - monitor_app:jenkins
            - monitor_env:production
            - service_name:blackbox-exporter
        - prometheus_url: https://blackbox-exporter.<organization_name>.com/probe?target=https://argocd.<organization_name>.com&module=http_2xx
          namespace: status_code
          metrics:
            - probe_success: 200
          min_collection_interval: 120
          prometheus_timeout: 120
          tags:
            - monitor_app:argocd
            - monitor_env:production
            - service_name:blackbox-exporter
We’ve selected “probe_success” as the metric to scrape, and renamed it to “status_code:200” to make it more intuitive and easier to define alerts for later on.
That’s all. Once you log in to your Datadog dashboard, you can explore the custom metrics by filtering based on the service_name tag that we defined as “blackbox-exporter”.
Step 3: Extract Custom Metrics and Visualize Them in Grafana Using Prometheus
We’ll be using the following version of the Helm chart to install Prometheus in our cluster.
First we will create our values.yaml of our Helm configuration:
prometheus:
  prometheusSpec:
    additionalScrapeConfigs: |
      - job_name: 'prometheus-blackbox-exporter'
        scrape_timeout: 15s
        scrape_interval: 15s
        metrics_path: /probe
        params:
          module: [http_2xx]
        static_configs:
          - targets:
            - http://localhost:9115
            - http://localhost:8080
        relabel_configs:
          - source_labels: [__address__]
            target_label: __param_target
          - source_labels: [__param_target]
            target_label: instance
          - target_label: __address__
            replacement: prometheus-blackbox-exporter:9115
alertmanager:
  enabled: false
nodeExporter:
  enabled: false
Now we can proceed with the installation of the Prometheus Stack:
helm upgrade -i prometheus prometheus-community/kube-prometheus-stack -f values.yaml --version 45.0.0
Let’s utilize Kubernetes port-forwarding for Prometheus:
kubectl port-forward service/prometheus-kube-prometheus-prometheus -n default 9090:9090
To see that we’re scraping metrics from the BlackBox Exporter, navigate to http://localhost:9090/metrics. You can search for the job_name “prometheus-blackbox-exporter” that we defined in the Helm values of the Prometheus Stack.
Let’s utilize Kubernetes port-forwarding for Grafana:
# Get the Grafana password
# Grafana username is: admin
kubectl get secrets -n default prometheus-grafana -o jsonpath="{.data.admin-password}" | base64 --decode ; echo
kubectl port-forward service/prometheus-grafana -n default 3000:80
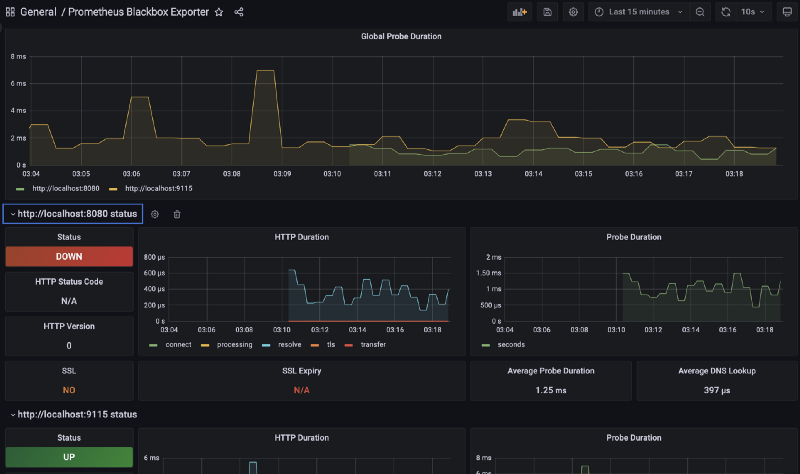
To import the Prometheus Blackbox Exporter dashboard, go to http://localhost:3000/dashboard/import and use dashboard ID 7587.
Summary
As covered in our article, we provided a simple and manageable method for customizing your metrics according to your system monitoring requirements. Whether you are utilizing a paid monitoring system or an open-source one, it is crucial to have the ability to choose and accurately identify your production needs. A thorough understanding of this process will result in cost-effectiveness and the enhancement of team knowledge.
Opinions expressed by DZone contributors are their own.
Comments