How to Monitor a Spring Boot App With Ostara
In this blog, you will learn how to monitor a Spring Boot application using Ostara. Ostara is a desktop application that monitors and manages your application. Enjoy!
Join the DZone community and get the full member experience.
Join For FreeIn this blog, you will learn how to monitor a Spring Boot application using Ostara. Ostara is a desktop application that monitors and manages your application. Enjoy!
Introduction
When an application runs in production (but also your other environments), it is wise to monitor its health. You want to make sure that everything is running without any problems, and the only way to know this is to measure the health of your application. When something goes wrong, you hopefully will be notified before your customer notices the problem, and maybe you can solve the problem before your customer notices anything. In a previous post, it was explained how to monitor your application using Spring Actuator, Prometheus, and Grafana. In this post, you will take a look at an alternative approach using Spring Actuator in combination with Ostara. The setup with Ostara is a bit easier; therefore, it looks like a valid alternative. The proof of the pudding is in the eating, so let’s try Ostara!
The sources used in this blog are available on GitHub.
Prerequisites
The prerequisites needed for this blog are:
- Basic Spring Boot 3 knowledge;
- Basic Linux knowledge;
- Java 17 is used.
Create an Application Under Test
First, you need to create an application that you can monitor. Navigate to Spring Initializr and add the Spring Web and Spring Boot Actuator dependencies. Spring Web will be used to create two dummy Rest endpoints, and Spring Boot Actuator will be used to enable the monitor endpoints. See a previous post in order to get more acquainted with Spring Boot Actuator. The post is written for Spring Boot 2, but the contents are still applicable for Spring Boot 3.
Add the git-commit-id-plugin to the pom file in order to be able to generate build information. Also, add the build-info goal to the executions of the spring-boot-maven-plugin in order to generate the information automatically during a build. See a previous post if you want to know more about the git-commit-id-plugin.
<build>
  <plugins>
    <plugin>
      <groupId>org.springframework.boot</groupId>
      <artifactId>spring-boot-maven-plugin</artifactId>
      <executions>
        <execution>
          <goals>
            <goal>build-info</goal>
          </goals>
        </execution>
      </executions>
    </plugin>
    <plugin>
      <groupId>pl.project13.maven</groupId>
      <artifactId>git-commit-id-plugin</artifactId>
      <version>4.9.10</version>
      <executions>
        <execution>
          <id>get-the-git-infos</id>
          <goals>
            <goal>revision</goal>
          </goals>
        </execution>
      </executions>

      <configuration>
        <dotGitDirectory>${project.basedir}/.git</dotGitDirectory>
        <prefix>git</prefix>
        <verbose>false</verbose>
        <generateGitPropertiesFile>true</generateGitPropertiesFile>
        <generateGitPropertiesFilename>${project.build.outputDirectory}/git.properties</generateGitPropertiesFilename>
        <format>properties</format>
        <gitDescribe>
          <skip>false</skip>
          <always>false</always>
          <dirty>-dirty</dirty>
        </gitDescribe>
      </configuration>

    </plugin>
  </plugins>
</build>
Enable the full git information to the actuator endpoint in the application.properties.
management.info.git.mode=fullAdd a Rest controller with two dummy endpoints.
@RestController
public class MetricsController {

    @GetMapping("/endPoint1")
    public String endPoint1() {
        return "Metrics for endPoint1";
    }

    @GetMapping("/endPoint2")
    public String endPoint2() {
        return "Metrics for endPoint2";
    }

}
Build the application.
$ mvn clean verifyRun the application.
$ java -jar target/myostaraplanet-0.0.1-SNAPSHOT.jarVerify the endpoints.
$ curl http://localhost:8080/endPoint1
Metrics for endPoint1
$ curl http://localhost:8080/endPoint2
Metrics for endPoint2
Verify the actuator endpoint.
$ curl http://localhost:8080/actuator | python3 -mjson.tool
 ...
{
    "_links": {
        "self": {
            "href": "http://localhost:8080/actuator",
            "templated": false
        },
        "health": {
            "href": "http://localhost:8080/actuator/health",
            "templated": false
        },
        "health-path": {
            "href": "http://localhost:8080/actuator/health/{*path}",
            "templated": true
        }
    }
}
Add Security
The basics are in place now. However, it is not very secure. Let’s add authorization to the actuator endpoint. Beware that the setup in this paragraph is not intended for production usage.
Add the Spring Security dependency to the pom.
<dependency>
  <groupId>org.springframework.boot</groupId>
  <artifactId>spring-boot-starter-security</artifactId>
</dependency>
Add the credentials and role to the application.properties file. Again, do not use this for production purposes.
spring.security.user.name=admin
spring.security.user.password=admin123
spring.security.user.roles=ADMIN
Add a WebSecurity class, which adds the security layer to the actuator endpoint.
@Configuration
@EnableWebSecurity
public class WebSecurity {
    @Bean
    public SecurityFilterChain securityFilterChain(HttpSecurity http) throws Exception {
        http.authorizeHttpRequests(authz -> authz
                .requestMatchers("/actuator/**").hasRole("ADMIN")
                .anyRequest().permitAll())
                .httpBasic(Customizer.withDefaults());
        return http.build();

    }
}
Build and start the application. Verify whether the actuator endpoint can be accessed using the credentials as specified.
$ curl http://localhost:8080/actuator -u "admin:admin123" | python3 -mjson.tool
 ...
{
    "_links": {
        "self": {
            "href": "http://localhost:8080/actuator",
            "templated": false
        },
        "health": {
            "href": "http://localhost:8080/actuator/health",
            "templated": false
        },
        "health-path": {
            "href": "http://localhost:8080/actuator/health/{*path}",
            "templated": true
        }
    }
}
Install Ostara
Navigate to the Ostara website and click the Download Ostara button. Choose the platform you are using (Linux 64bit, in my case), and the file Ostara-0.12.0.AppImage is downloaded. Double-click the file, and Ostara is started. That’s all!

Monitor Application
By default, only a limited set of actuator endpoints are enabled. Ostara will function with this limited set, but less information will be visible as a consequence. In order to see the full set of capabilities of Ostara, you enable all actuator endpoints. Again, beware of how much you expose in production.
management.endpoints.web.exposure.include=*
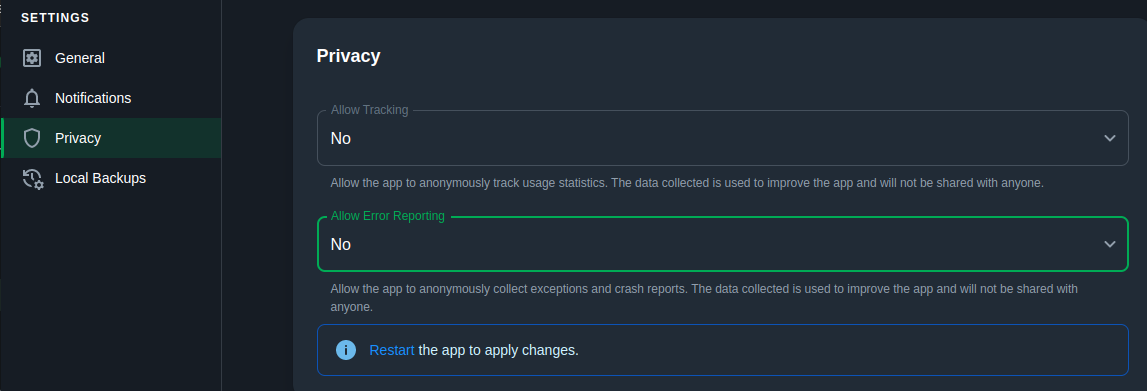
management.endpoint.health.show-details=alwaysBefore you continue using Ostara, you are advised to disable sending usage statistics and error information. Navigate to the settings (right top corner), choose Privacy, and disable the tracking options.
In the left menu, choose Create Instance and fill in the fields as follows:
- Actuator URL
- Alias: MyFirstInstance
- Application Name: MyFirstApp
- Disable SSL Verification: Yes (for this demo, no SSL connection is used)
- Authentication Type: Basic
- Username and Password: the admin credentials

Click the Test Connection button. This returns an unauthorized error, which appears to be a bug in Ostara because the credential information is correct.

Ignore the error and click the Save button.
Ostara can connect to the application, and the dashboard shows some basic status information.

You can explore all the available information for yourself. Some of them are highlighted below.
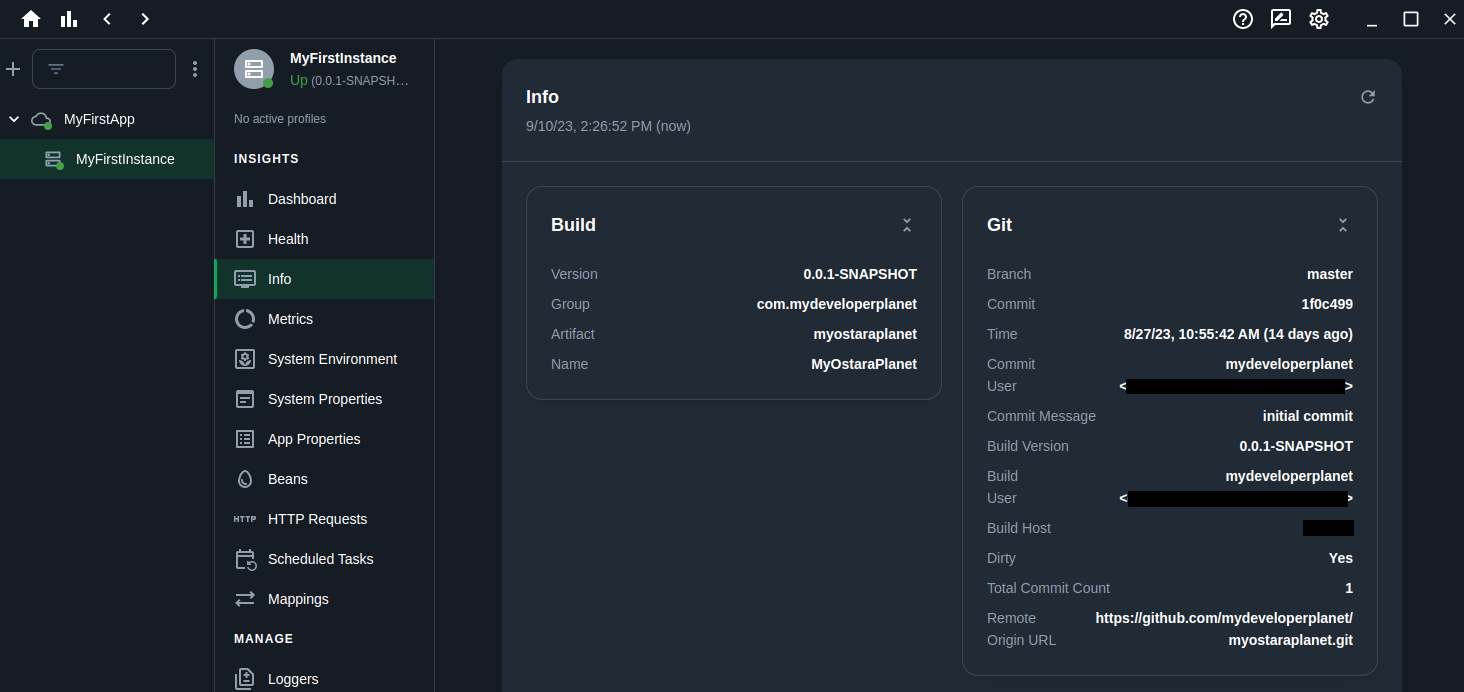
Info
The Info page shows you the information which you made available with the help of the git-commit-id-plugin.
App Properties
The App Properties page shows you the application properties. However, as you can see in the below screenshot, all values are masked. This is the default Spring Boot 3 behavior.
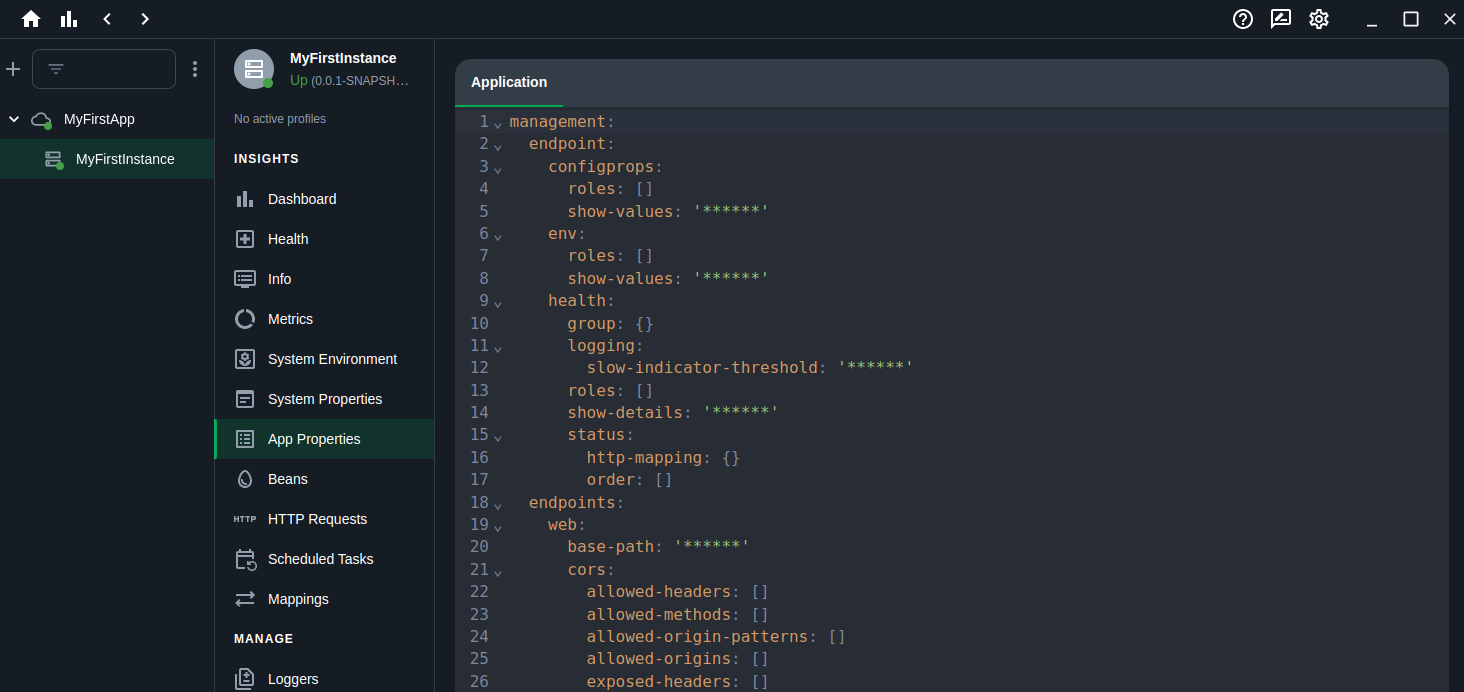
This behavior can be changed in application.properties of the Spring Boot Application. You can choose between always (not recommended), when-authorized or never.
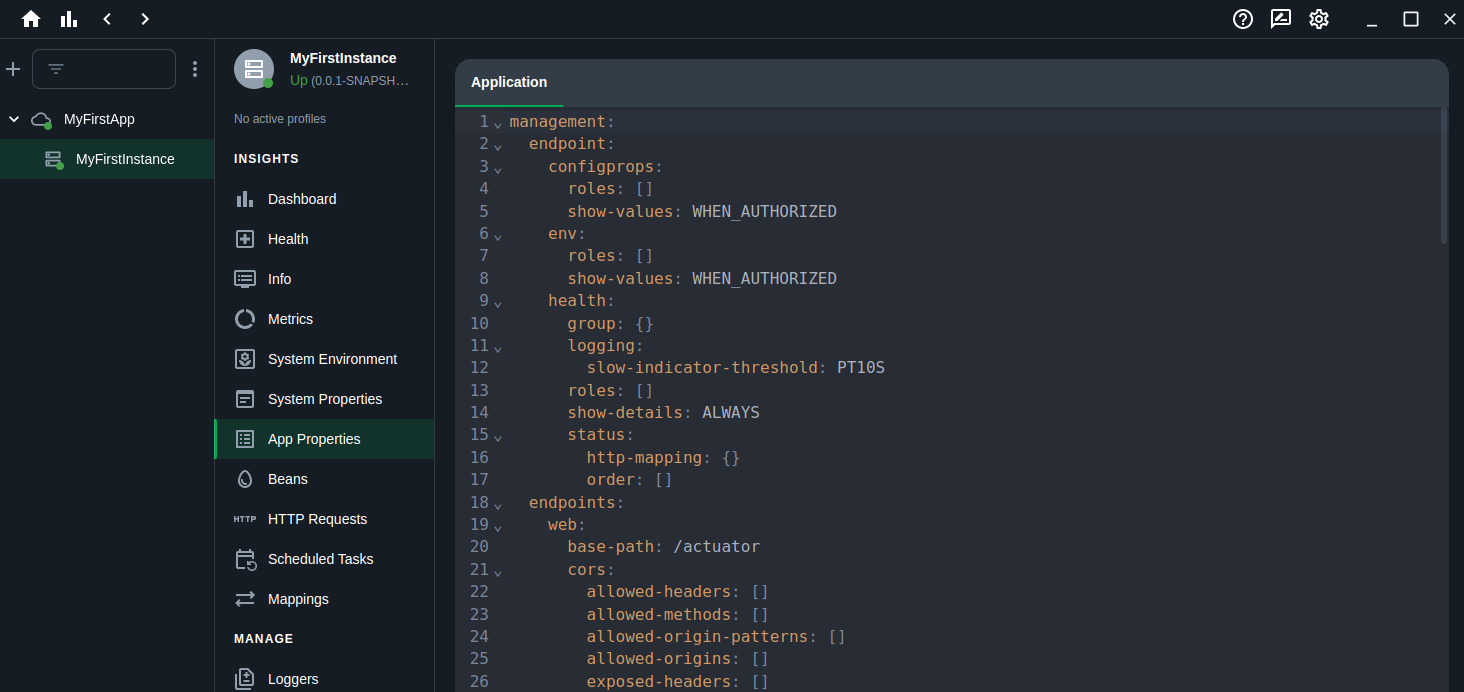
management.endpoint.configprops.show-values=when-authorized
management.endpoint.env.show-values=when-authorized
Build and start the application again. The values are visible.
Metrics
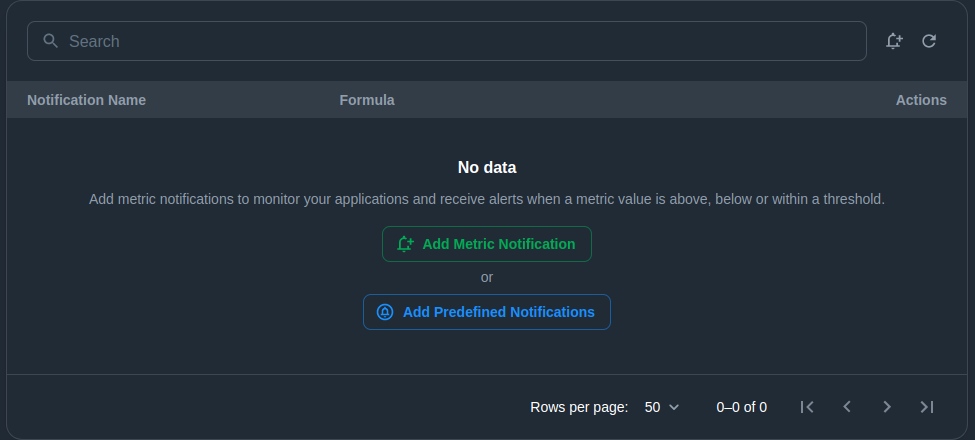
The Metrics page allows you to enable notifications for predefined or custom metrics.
Open the http.server.requests metric and click the Add Metric Notification.
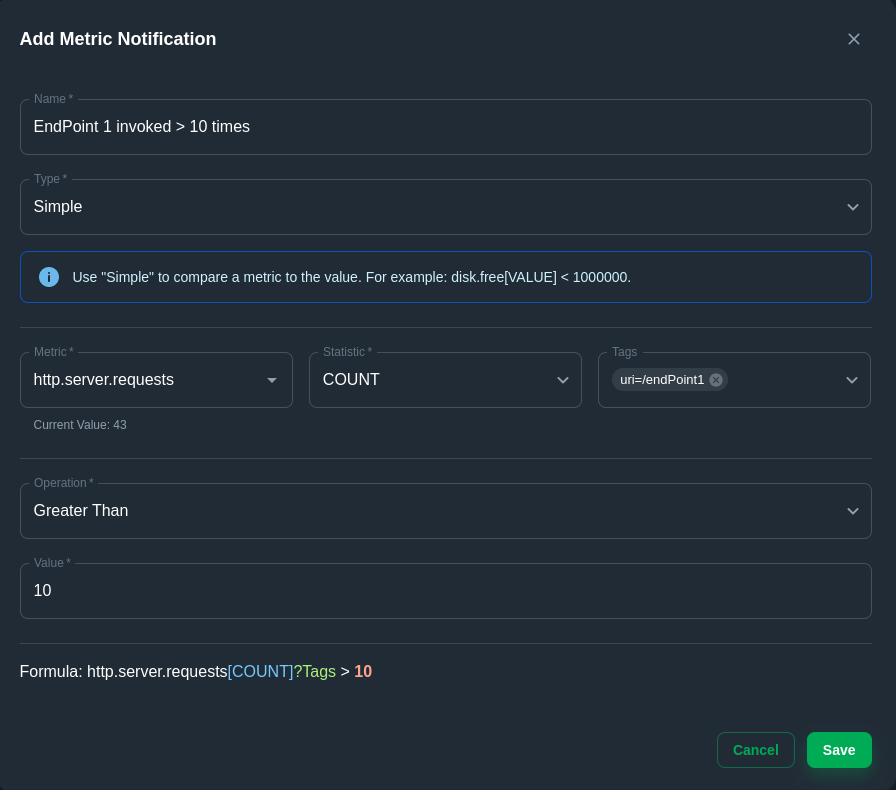
Fill in the following in order to create a notification when EndPoint1 is invoked more than ten times, and click the Save button:
- Name: EndPoint 1 invoked > 10 times
- Type: Simple
- Tags: /endPoint1
- Operation: Greater Than
- Value: 10
Invoke EndPoint1 more than ten times in a row. Wait for a minute, and the notification appears at the top of your main screen.
Loggers
The Loggers page shows you the available loggers, and you are able to change the desired log level. This is an interesting feature when you need to analyze a bug.
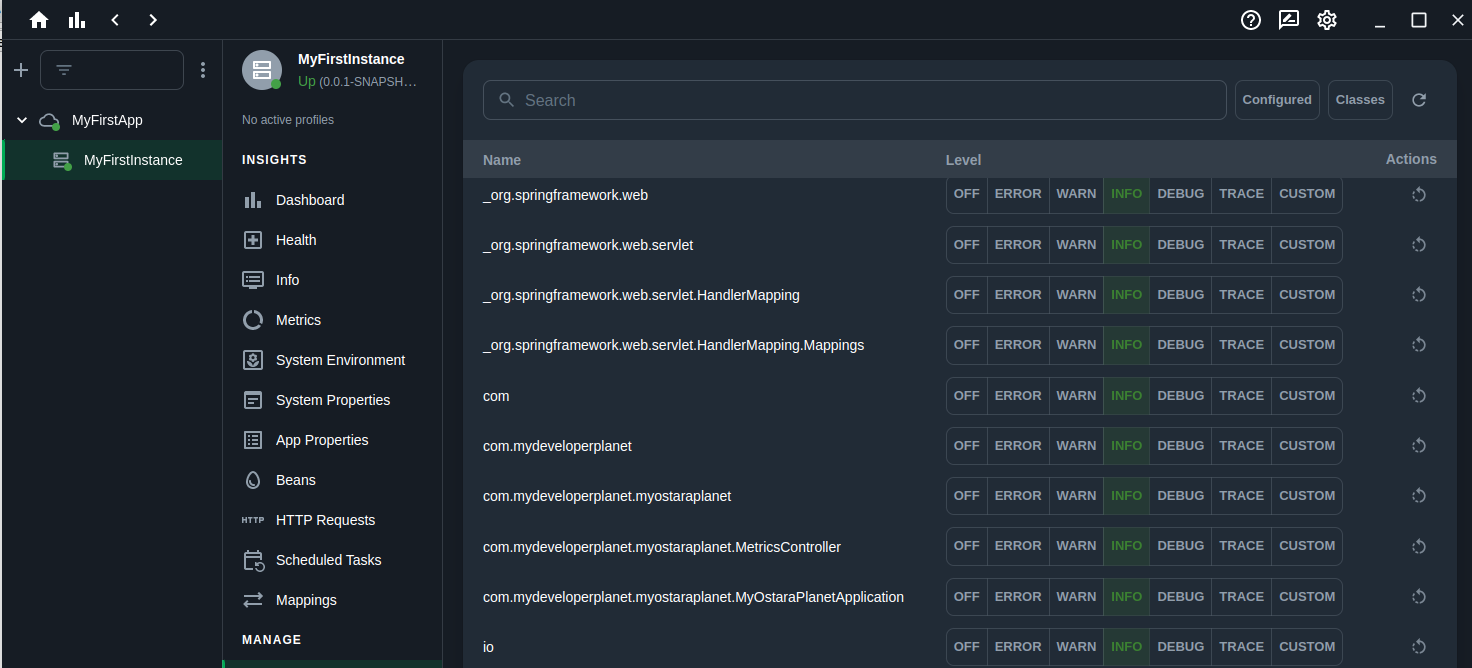
Click the DEBUG button for the com.mydeveloperplanet.myostaraplanet.MetricsController. A message is shown that this operation is forbidden.
The solution is to disable the csrf protection for the actuator endpoints. For more information about csrf attacks, see this blog.
Add the following line to the WebSecurity class.
public SecurityFilterChain securityFilterChain(HttpSecurity http) throws Exception {
    http.authorizeHttpRequests(authz -> authz
            .requestMatchers("/actuator/**").hasRole("ADMIN")
            .anyRequest().permitAll())
            .csrf(csrf -> csrf
                    .ignoringRequestMatchers("/actuator/**")
            )
            .httpBasic(Customizer.withDefaults());
    return http.build();
}
Also, add some logging statements to the EndPoint1 code in order to verify the result.
@RequestMapping("/endPoint1")
public String endPoint1() {
    logger.debug("This is DEBUG message");
    logger.trace("This is a TRACE message");
    return "Metrics for endPoint1";
}
Build and restart the application.
Enable the DEBUG logging again for the MetricsController and invoke EndPoint1. The DEBUG statement is shown in the logs.
2023-09-10T15:06:04.511+02:00 DEBUG 30167 --- [nio-8080-exec-8] c.m.myostaraplanet.MetricsController : This is DEBUG messageMultiple Instances
When you have multiple instances of your application, you can create another instance to monitor.
Start another instance of the application on port 8081.
$ java -jar -Dserver.port=8081 target/myostaraplanet-0.0.1-SNAPSHOT.jarHover over MyFirstApp and click the three dots menu. Choose Add Instance and fill in the following:
- Actuator URL
- Alias: MySecondInstance
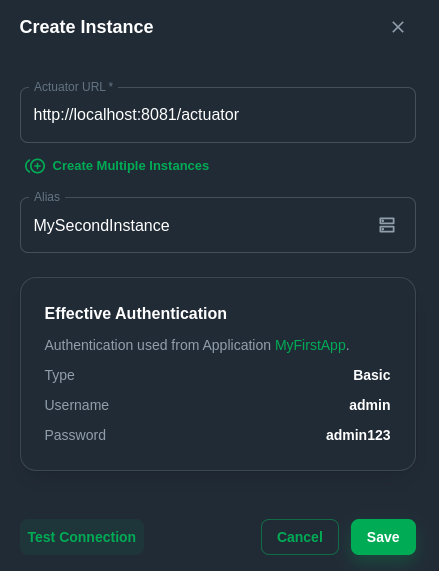
Clicking the Test Connection button is successful this time. Click the Save button.
The second instance is added, and the application dashboard view shows the summary information.

Conclusion
Ostara is a good alternative for monitoring Spring Boot applications. The installation only requires you to download a file and start it. Ostara gives you a clear visual view, and the notifications notify you when something is wrong. It is also capable of starting thread profiling on your instance and downloading heap dumps. Compared to Grafana, Grafana has some more fancy graphs than Ostara. However, Ostara is not only a visualization tool; but you can also interact with your application and receive notifications when something goes wrong.
Published at DZone with permission of Gunter Rotsaert. See the original article here.
Opinions expressed by DZone contributors are their own.
Comments