How to Run a Stress Test in JMeter
Stress testing tests the expected number of users, tests the system’s behavior under intense loads, and examines how it recovers when going back to normal usage.
Join the DZone community and get the full member experience.
Join For FreeLet’s think about the following scenario: a system that displays students’ exams results was tested by multiple automated functionality tests. The performance test results were also promising. The system was ready to be deployed to a live server. However, when the exam results were published on the system, the servers slowed down and stopped working.
What happened? When the exam results were published, all the students wanted to check the results as early as possible. They produced a simultaneous very high server load and the server was not able to process the requests. First, it was slowed down by the database machine. Then, it didn't serve the middle layer with data and the software was not prepared for this situation and stopped running.
What did the performance testers miss? Stress testing. In addition to testing the expected number of users, stress testing tests the system’s behavior under intense loads, as well as examining how it recovers when going back to normal usage. Stress testing can be easily done with open-source testing tools like JMeter.
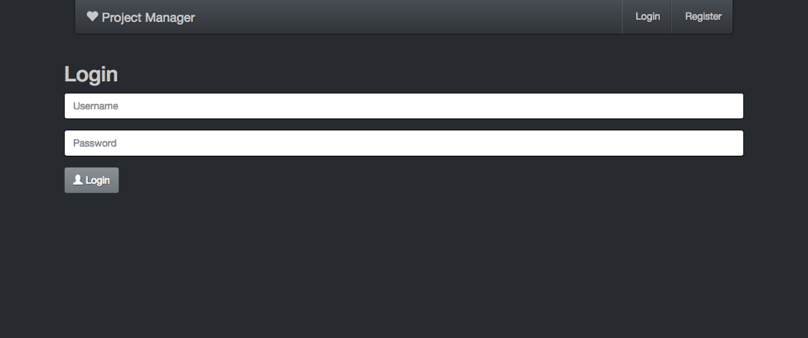
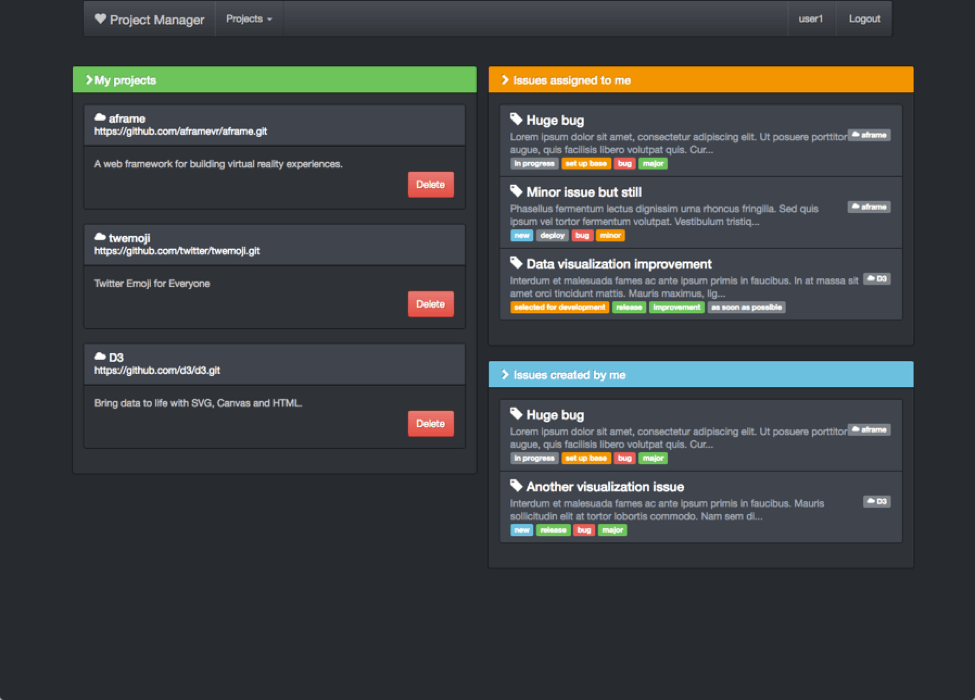
The example application we will use for testing in this post is a project management tool under development. Currently, it has some basic features:
Login.
Create a project and link a GitHub repository to it.
Create issues within the created project.
The first step of the stress test is identifying the key scenarios. Select scenarios based on their business value (how important they are for your success) and user preference (where users spend most of their time).
In this test, we will examine the response time for the website’s login page and the project details page.
The response time is important because loading time is a major contributing factor to page abandonment. With the increase of the internet connection speed, the average user patience is going down. If a website’s load time is more than four seconds approximately 25% of the users will leave.
We chose the login function — which provides access to the database — because it is a crucial part of every system.
We chose the project details page because, in the tested system, it reads data from many tables, and we expect users to spend most of their time on that page. Therefore, we want to be sure if that page will be loaded in reasonable time even during excessive usage.


Now that we’ve identified our testing goals, let’s characterize their test cases:
Test Case 1: Login Test Steps
Go to the Login page.
Enter user credentials.
Hit the Login button.
Wait for the Login response.
Test case 2: Project Details Page Test Steps
Go to the Login page.
Enter user credentials.
Hit the Login button.
Load the Dashboard page.
Click on an existing project.
Creating and Recording the Test Script
After deciding on the test cases, we can continue with the creation of the test scripts. The quickest way to create a JMeter test script is by recording. You can use the JMeter recorder or the BlazeMeter Chrome Extension, which is free at the Chrome store and more user-friendly since you don’t have to set up a proxy to use it, like when using the JMeter recorder.
Through your Chrome, start recording and simulate the user scenario you decided to test. When done, stop the recording.

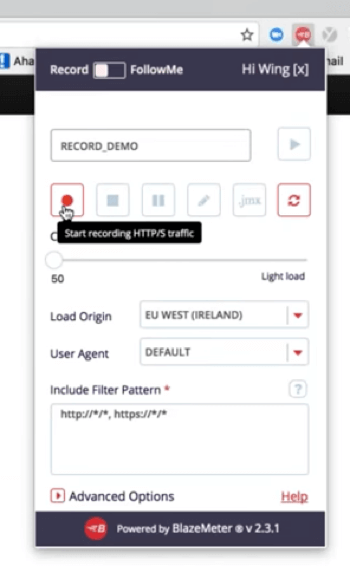
Export the file to JMX and open it in JMeter, where you can edit and configure its parameters.
Each test has its own unique configurations, like CSRF tokens, response assertions, and timers, but the similarity among all stress tests is checking the system’s performance for a large number of users. Your business goals should determine the number of users you are testing.
In this case, we want to stress test 1,000 users.
To do that, you need to configure the Thread Group. The most important configurations of the Thread Group are the number of threads, the ramp-up time, and the loop count. The number of threads sets the number of simulated users, the ramp-up time sets how long it will take to JMeter start execution of all the threads, and the loop count is the number of times the test scenario should be executed.

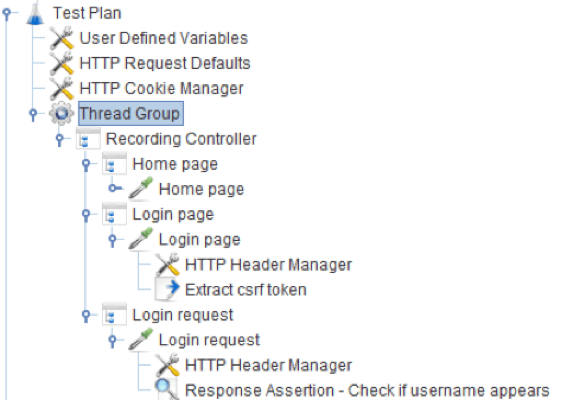
The results show us that the request process time for the login page is 68 milliseconds and for the project details page it is 1539 milliseconds. Therefore, we can conclude that a lot of resources are utilized during the project page load.

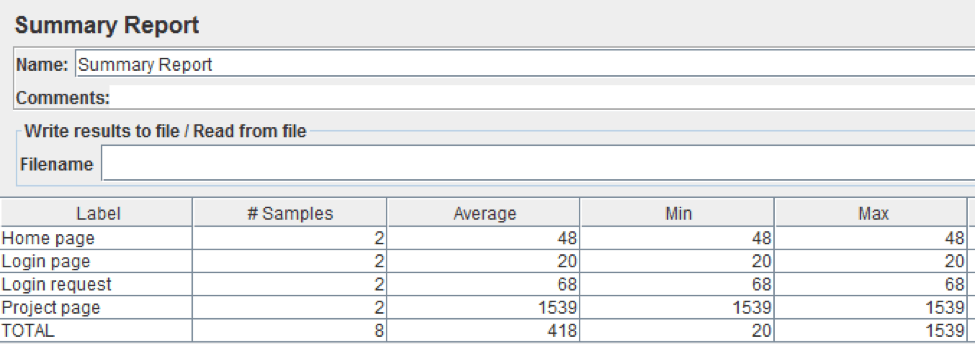
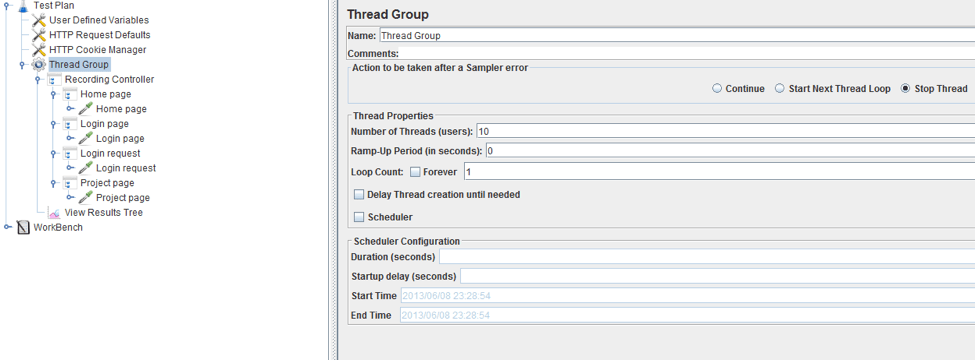
Now, we can start increasing the number of threads we are testing. We move on to 10 threads, zero ramp-up, and one loop. Since we are still testing a small number of threads, we can use JMeter in GUI mode and view tests through a listener.

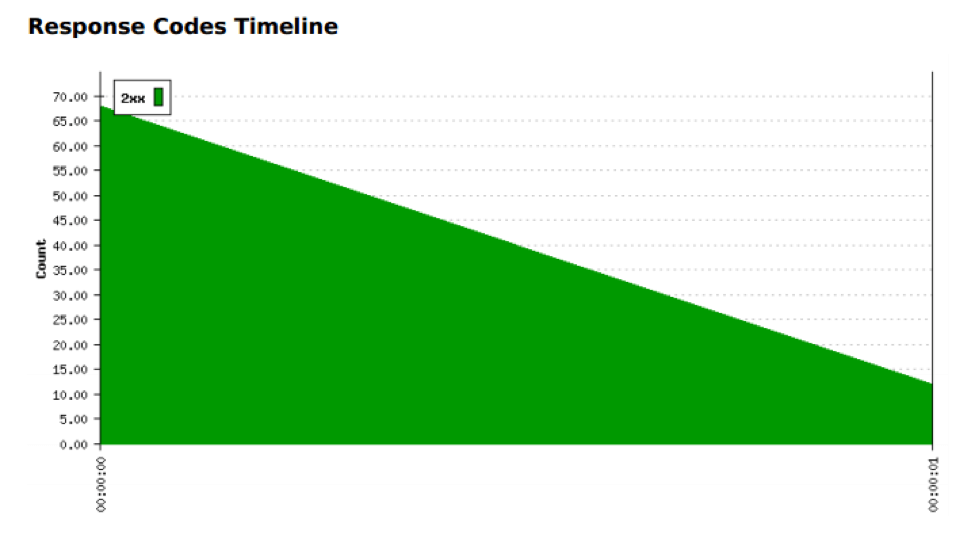
We can see the system was able to properly handle all the requests:

Now, we will increase the number of users to 100 (10% of target). The only parameter in the script that we need to change is the Number of Threads and we can run the script again. Do not forget to clean the listener between the test runs in case you are using one.
After that, increase the load to 50% of target. In our case, this is 500 users. Based on the results, we can continue increasing the load (if the test is successful) or decreasing it (if there are errors). In case we need to go down, we should find out how many users break our system so we can decide how to fix bottlenecks.
If the results are all green for the 500 thread test, increase the thread number to the goal of 1,000 users. To get more accurate results, we recommend you switch the test to the Stepping Thread Group, which you can add from the JMeter Plugins Manager.
The Stepping Thread Group lets you configure how many threads to start with, how many should be added over time to reach the maximum, how long the threads should hold and how long the ramp-down period is. Due to its ramp-down abilities, the Stepping Thread Group is perfect for examining system recovery.

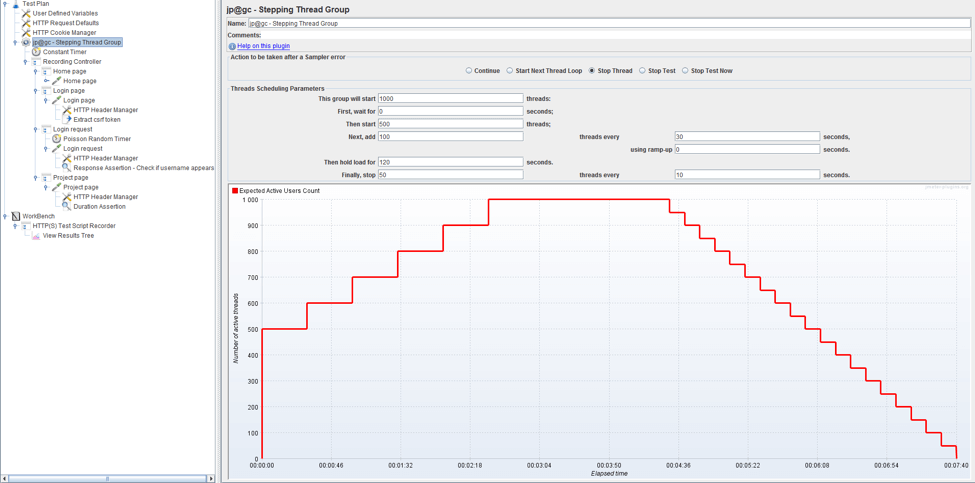
This test starts out with the 500 threads that we know the server can handle. Then, we configured JMeter to increase 100 threads every 30 seconds. This way, if there is an issue before reaching our goal, we can find out where and what it is. We configured 1,000 threads to run for 2 minutes (120 seconds). To see how well the system recovers there is a ramp-down period - every 10 seconds 50 threads will be stopped.
There is a limit to how many threads can run on a single machine during stress testing. But there are several simple ways to increase this number. Try to run JMeter in non-GUI mode, which is a must in the case of big numbers of threads. We should also avoid listeners in the test plan to further optimize the test run. If these simple tweaks are not enough, distribute the number of threads between multiple machines. Results can be generated after the testing is done. Of course, you can also use CA BlazeMeter, which is sort of a JMeter in the cloud.
JMeter will provide us with KPIs like response times, throughput and error rate. In addition, we recommend you monitor server performance as well. CPU usage, memory usage, input and output, and database logs are helpful parameters to determine system bottlenecks.
Published at DZone with permission of Tibor Dudjik. See the original article here.
Opinions expressed by DZone contributors are their own.

Comments